Contract volume has now turned negative on both scales this summer. NAR's Pending Home Sales Index for the South region went negative in June (-0.9% year over year, after five positive months) and fell -3.0% in July. Greater Nashville followed a month later: contracts here were -2.4% in July and are running -7.7% so far in August. The metro's count on August 18 is 2,646 single-family homes and condos under contract, below the same week of all three prior years.
This post puts Nashville's contract volume next to NAR's monthly readings for the South, 31 months side by side, then checks the weekly count against 2023-2025.
1. How does Nashville compare to the rest of the South?
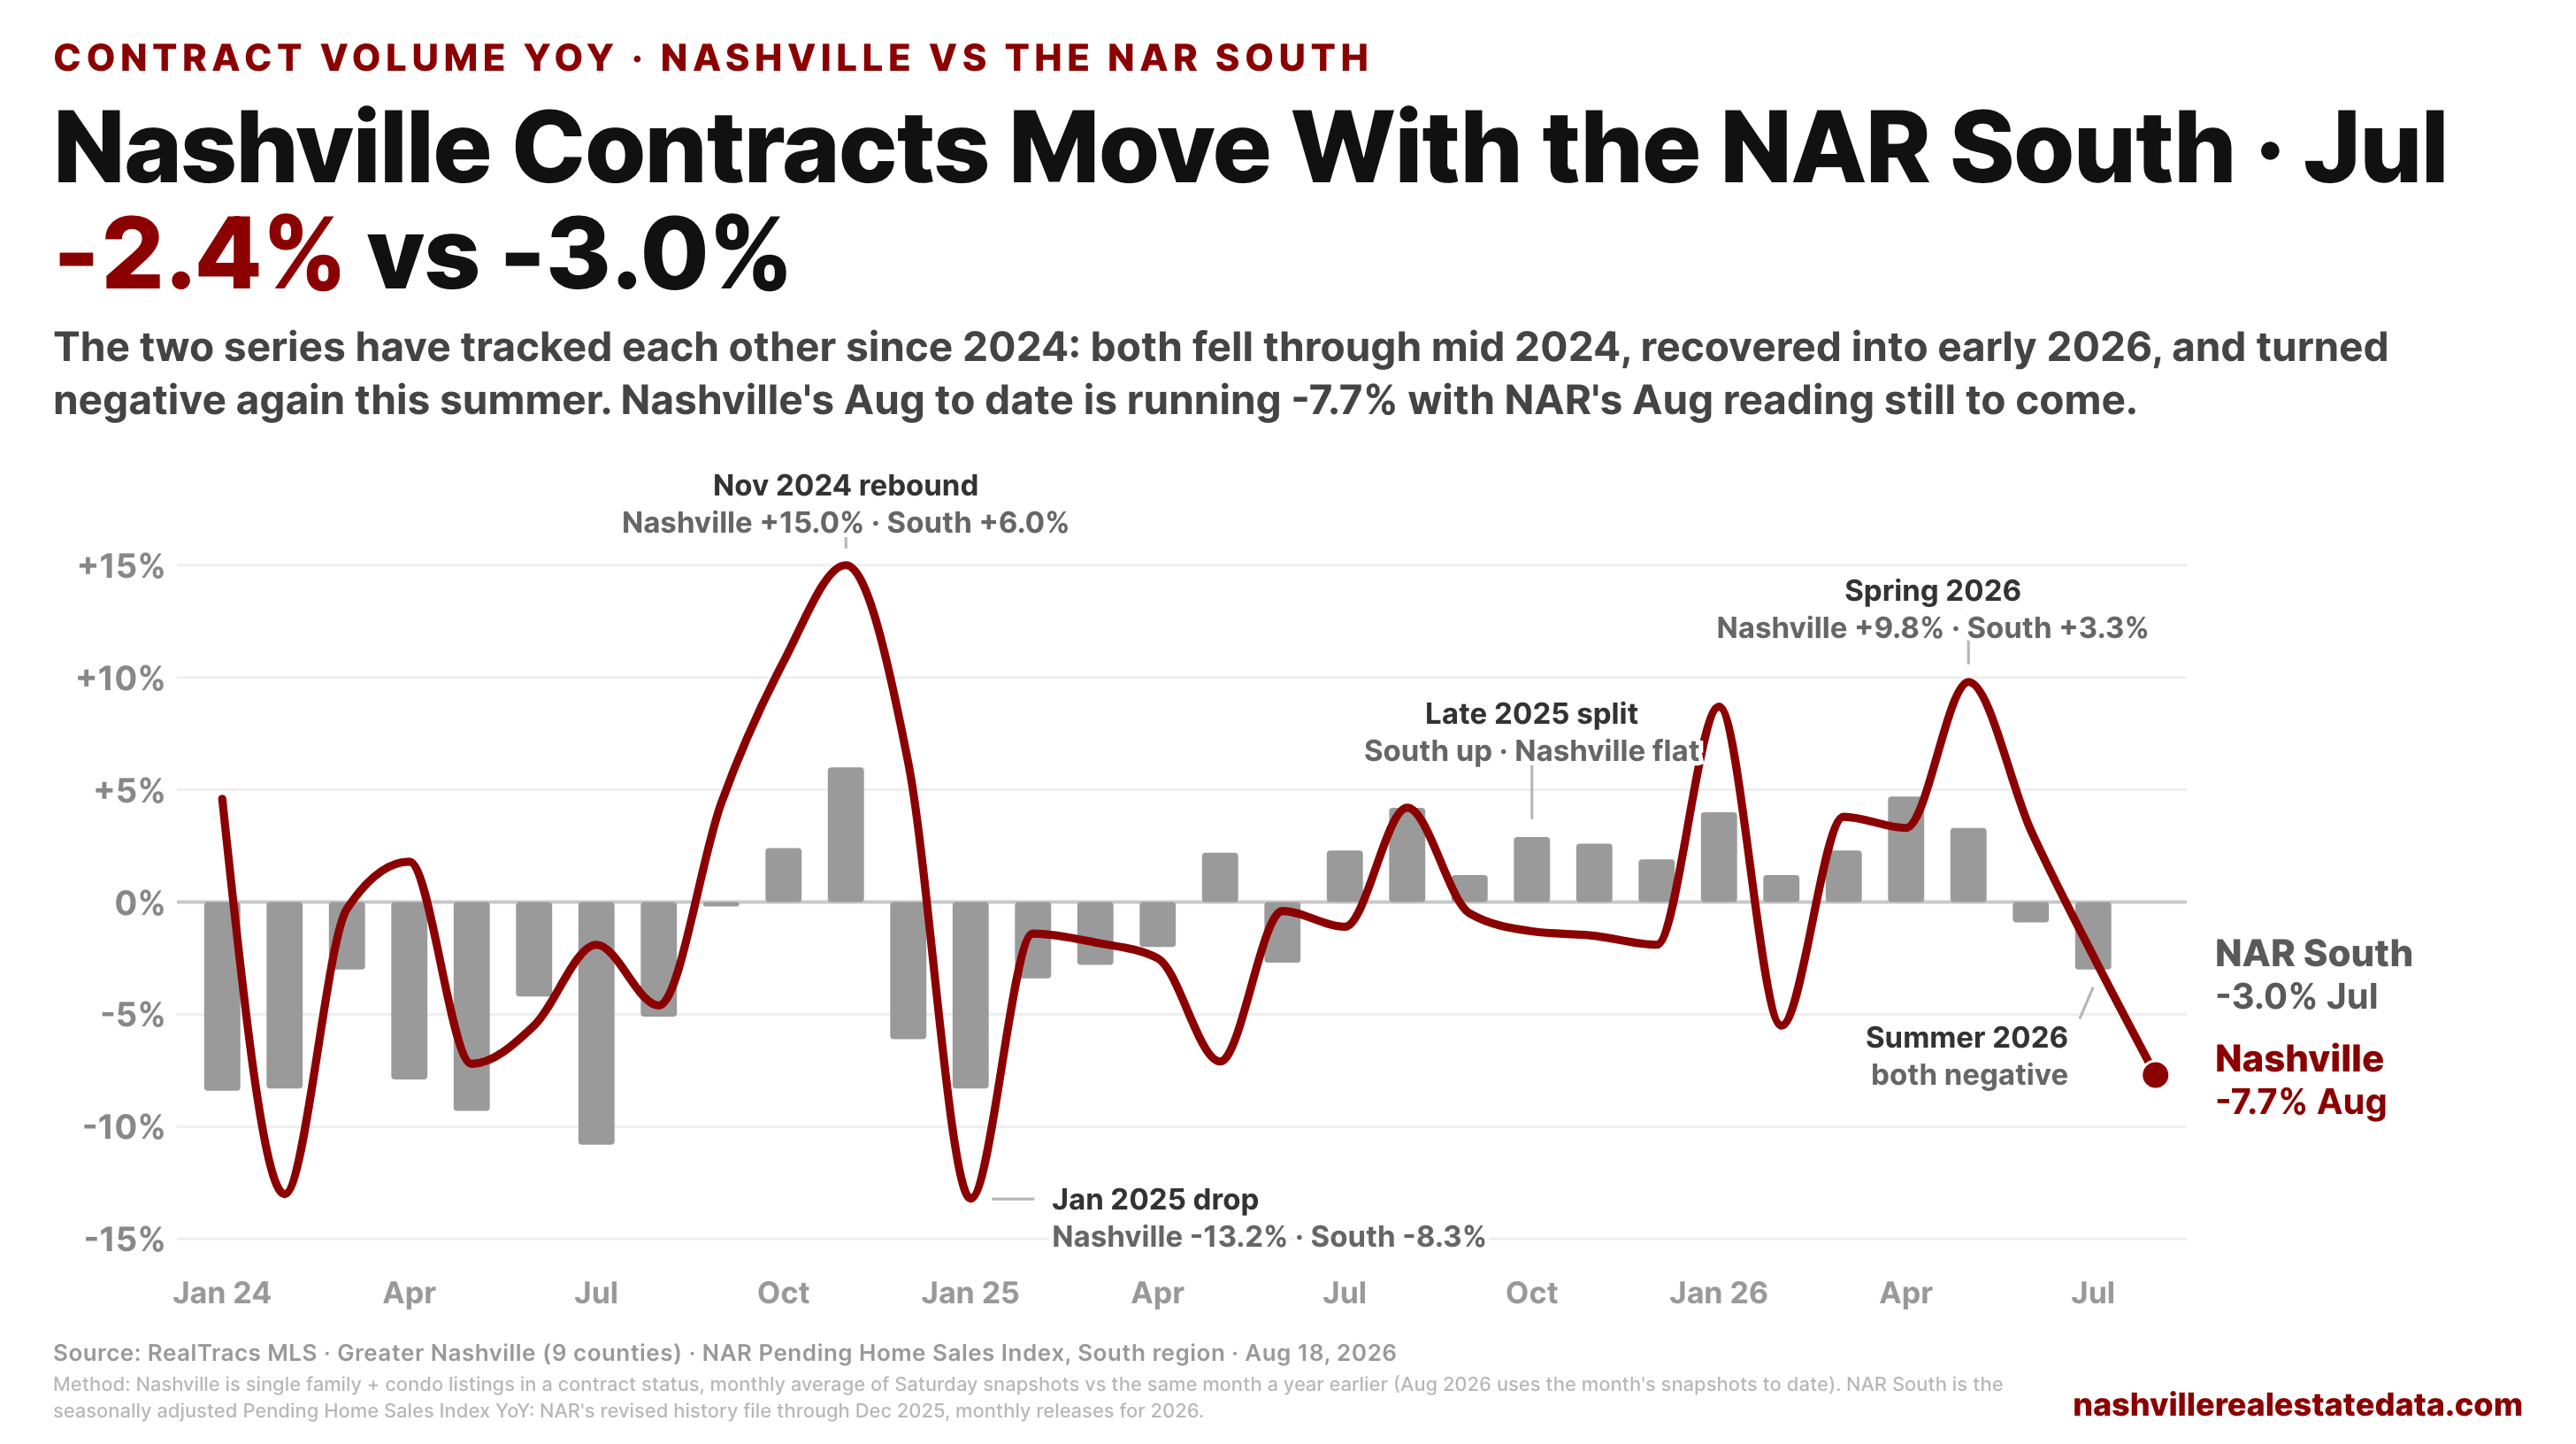
The two series move through the same turns. Both fell through mid 2024, both jumped in the November 2024 rebound (Nashville +15.0%, South +6.0%), both dropped in January 2025 (Nashville -13.2%, South -8.3%), and both recovered into early 2026. In May 2026 Nashville was +9.8% against the South's +3.3%.
The turn came in June. The South went negative at -0.9%, its first negative month of 2026, and fell to -3.0% in July. Nashville stayed positive one month longer (+3.2% in June), then went negative in July at -2.4%, its first negative month since February. In the seven months of 2026 both have reported, Nashville ran above the South in five (January, March, May, June, July) and below in two (February, April).
July itself is close to even: -2.4% here vs -3.0% across the region. The separation shows up in August, and NAR's August reading is not out yet.
2. Where does the weekly count stand?
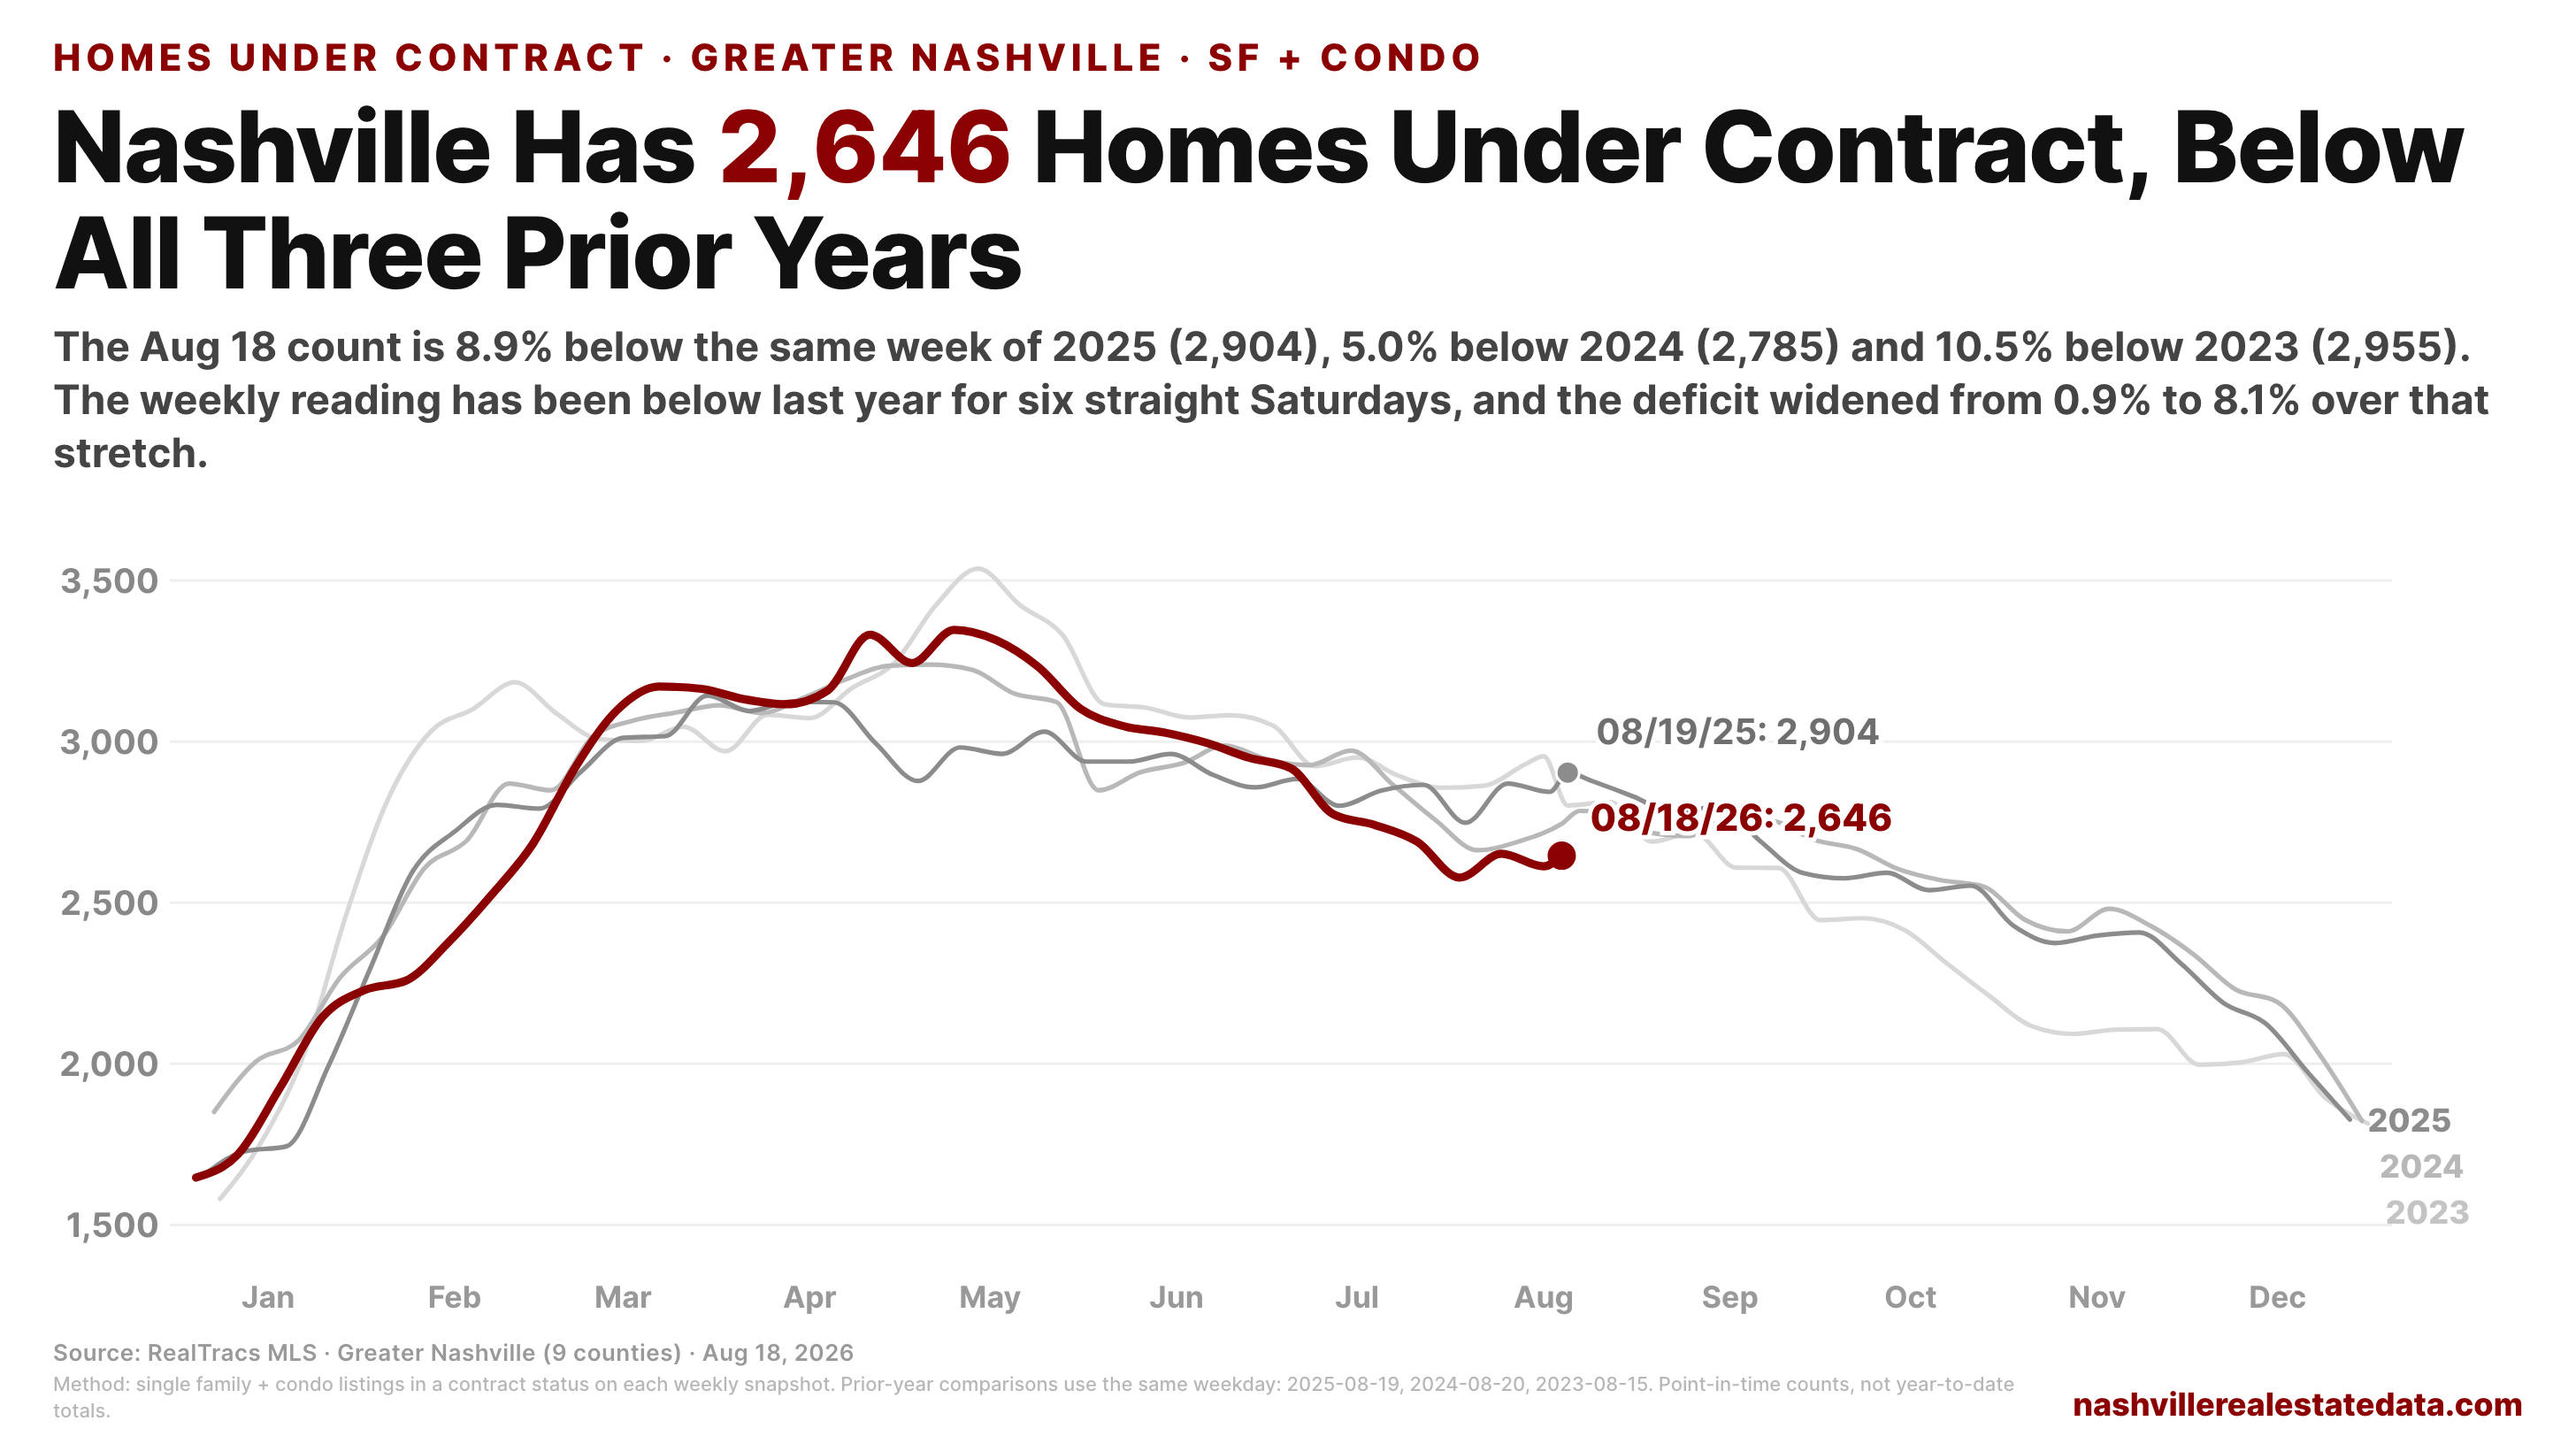
The August 18 count of 2,646 is -8.9% against the same week of 2025 (2,904), -5.0% against 2024 (2,785) and -10.5% against 2023 (2,955). Prior-year weeks are matched on weekday (08-19-25, 08-20-24, 08-15-23), since the snapshot count runs higher midweek than on Saturdays; matching on calendar date instead gives smaller deficits (-3.6% vs 2024, -5.6% vs 2023) and the count is below all three prior years either way. The weekly reading has been below last year for six straight Saturdays, since the week of 07-11, and the deficit widened from -0.9% to -8.1% over that stretch. The earlier 2026 dip did recover: February's monthly reading was -5.5% and the series was back above last year by March, so a negative run alone is not conclusive. What separates this one is the slope and the level, six deepening readings and a count below every prior year on the chart.
One base-year caution on the August percentage. August 2025 was the only month of 2025 with contract volume above its own prior year (+4.2%), so the -7.7% August-to-date reading is measured against 2025's strongest month. Against 2024 the month is running -3.9%, and against 2023 it is -8.3%. July has the same shape: -2.4% vs 2025, -3.5% vs 2024, -5.3% vs 2023. The decline holds against every base, the vs-2025 number just states it at its largest.
Underneath the total, the decline is entirely on the house side: single-family contracts are -12.3% year over year while condo contracts are +12.2%.
What this adds up to
- Contract volume turned negative across the South in June and in Nashville in July, so the metro's summer slowdown is part of a regional turn.
- Nashville's decline is running faster: -7.7% August to date against the South's July -3.0%, with six straight negative weekly readings and a count below all three prior years.
- The vs-2025 August number is measured against 2025's strongest month; the decline is smaller vs 2024 (-3.9%) but holds against every base.
- The split under the total is houses -12.3%, condos +12.2%.
For sellers, the buyer pool measured by contracts is smaller than it was in any of the past three Augusts, and the change came fast: the metro was +9.8% year over year in May. For buyers, fewer competing contracts against inventory that has kept building is the practical read. For anyone watching the market, the open question is whether August is a Nashville story or a Southern one, and that resolves on a date: NAR publishes the South's August reading on September 10.
Two checks will settle it. First, the last two August Saturday readings (08-22 and 08-29): if both stay below their 2025 matches, the negative run reaches eight straight weekly readings and August finishes as a full month below last year. Second, the NAR release: a South reading holding near -3% while Nashville finishes near -7% means the extra decline is specific to Nashville, while a South reading falling toward -6% or lower makes this a regional decline that Nashville is running ahead of.
Data through August 18, 2026, Greater Nashville (9 counties: Davidson, Williamson, Rutherford, Wilson, Sumner, Maury, Dickson, Cheatham, Robertson). Sources: RealTracs MLS; NAR Pending Home Sales Index, South region (NAR's revised history file through December 2025, monthly releases for 2026).