447 Single Family homes are listed under $300K in Greater Nashville, against 358 at the same week of 2025 (+24.9%), 272 in 2024 and 263 in 2023. 447 is above every week of the 4 years of data. The prior high was 410 on September 27, 2025. 133 homes in the band went under contract in the last 31 days, against 176 last year (-24.4%), 150 in 2024 and 169 in 2023, and the count has been below all 3 prior years at each of the last 4 data points. 4 weeks ago the band had 418 listings and 162 contracts, 1.2% below last year.
The 30 year mortgage rate was 7.33% on October 23, against 7.43% 4 weeks ago and 6.19% at this week of 2025. 6 charts below cover the listing count, the contract count, a second contract count that includes the contracts that already closed, the counties, what type of homes these are, and the band's closings. Part 7 puts the listings on the NRD neighborhood map and shows the map's own chart for the 8 areas with the most of them. Part 8 has a chart for each of the 7 zip codes with the most of these listings, plotting every listing under $300K there since 2023.
1. How many Single Family homes are listed under $300K?
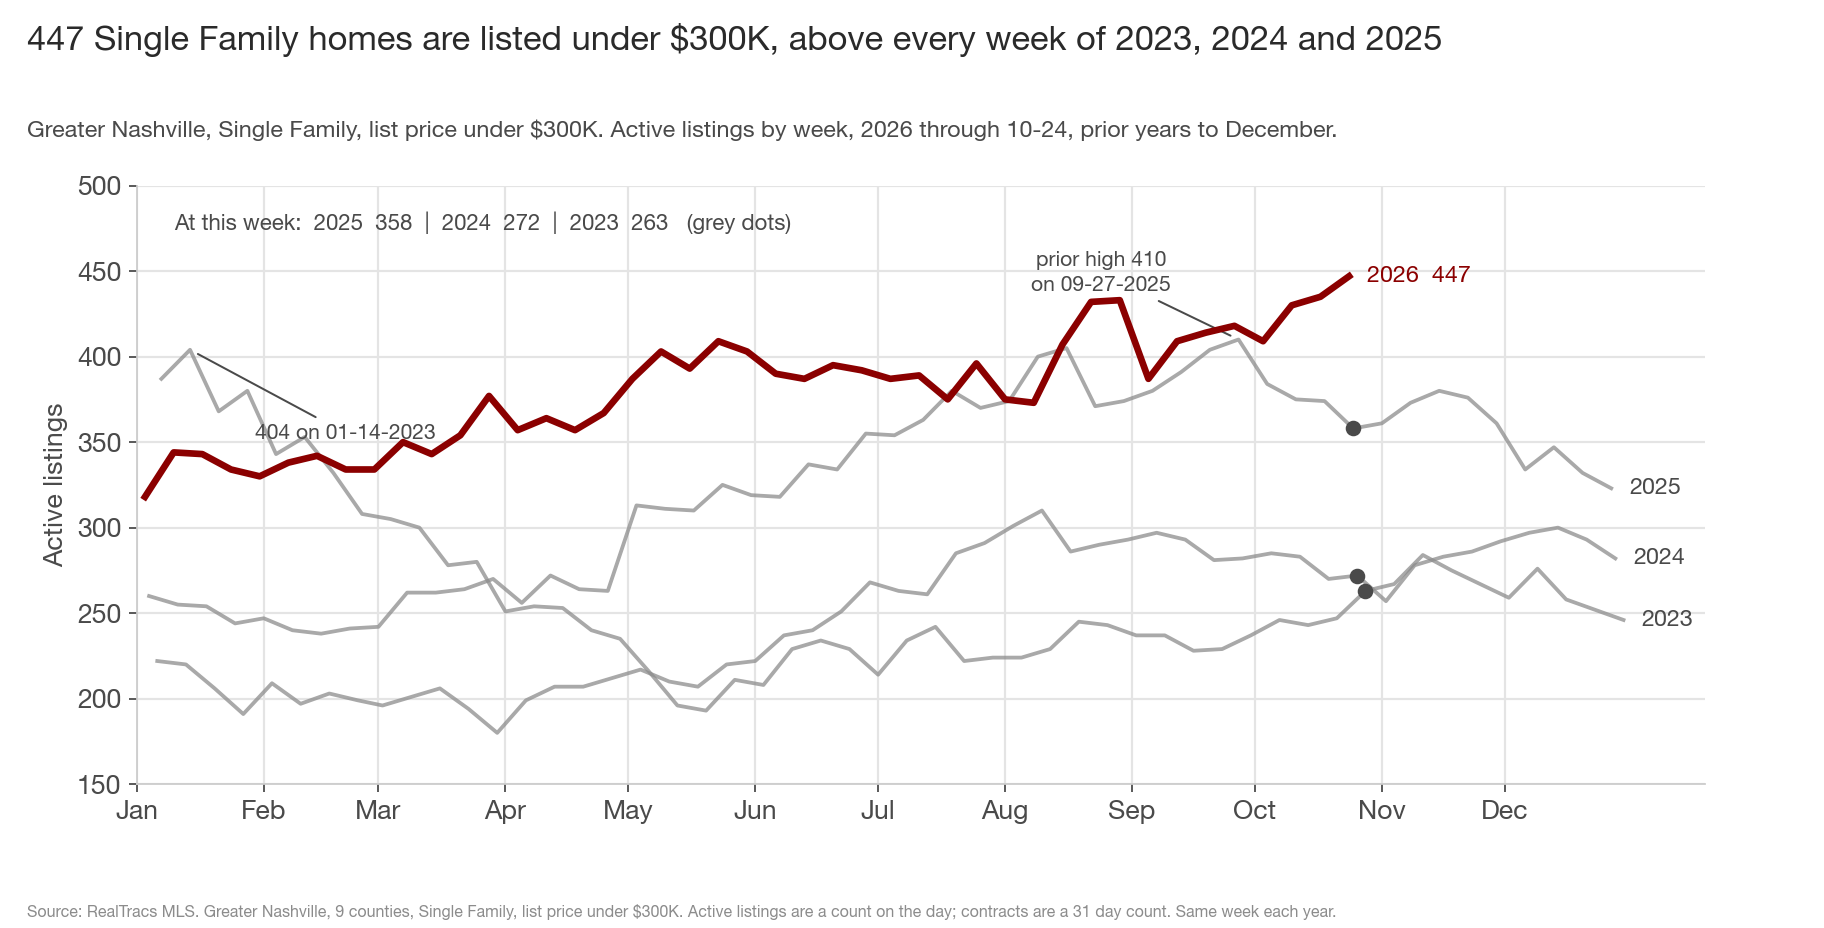
- The count is above every week of 2023, 2024 and 2025 and above every earlier week of 2026. The prior high in the data was 410 on September 27, 2025. The 2023 data starts at 404 in the second week of January, when listings were still coming down from 2022, and the band did not get back to 400 until September 2025.
The band's count has been above last year at every data point of 2026 except July 18 and August 8. It was 418 four weeks ago, 2.0% above last year. The gap vs last year went from 8 listings to 89 in 4 weeks because 2026 rose 29 (418 to 447, +6.9%) while 2025 fell 52 (410 to 358, -12.7%). Over the same 4 weeks the count fell 3.5% in 2024 and rose 11.0% in 2023. Most of the change in the gap is last year's count falling. 447 is the most in the data either way.
The under $300K band is 4.5% of the 9,991 active Single Family listings in Greater Nashville. 2 of the 6 Single Family price bands are at their highest listing count of the 4 years of data this week: under $300K and $300K to $500K (3,301, prior high 3,156 on July 26, 2025). The other 4 bands are below their 2026 highs. Under $300K has the largest rise vs last year of the 6 bands, +24.9%; the next is $2M+ at +14.4%.
Condos under $300K are not in these numbers. There are 764 condos listed under $300K, 38.7% above last year's 551, and the condo count was at its high of 775 on September 19. Condo contracts in the band are 114 against 121 last year (-5.8%).
2. How many are going under contract?
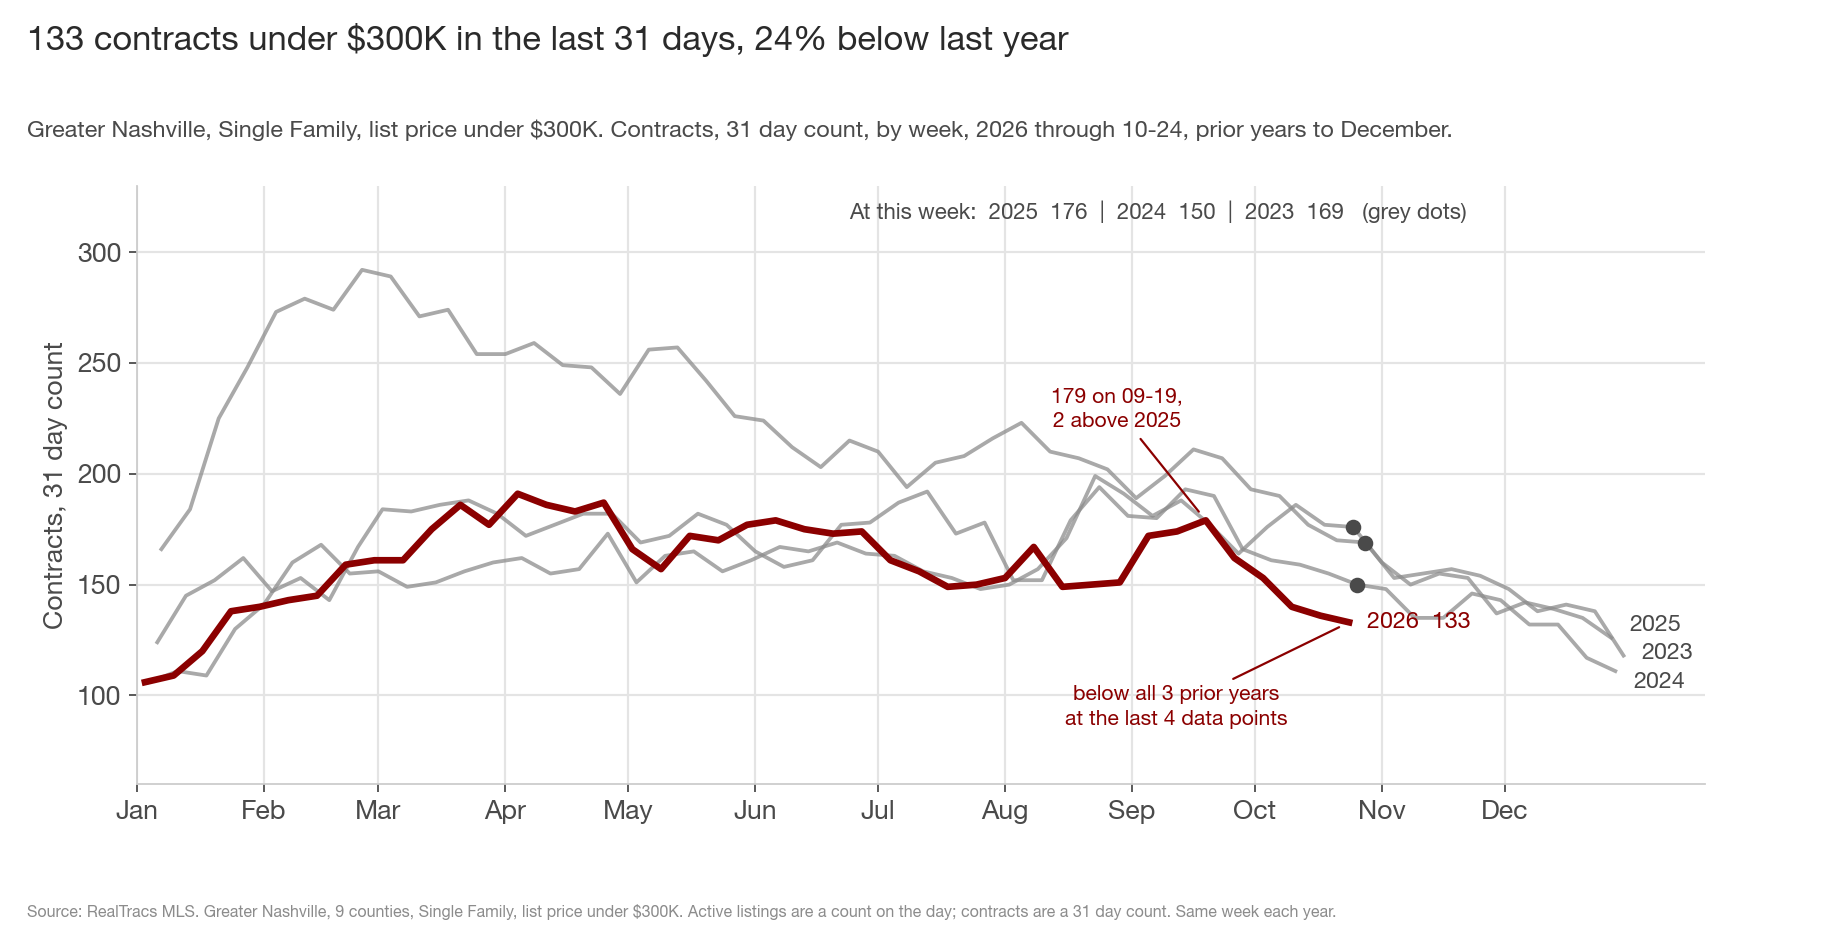
133 in the last 31 days. That is 24.4% below last year's 176, 11.3% below 2024 (150) and 21.3% below 2023 (169), when the mortgage rate was 7.88%. The count has been below all 3 prior years at the last 4 data points (October 3, 10, 17 and 24) and at 16 data points of 2026 in all. 133 is the lowest count since January 17 (120).
On September 19 the band was at 179, 2 above last year. The September 22 post found the band's contracts 5.3% above last year with rates rising, and the October 3 post found the count under 160. The last 5 data points are 162, 153, 140, 136 and 133. The 2025 count was 164, 176, 186, 177 and 176 over the same weeks. The gap vs last year went from -2 to -43 because 2026 fell 29 while 2025 rose 12.
With 447 listings and 133 contracts there are 3.4 active listings for every contract in the band, against 2.0 last year, 1.8 in 2024 and 1.6 in 2023. The band's high in 2023 through 2025 was 2.6. 4 weeks ago the band was at 2.6 against 2.5 last year. Across all Single Family listings the number is 5.8, which the October 9 post covered.
All 6 Single Family price bands are below last year on contracts. $500K to $750K has the largest decline, -27.9%, then under $300K at -24.4% and $750K to $1M at -23.9%.
3. Does the decline hold when the contracts that already closed are included?
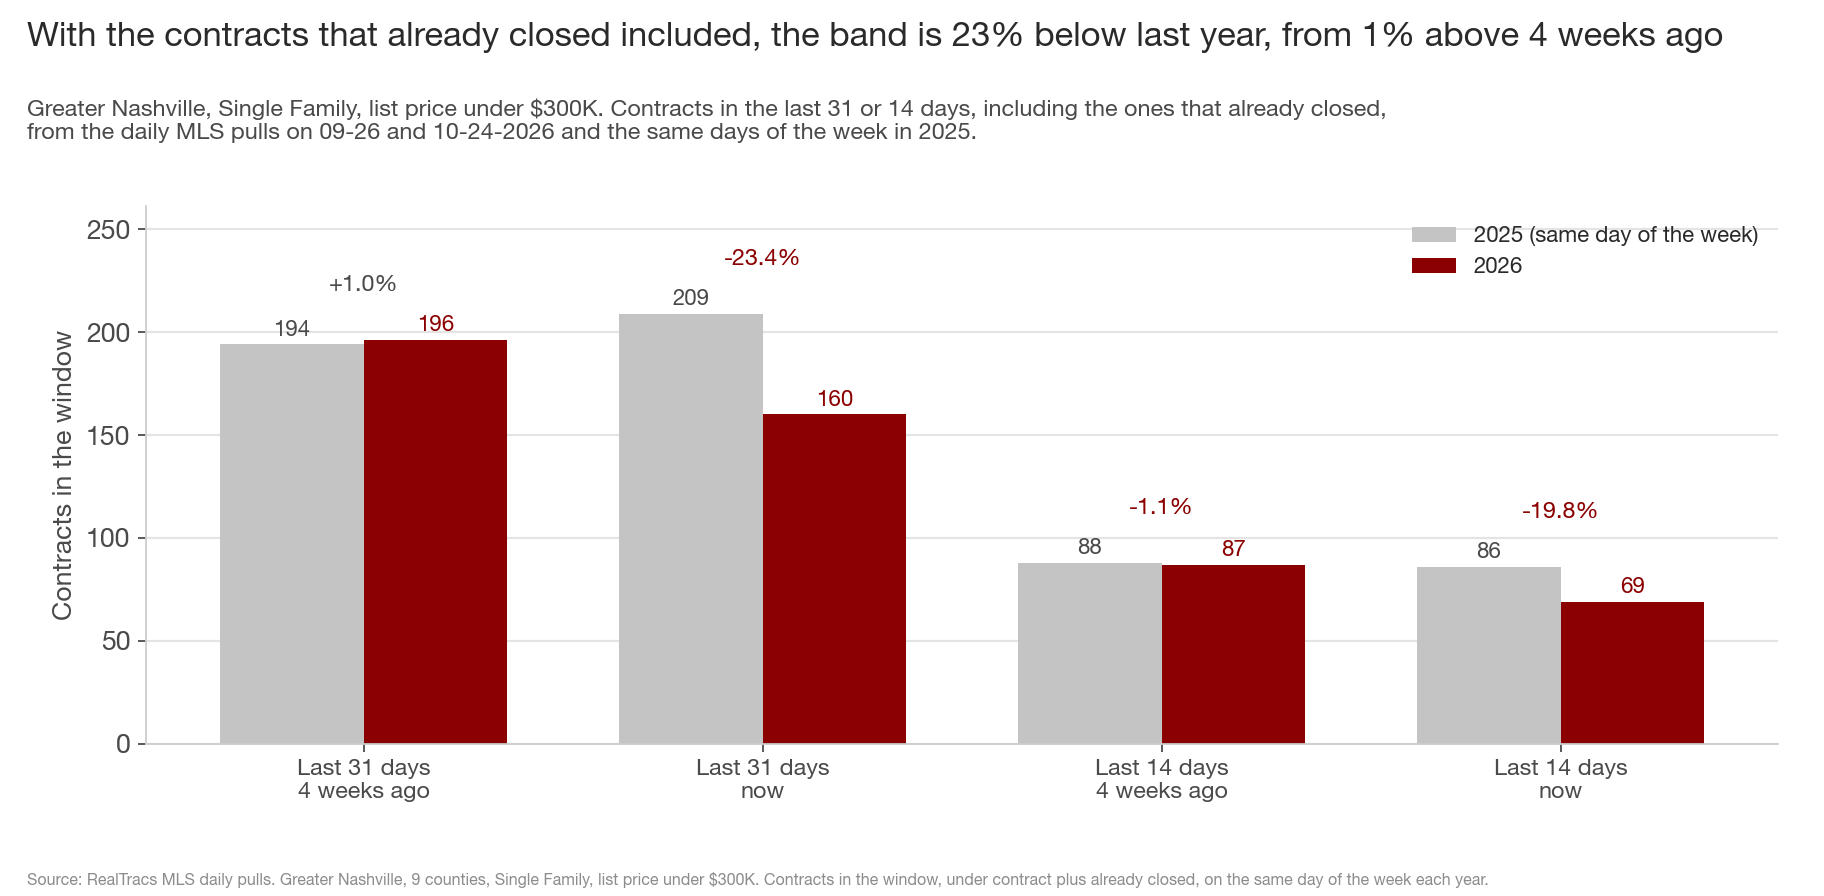
Yes. The weekly count above is listings under contract right now, so a contract that closed within the 31 days is not in it. The daily MLS pull shows when a closed listing went under contract, so I added back the closings that went under contract in the window.
Contracts in the last 31 days, including the ones that already closed, are 160 against 209 last year (-23.4%), 181 in 2024 (-11.6%) and 200 in 2023 (-20.0%). 4 weeks ago that count was 196 against 194 (+1.0%). Contracts in the last 14 days are 69 against 86 (-19.8%). 4 weeks ago the 14 day count was 87 against 88. The decline is in both numbers, and the last 2 weeks are as far below last year as the last 4.
4. Which counties have the listings?
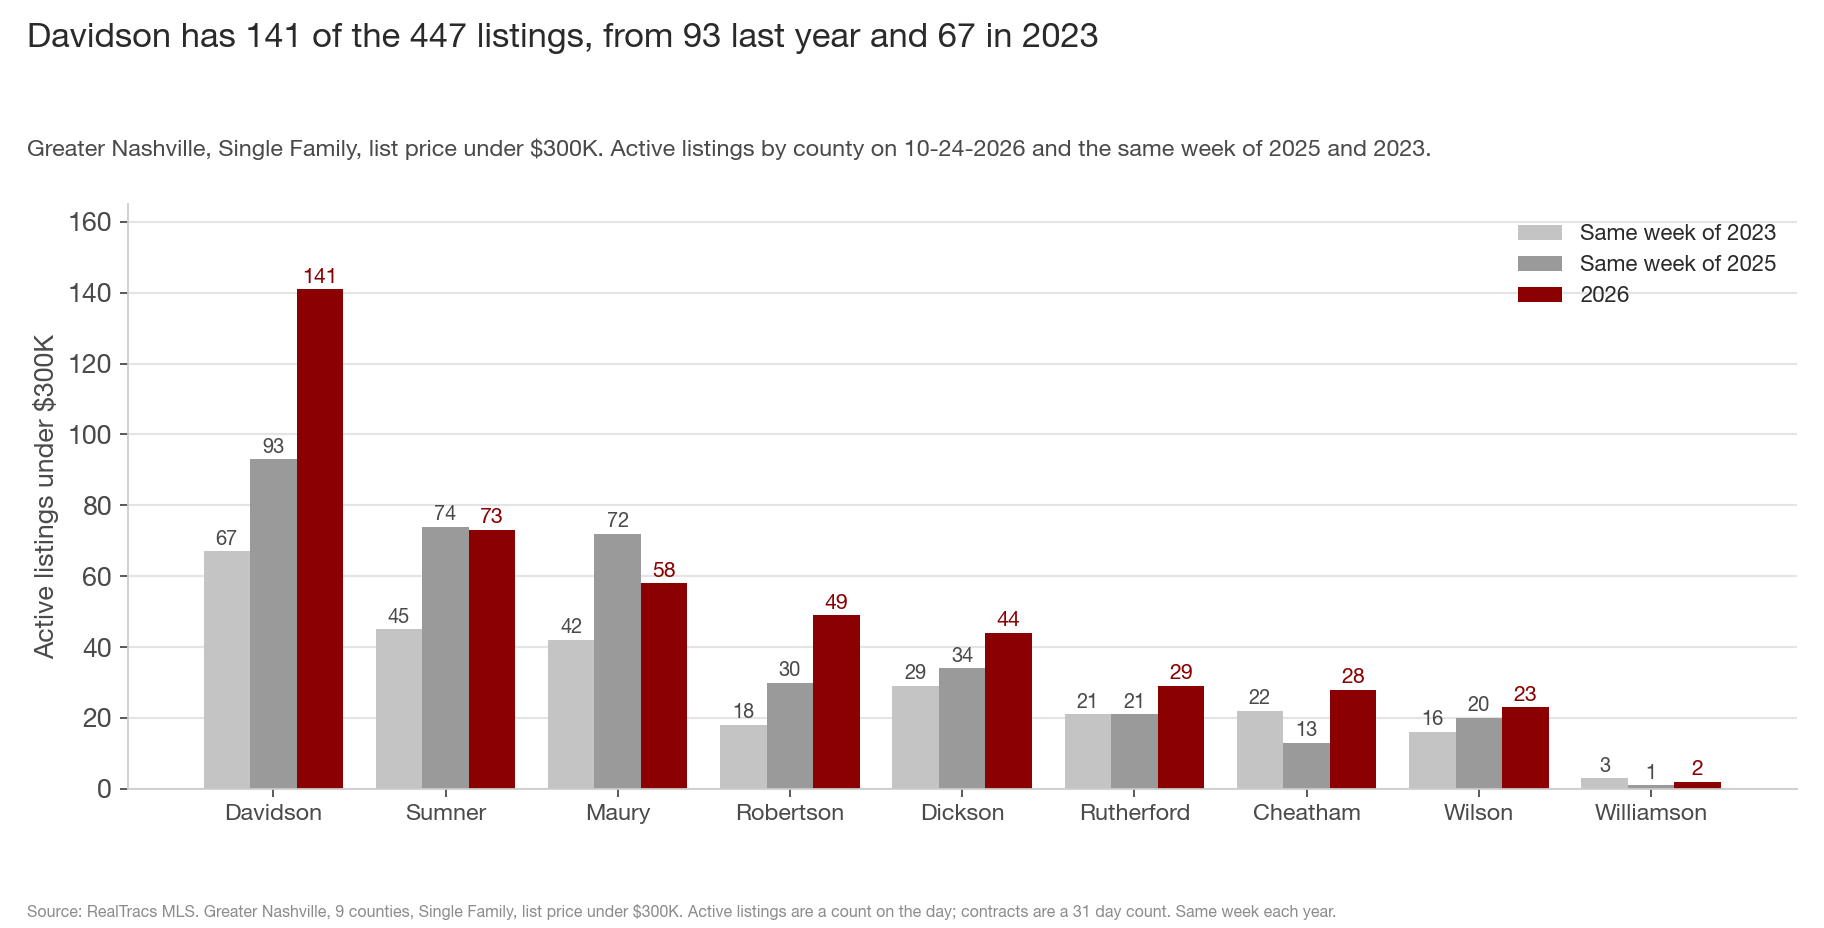
Davidson County has 141 of the 447, from 93 last year, 70 in 2024 and 67 in 2023. Davidson is 48 of the 89 listings the band added vs last year, 54%, and its count is more than double 2023's. The county was also at 141 on August 22; its high in 2023 through 2025 was 110, in July 2025. Davidson's contracts in the band are 38 against 44 last year, so the county has 3.7 listings per contract against 2.1.
Antioch (37013) has 21 of Davidson's 141, from 8 last year. 37207, north of downtown, has 19, from 11. Madison (37115) has 19, from 24. 37214 has 11 and Old Hickory (37138) has 10. 93 of the 141 are detached homes (66 last year), 39 are attached homes (26) and 9 are manufactured homes (1). The median list price in Davidson's band is $275K, the same as last year. The median listing has been on the market 49 days against 39 last year, and 51.8% have a price cut.
Robertson has 49 listings against 30 last year, Cheatham 28 against 13, Dickson 44 against 34 and Rutherford 29 against 21. Maury fell from 72 to 58 and Sumner is level at 73 against 74. Maury and Robertson have the most listings per contract of the counties with more than 2 listings, 6.4 and 6.1: Maury has 9 contracts against 26 last year and Robertson 8 against 20. Dickson is the one county with more contracts than last year, 16 against 11.
5. What type of homes are they?
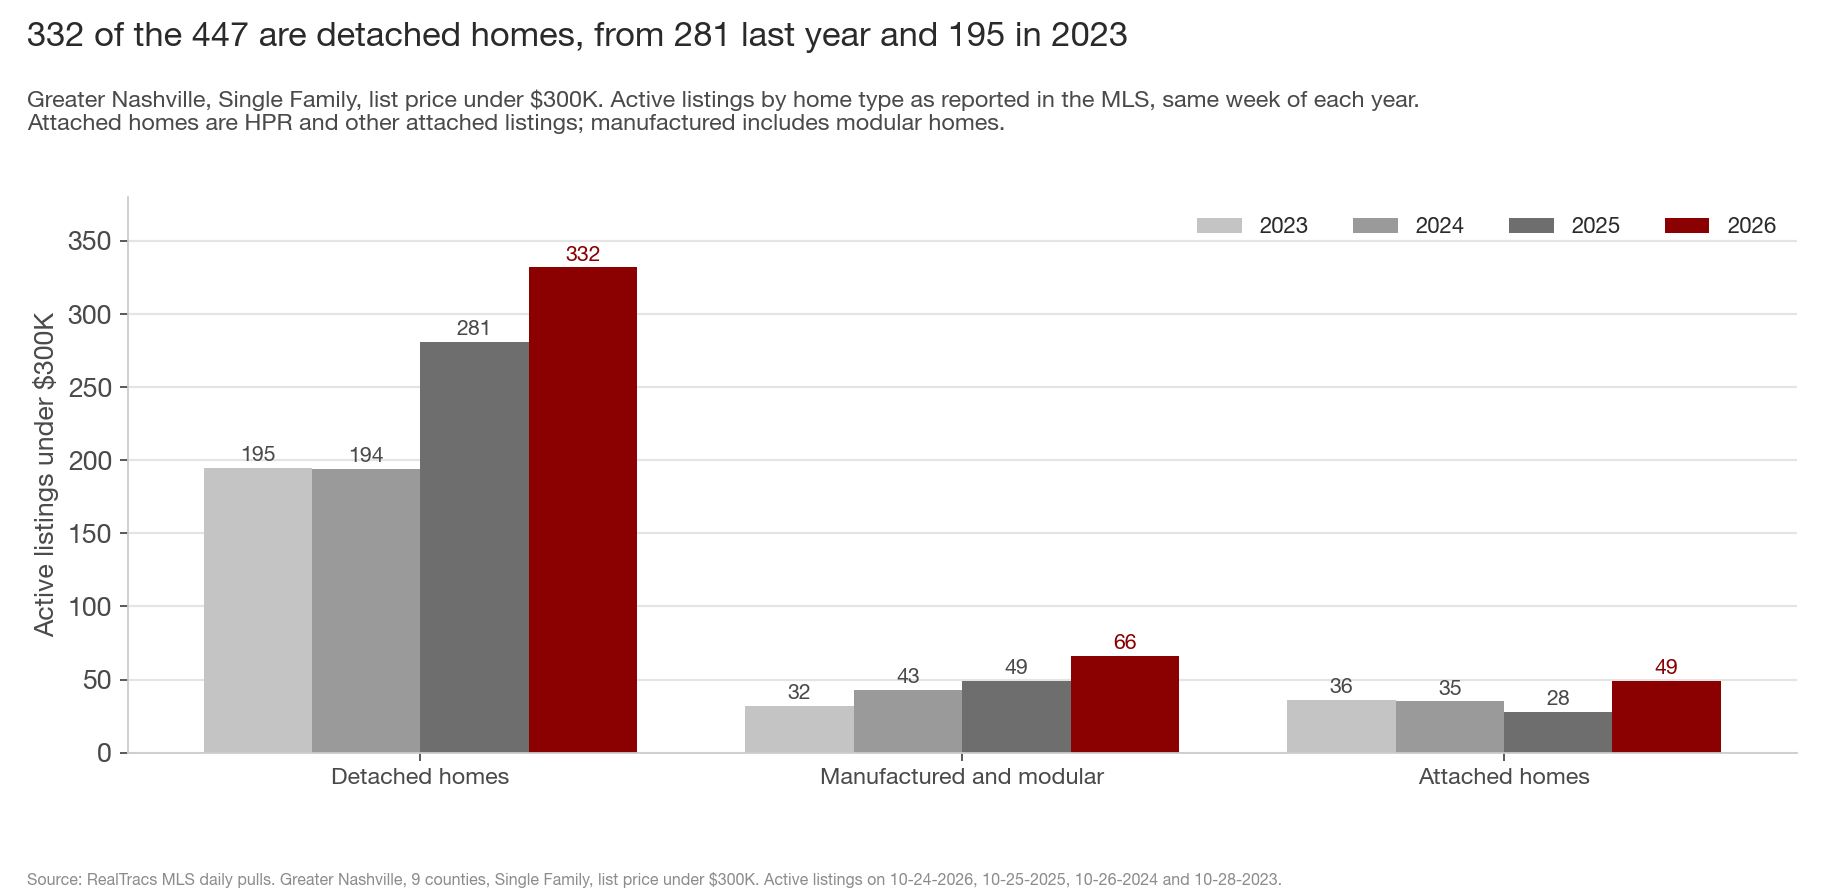
332 of the 447 are detached homes, against 281 last year, 194 in 2024 and 195 in 2023. 66 are manufactured or modular homes (49 last year) and 49 are attached homes, HPR and other attached listings (28 last year). Detached homes are 74% of the band and 51 of the 89 added listings.
The median listing in the band is priced at $269,900 ($265,000 last year), was built in 1978 (1970 last year), is 1,176 sqft, and has been on the market 44 days, the same as last year and up from 32 days in 2024 and 29 in 2023. 282 of the 447, 63%, are priced between $250K and $300K. 49.9% have a price cut, against 53.1% last year; the number with a cut is 223 against 190.
6. Have the band's closings fallen?
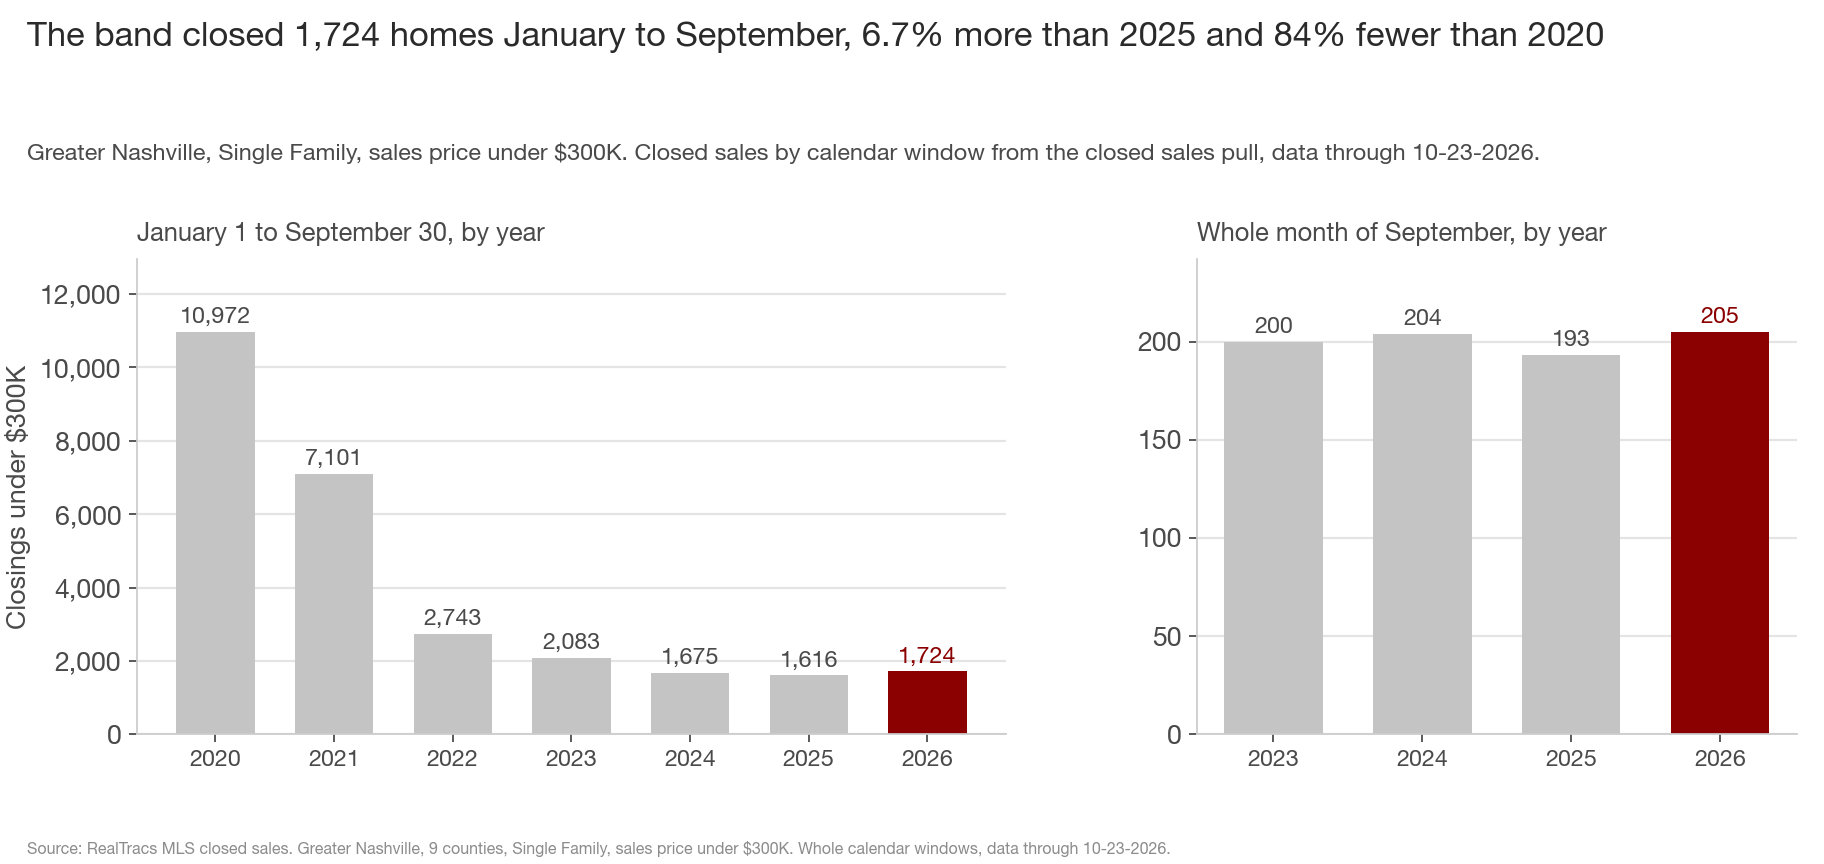
Not yet. The band closed 205 homes in September against 193 in September 2025, 204 in 2024 and 200 in 2023, and 144 from October 1 to 23 against 147 over the same days of 2025. January through September the band closed 1,724 homes, 6.7% more than 2025's 1,616 and the first January to September increase in the 7 years of closed sales data. The band closed 10,972 homes in the same months of 2020, so this year's count is 84% below that, and the band fell every year from 2021 to 2025. Davidson's January to September closings in the band are 481 against 429 (+12.1%).
The homes closing now went under contract in August and September, when the band's contracts were at or above last year. The October contracts close in November and December.
7. Which neighborhoods on the NRD map have the most of these listings?
The NRD neighborhood map has 2,401 areas across the 9 counties. I put each of the 447 listings in its area by its location. The listings fall in 215 of the areas, and no area has more than 11. The 2 maps below show each area by its count, from light for 1 or 2 to dark red for 7 or more, with a line and label to each of the areas with the most listings. Some areas on the map have no name and carry a number instead; I name those by the city they are in.
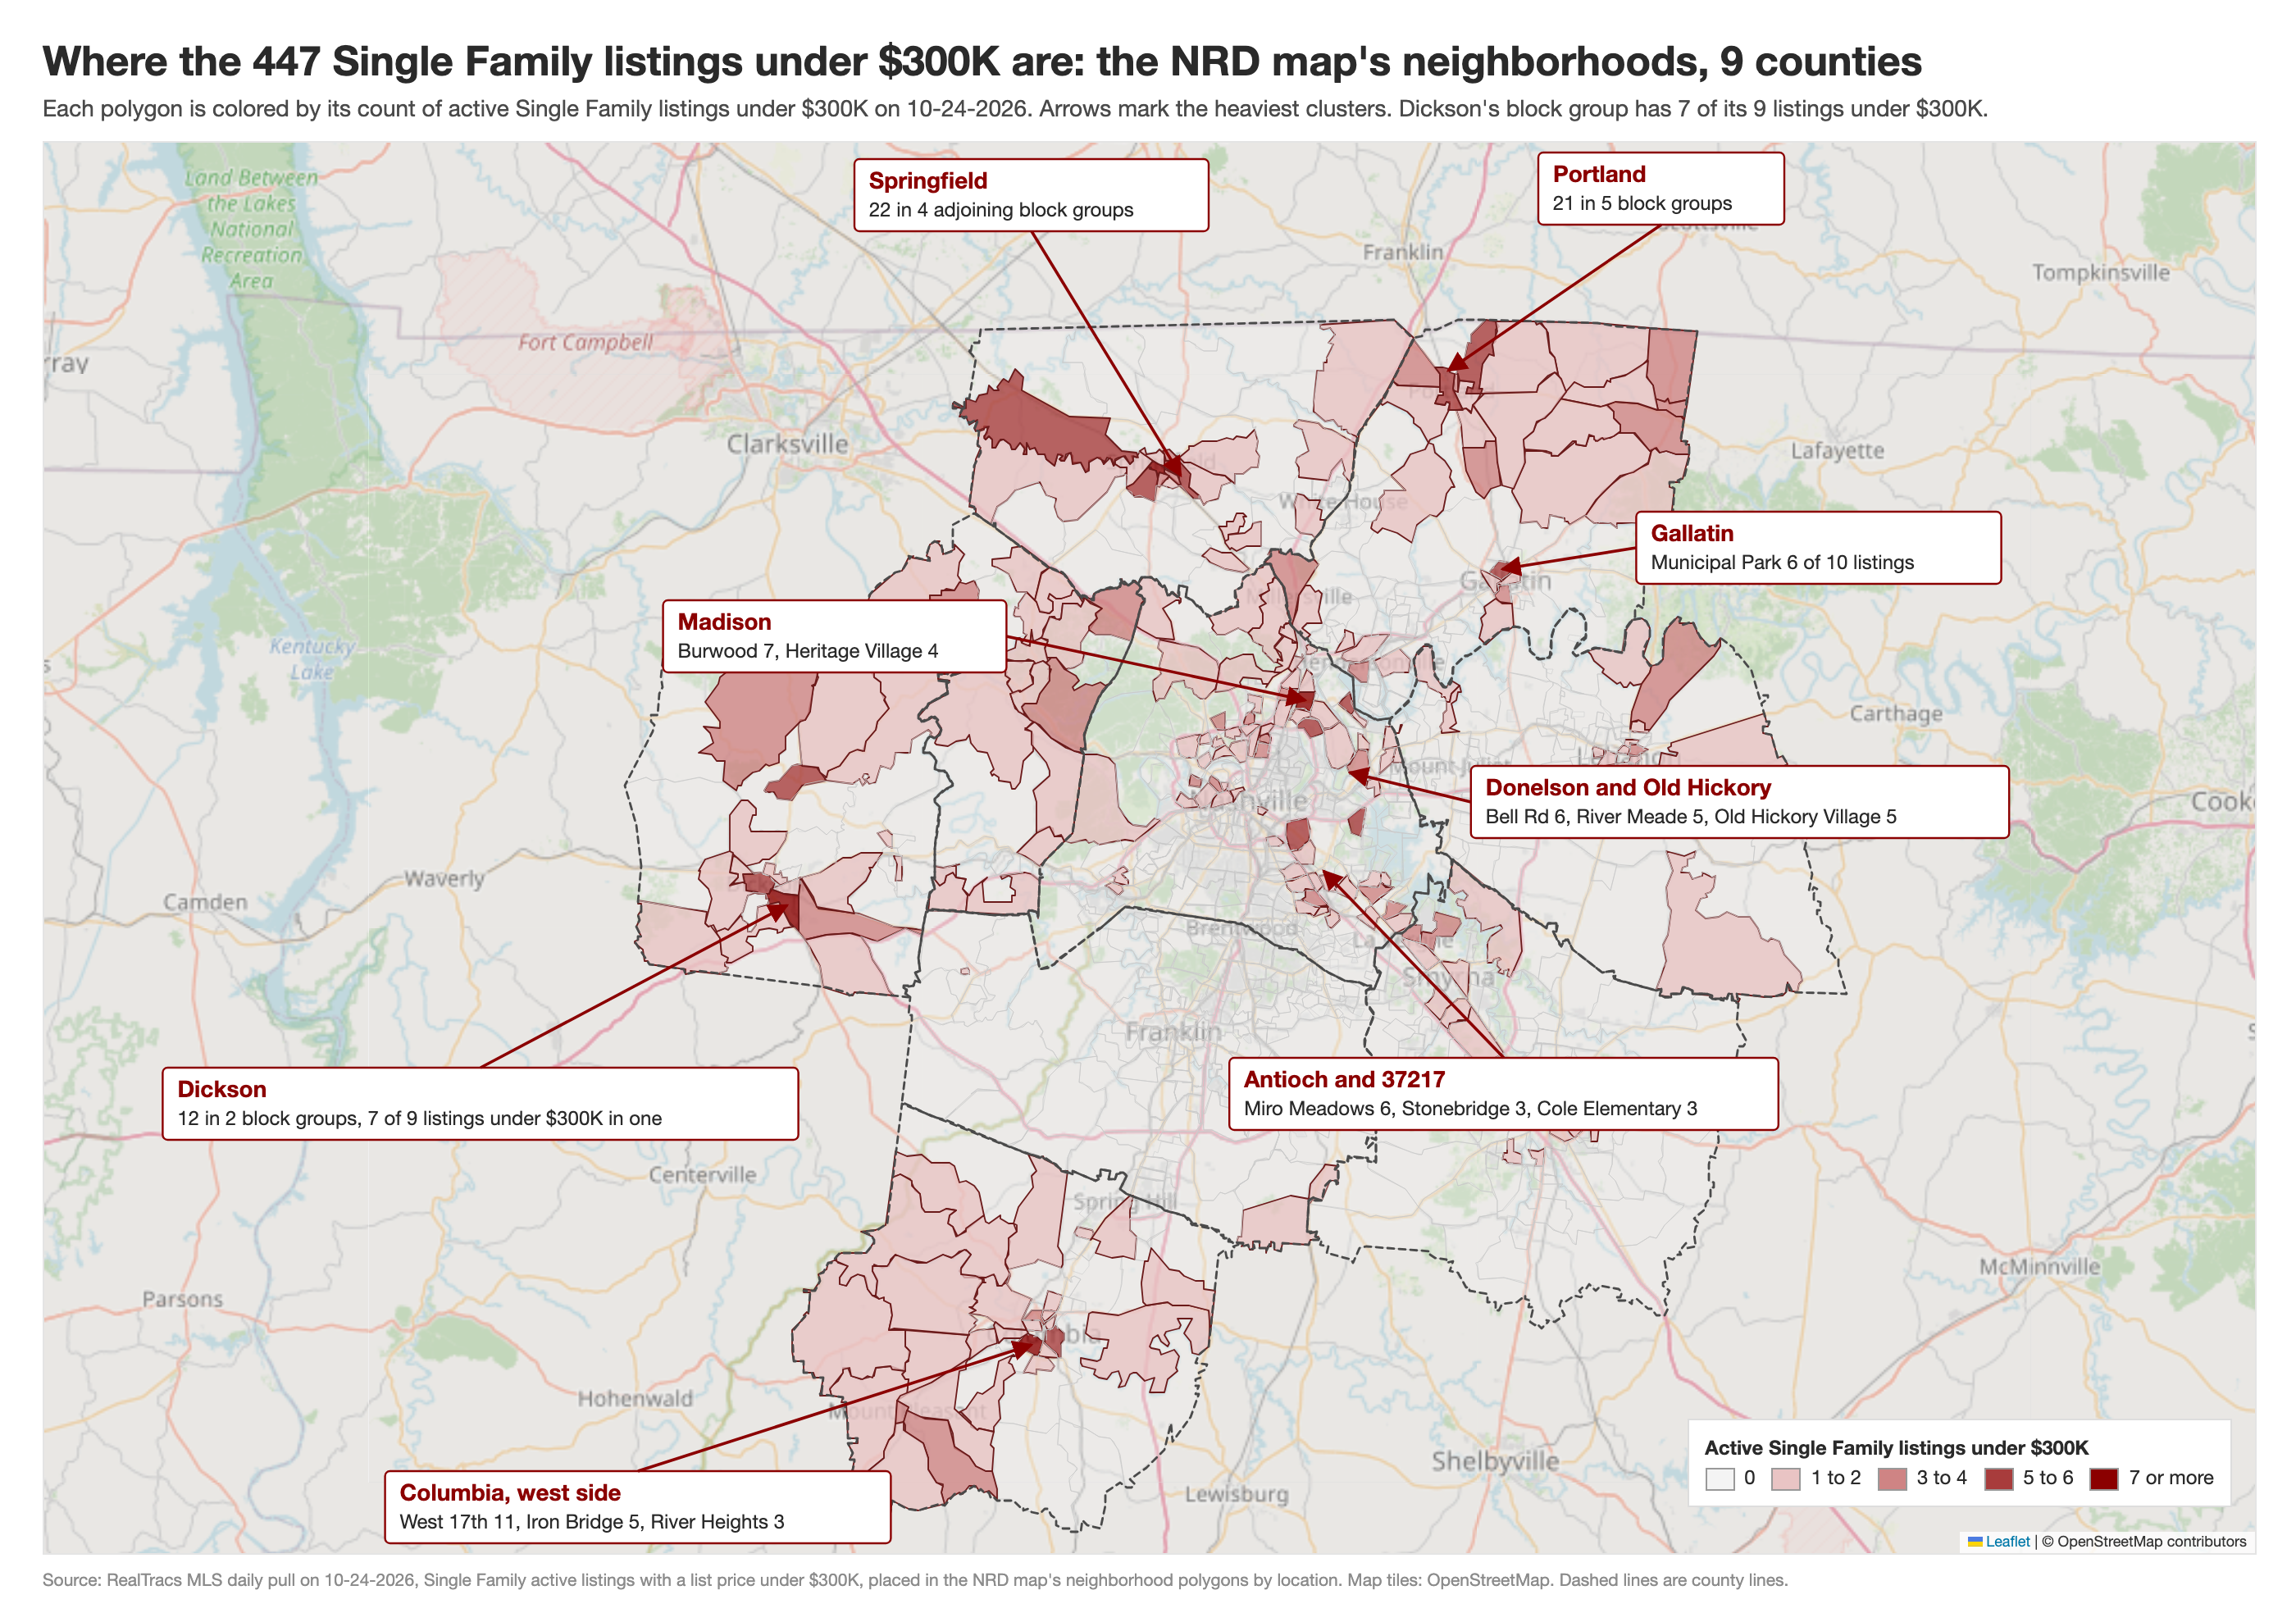
Outside Davidson, the areas with the most listings are the west side of Columbia (West 17th 11, Iron Bridge 5, River Heights 3), 4 areas next to each other on the west side of Springfield (22 between them), 5 areas in Portland (21), 2 areas in Dickson (12, and in one of them 7 of the 9 active Single Family listings are under $300K), and Municipal Park in Gallatin, where 6 of the 10 active Single Family listings are under $300K.
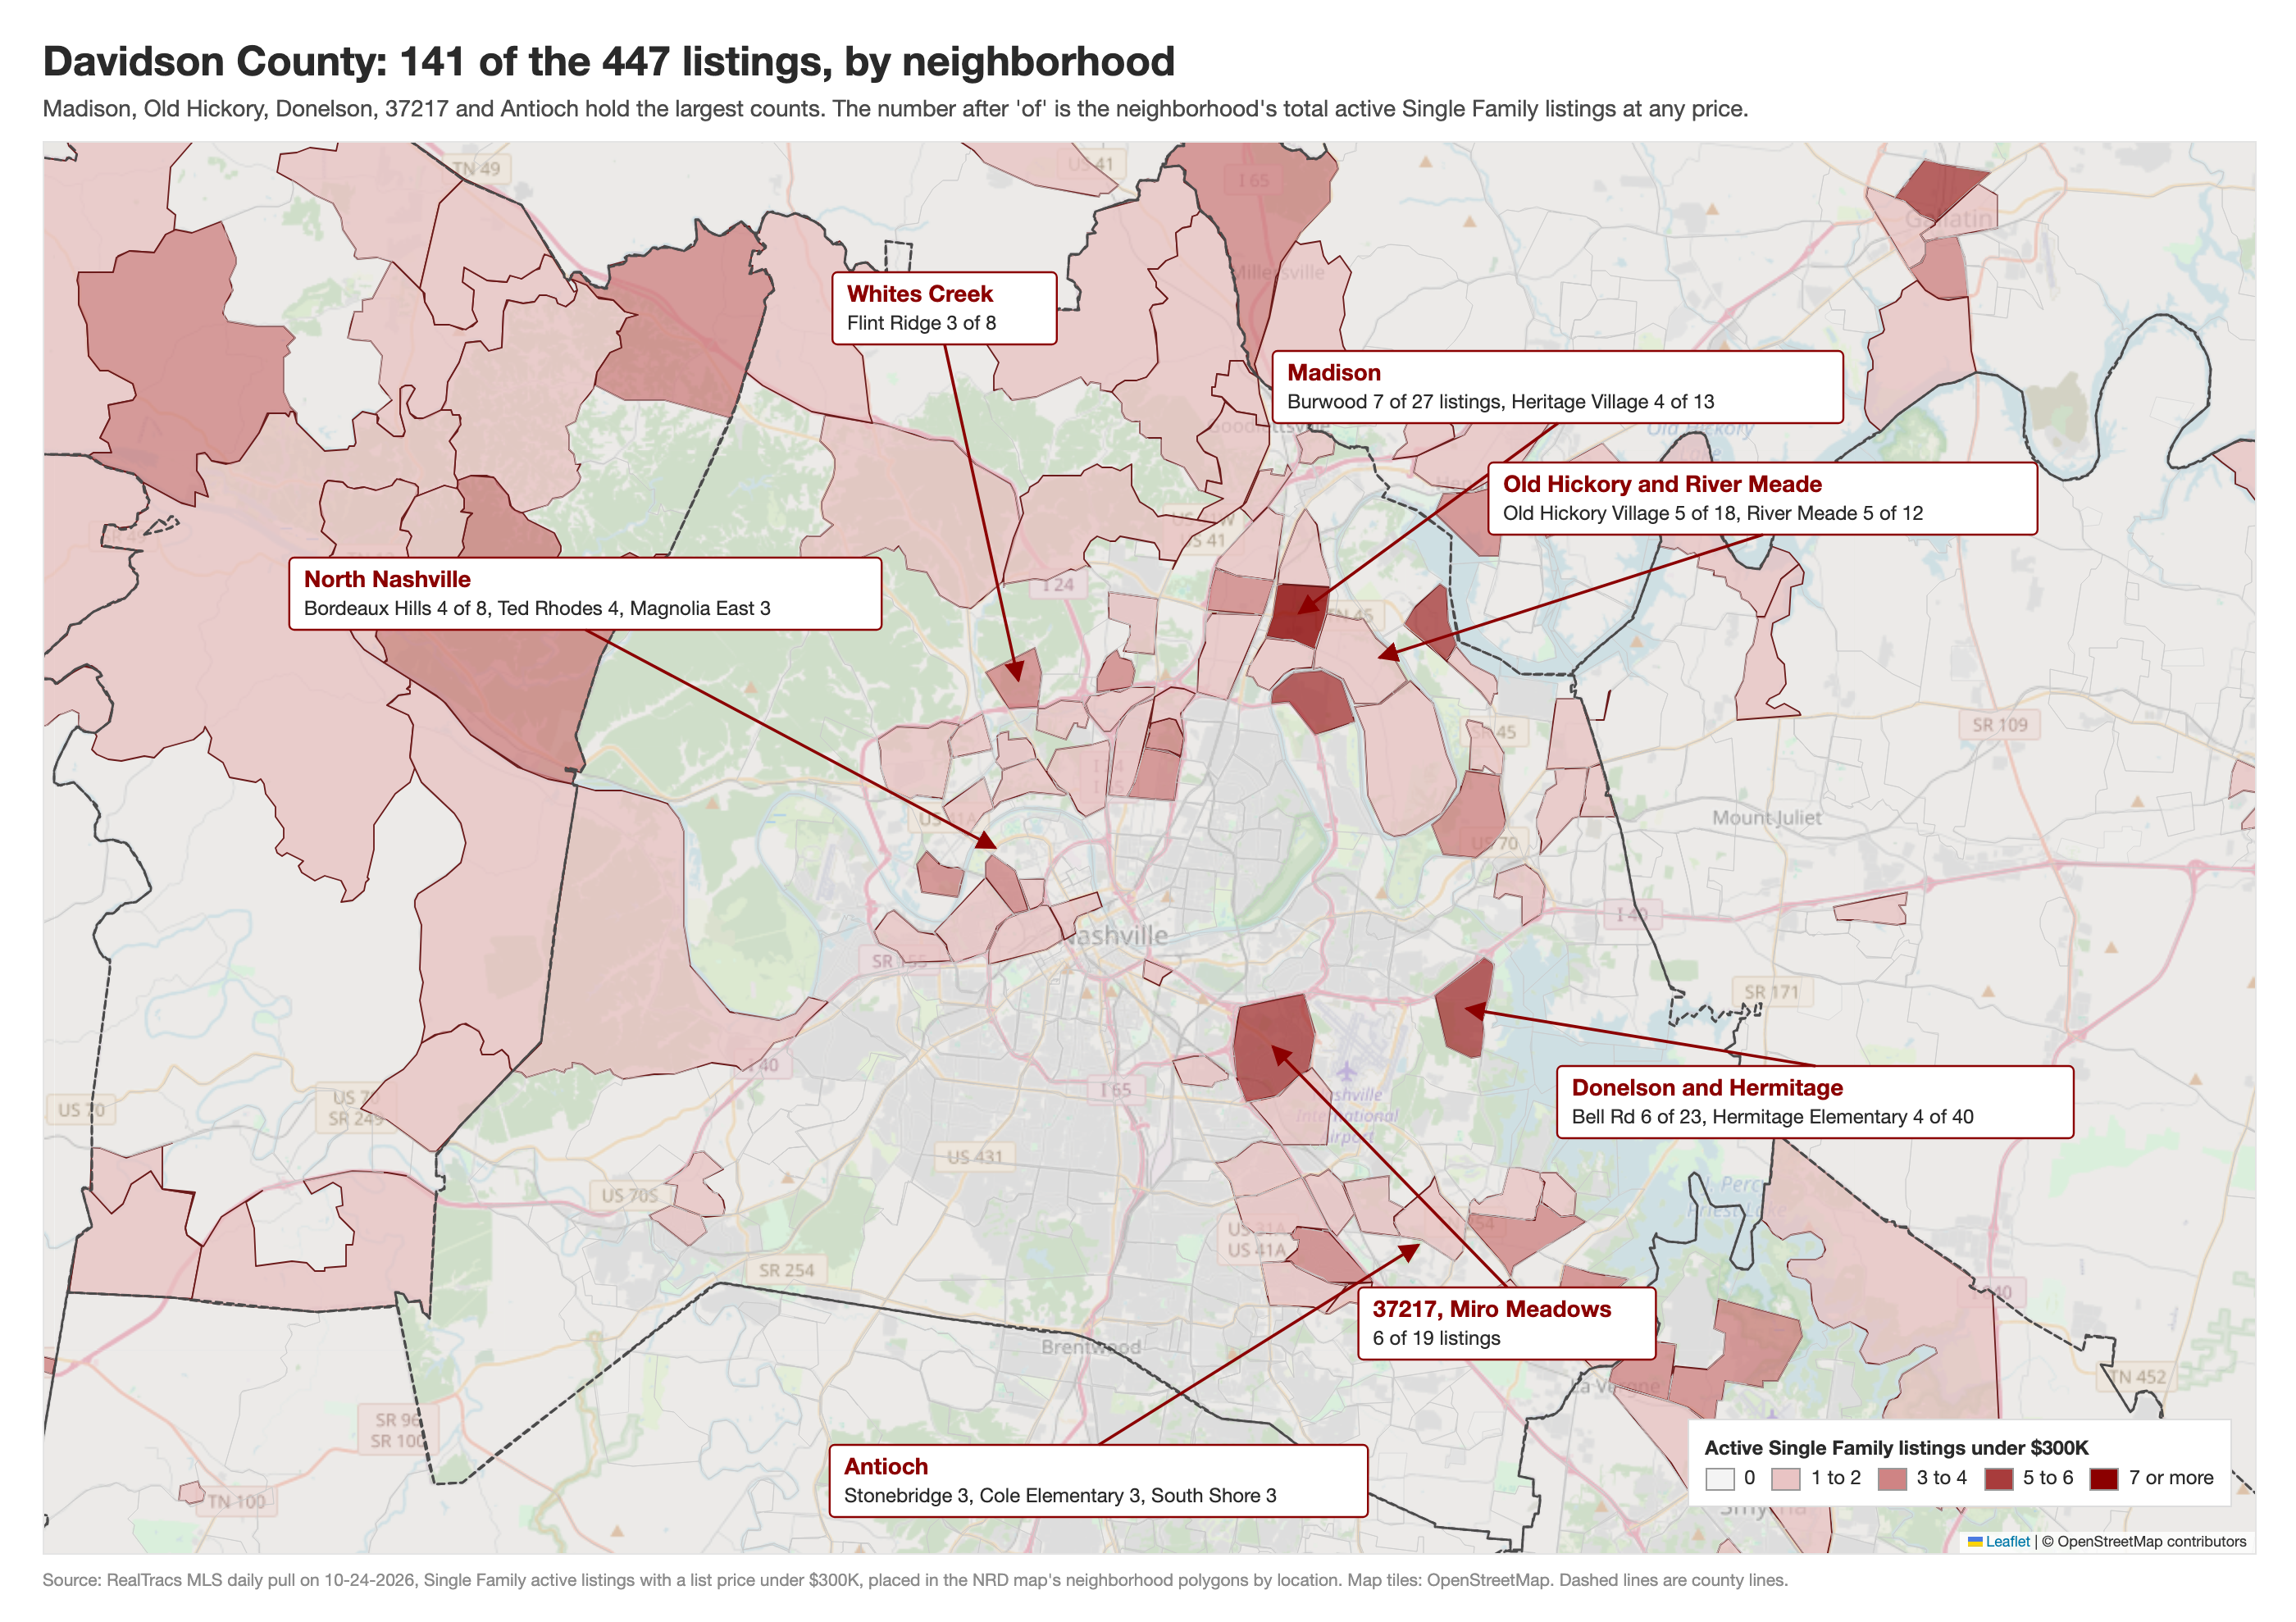
In Davidson the listings are in Madison (Burwood 7 of its 27 active Single Family listings, Heritage Village 4 of 13), Old Hickory (Old Hickory Village 5 of 18, River Meade 5 of 12), Donelson (Bell Rd 6 of 23), 37217 (Miro Meadows 6 of 19), Antioch (Stonebridge, Cole Elementary and South Shore, 3 each) and North Nashville (Bordeaux Hills 4 of 8, Ted Rhodes 4 of 23, Magnolia East 3 of 6).
Below is the map's own chart for each of the 8 areas with the most of these listings: the area's active listings, contract volume and price cuts by week since 2023 at the top, then every listing since 2020 by price per square foot, with the area on a small map. The map gives each chart the name of its most common subdivision, so the chart for Burwood is Madison Park; I give both. The chart numbers count every listing in the area at any price, condos included. The under $300K numbers below are Single Family only, from the same listings as part 8. Under each one is a link to the full chart.
Open the West 17th, Columbia chart
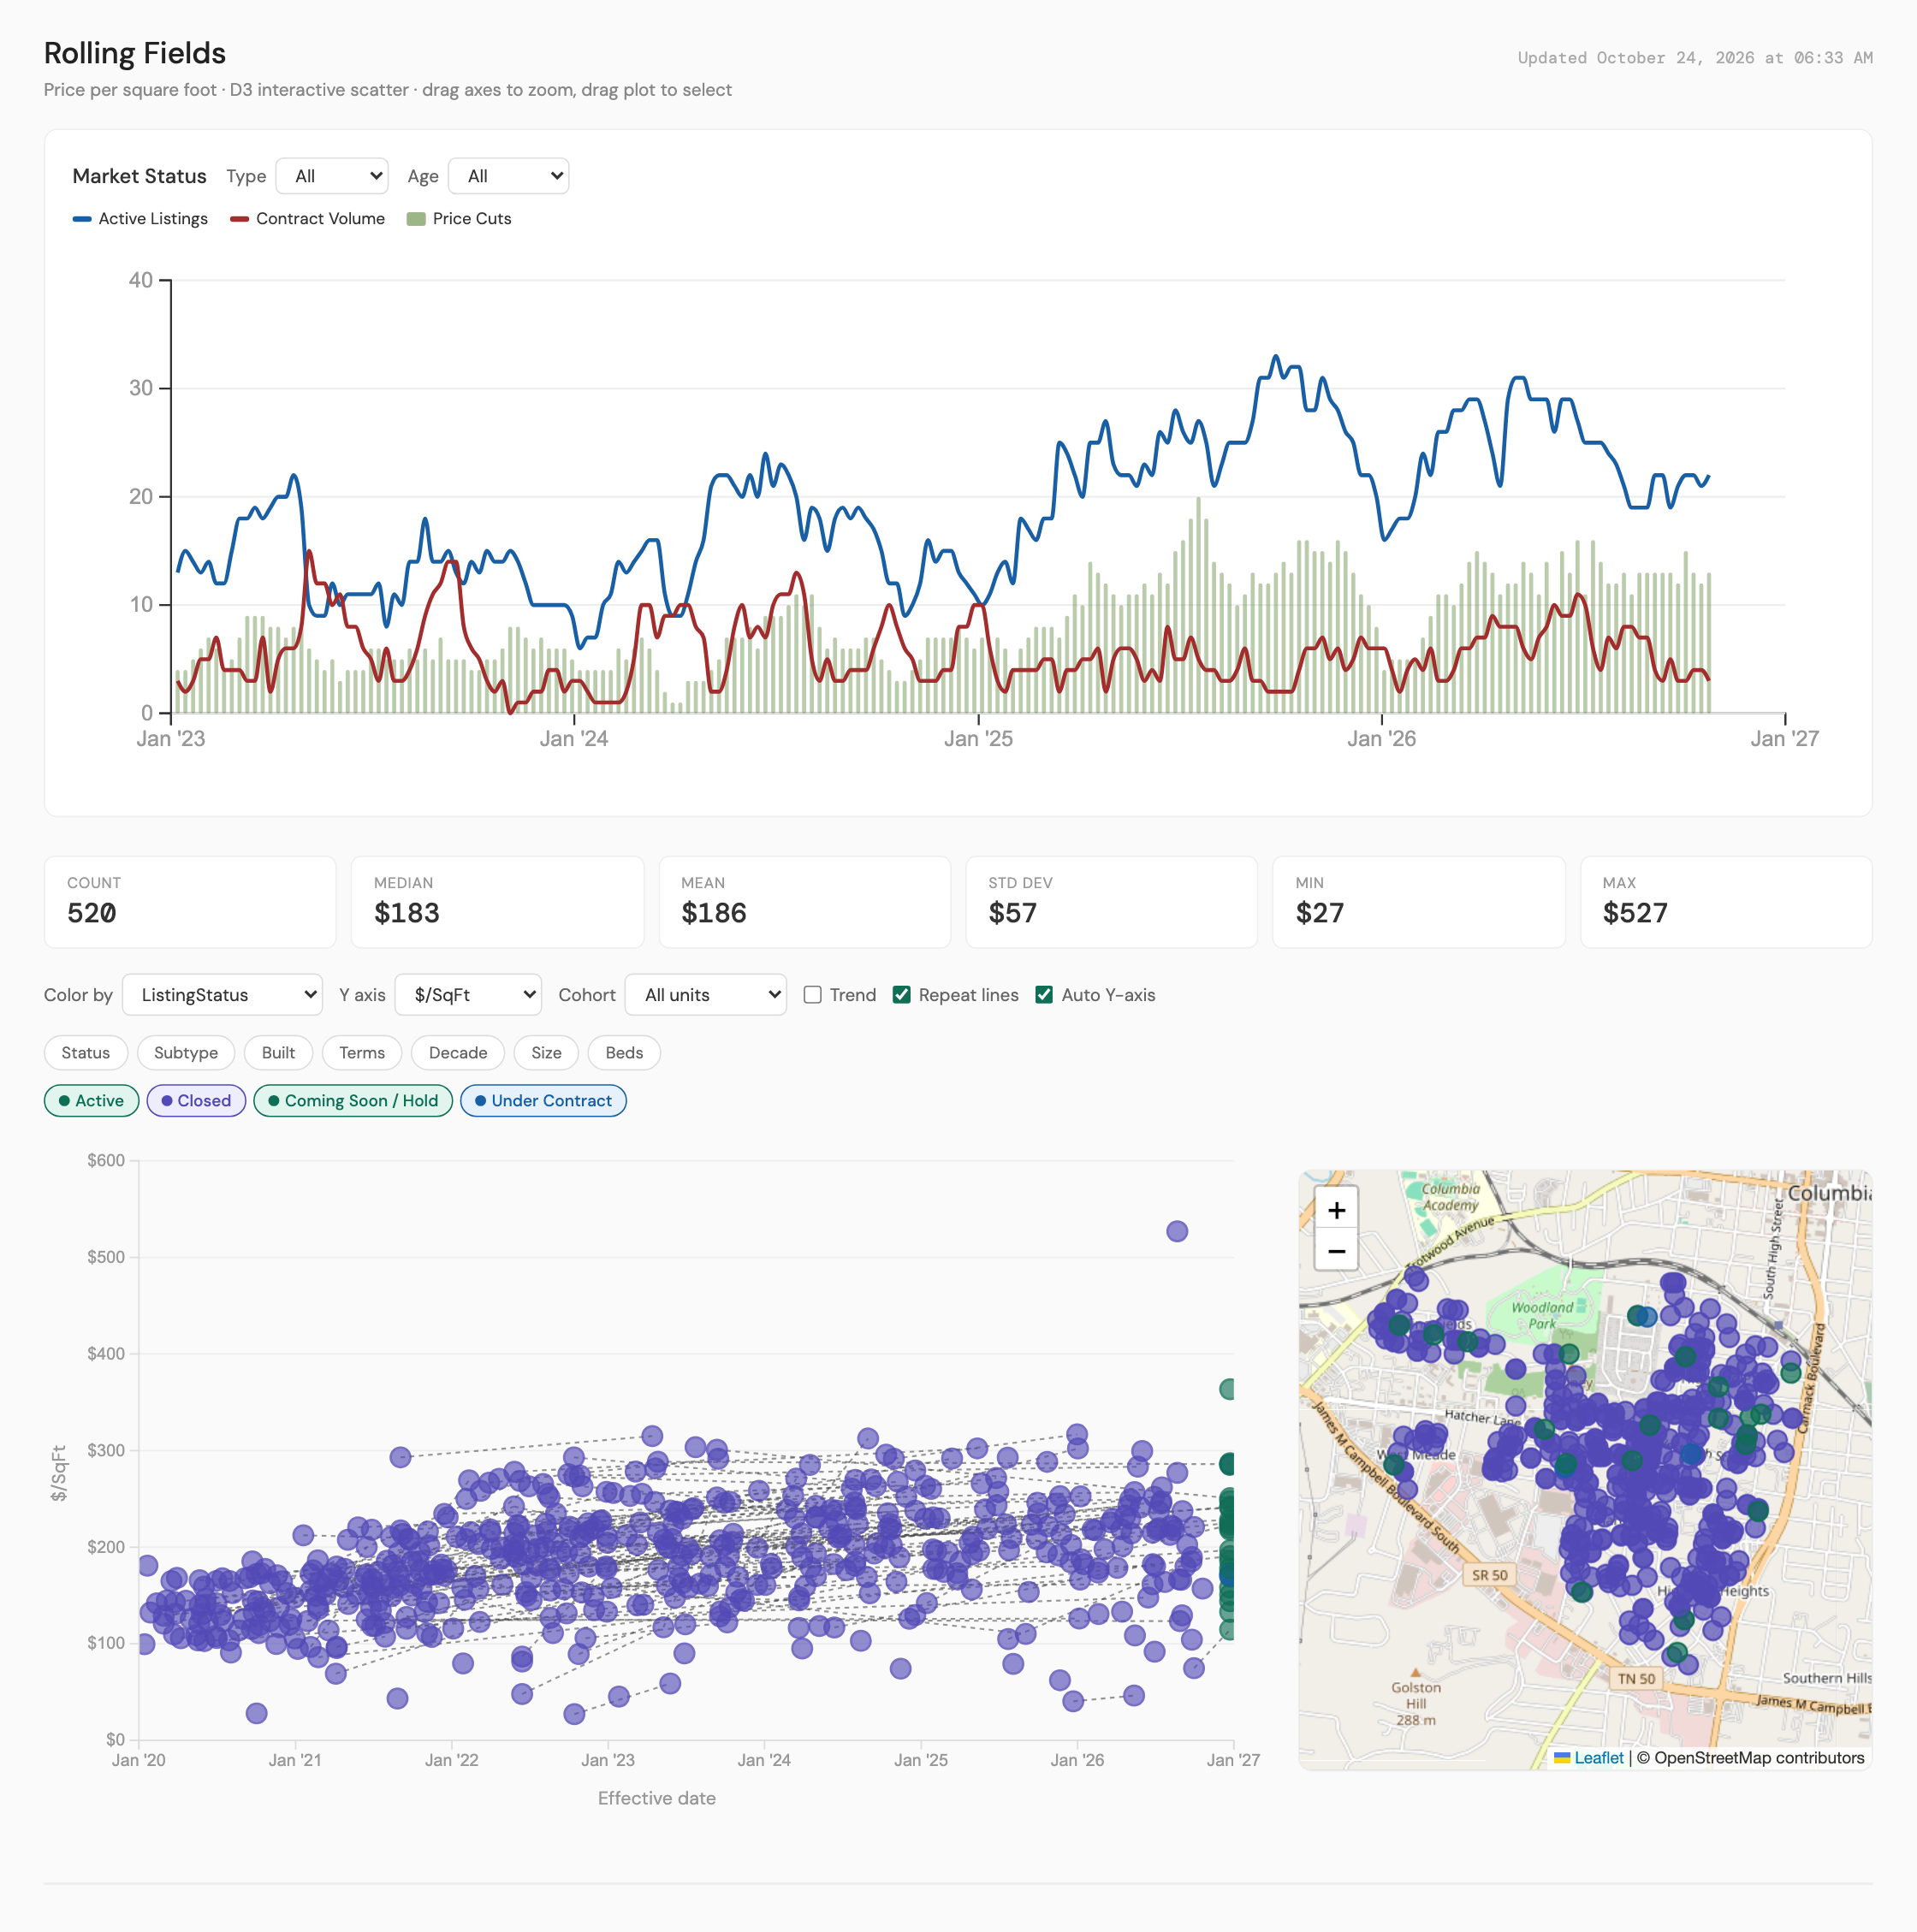
West 17th, Columbia (map chart: Rolling Fields). 11 of the area's 22 active Single Family listings are under $300K. Since 2023, 197 of the 277 listings under $300K that ended there sold (71.1%), and in 2026 it is 52 closed against 14 that left the market. The 11 active listings ask a median $245K, have been on the market a median 53 days, and the median one was built in 1945. The map chart, at any price, shows 72 closings in the last 12 months at a median $213 per square foot, 1.70 percent vs the prior 12 months, and 22 active listings against 3 contracts. 11 is the most of any area on the map.
Open the Springfield area chart
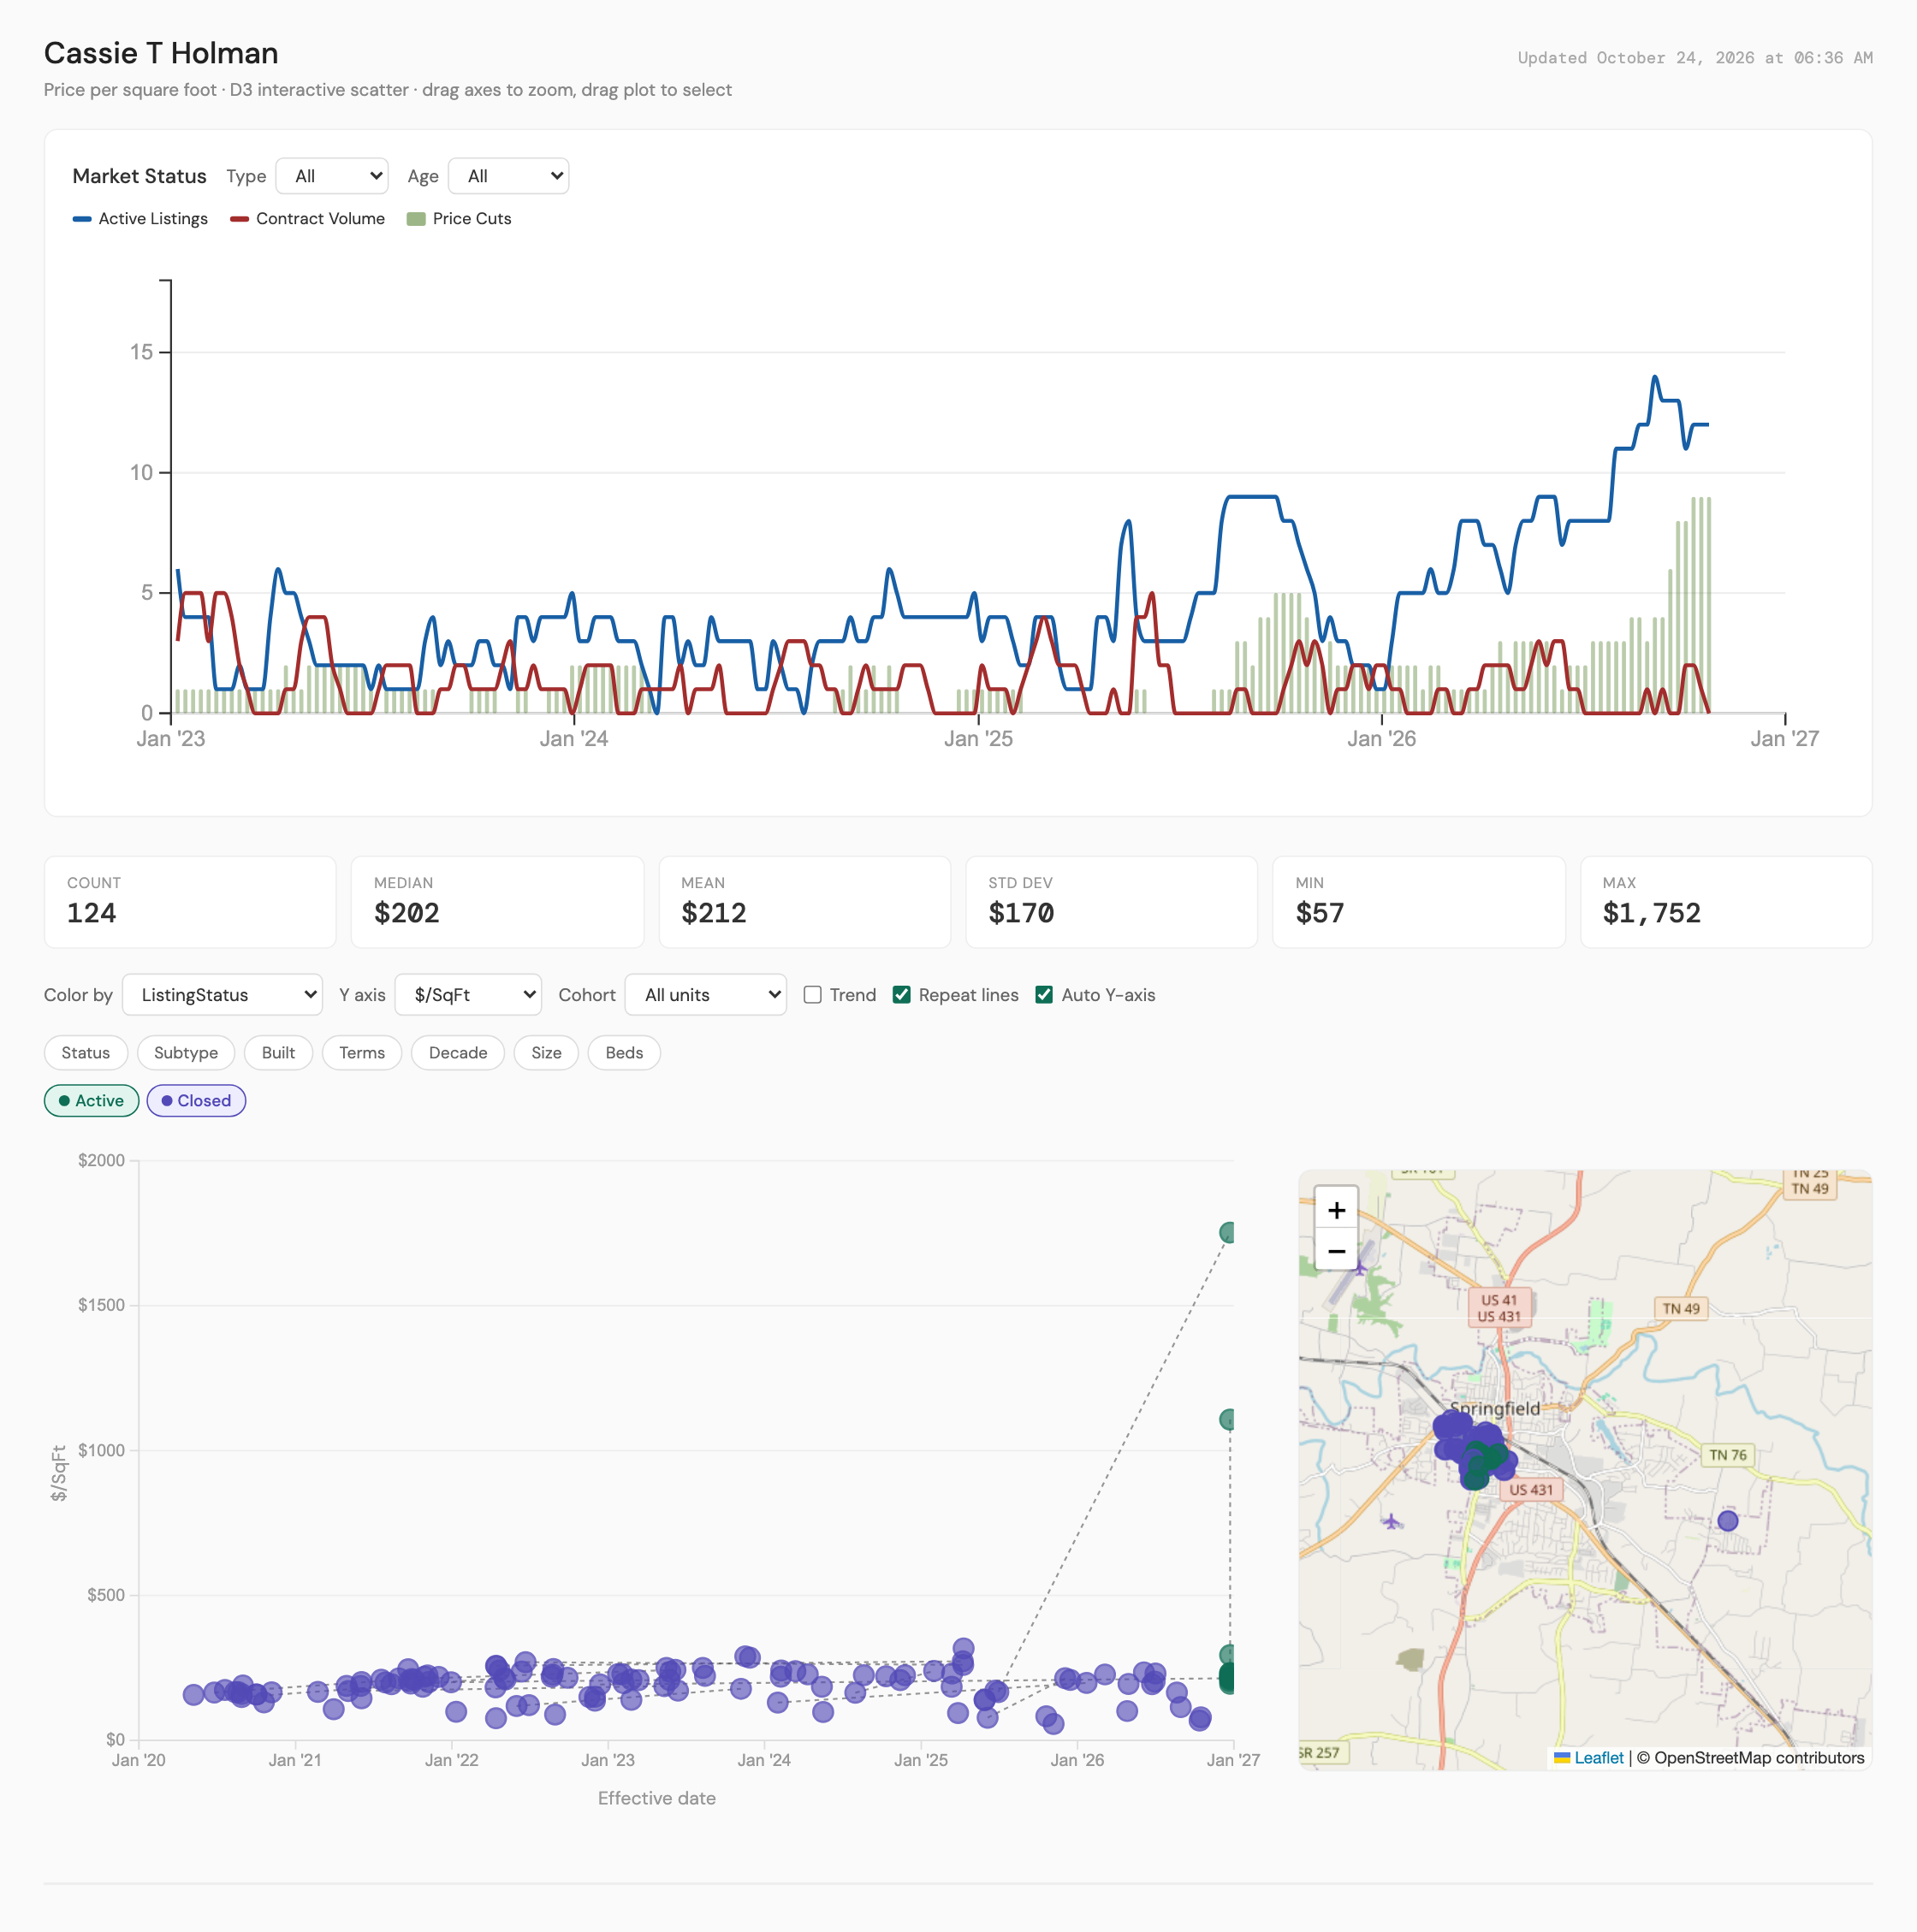
Springfield, the area west of downtown Springfield (map chart: the Holman subdivision). 7 of the area's 12 active Single Family listings are under $300K. Since 2023, 54 of the 81 listings under $300K that ended there sold (66.7%), and in 2026 it is 11 closed against 5 that left the market. The 7 active listings ask a median $260K, have been on the market a median 60 days, and the median one was built in 2022. The map chart, at any price, shows 15 closings in the last 12 months at a median $195 per square foot, 5.47 percent vs the prior 12 months, and 12 active listings against 0 contracts. The median active listing was built in 2022, so most of these are new homes.
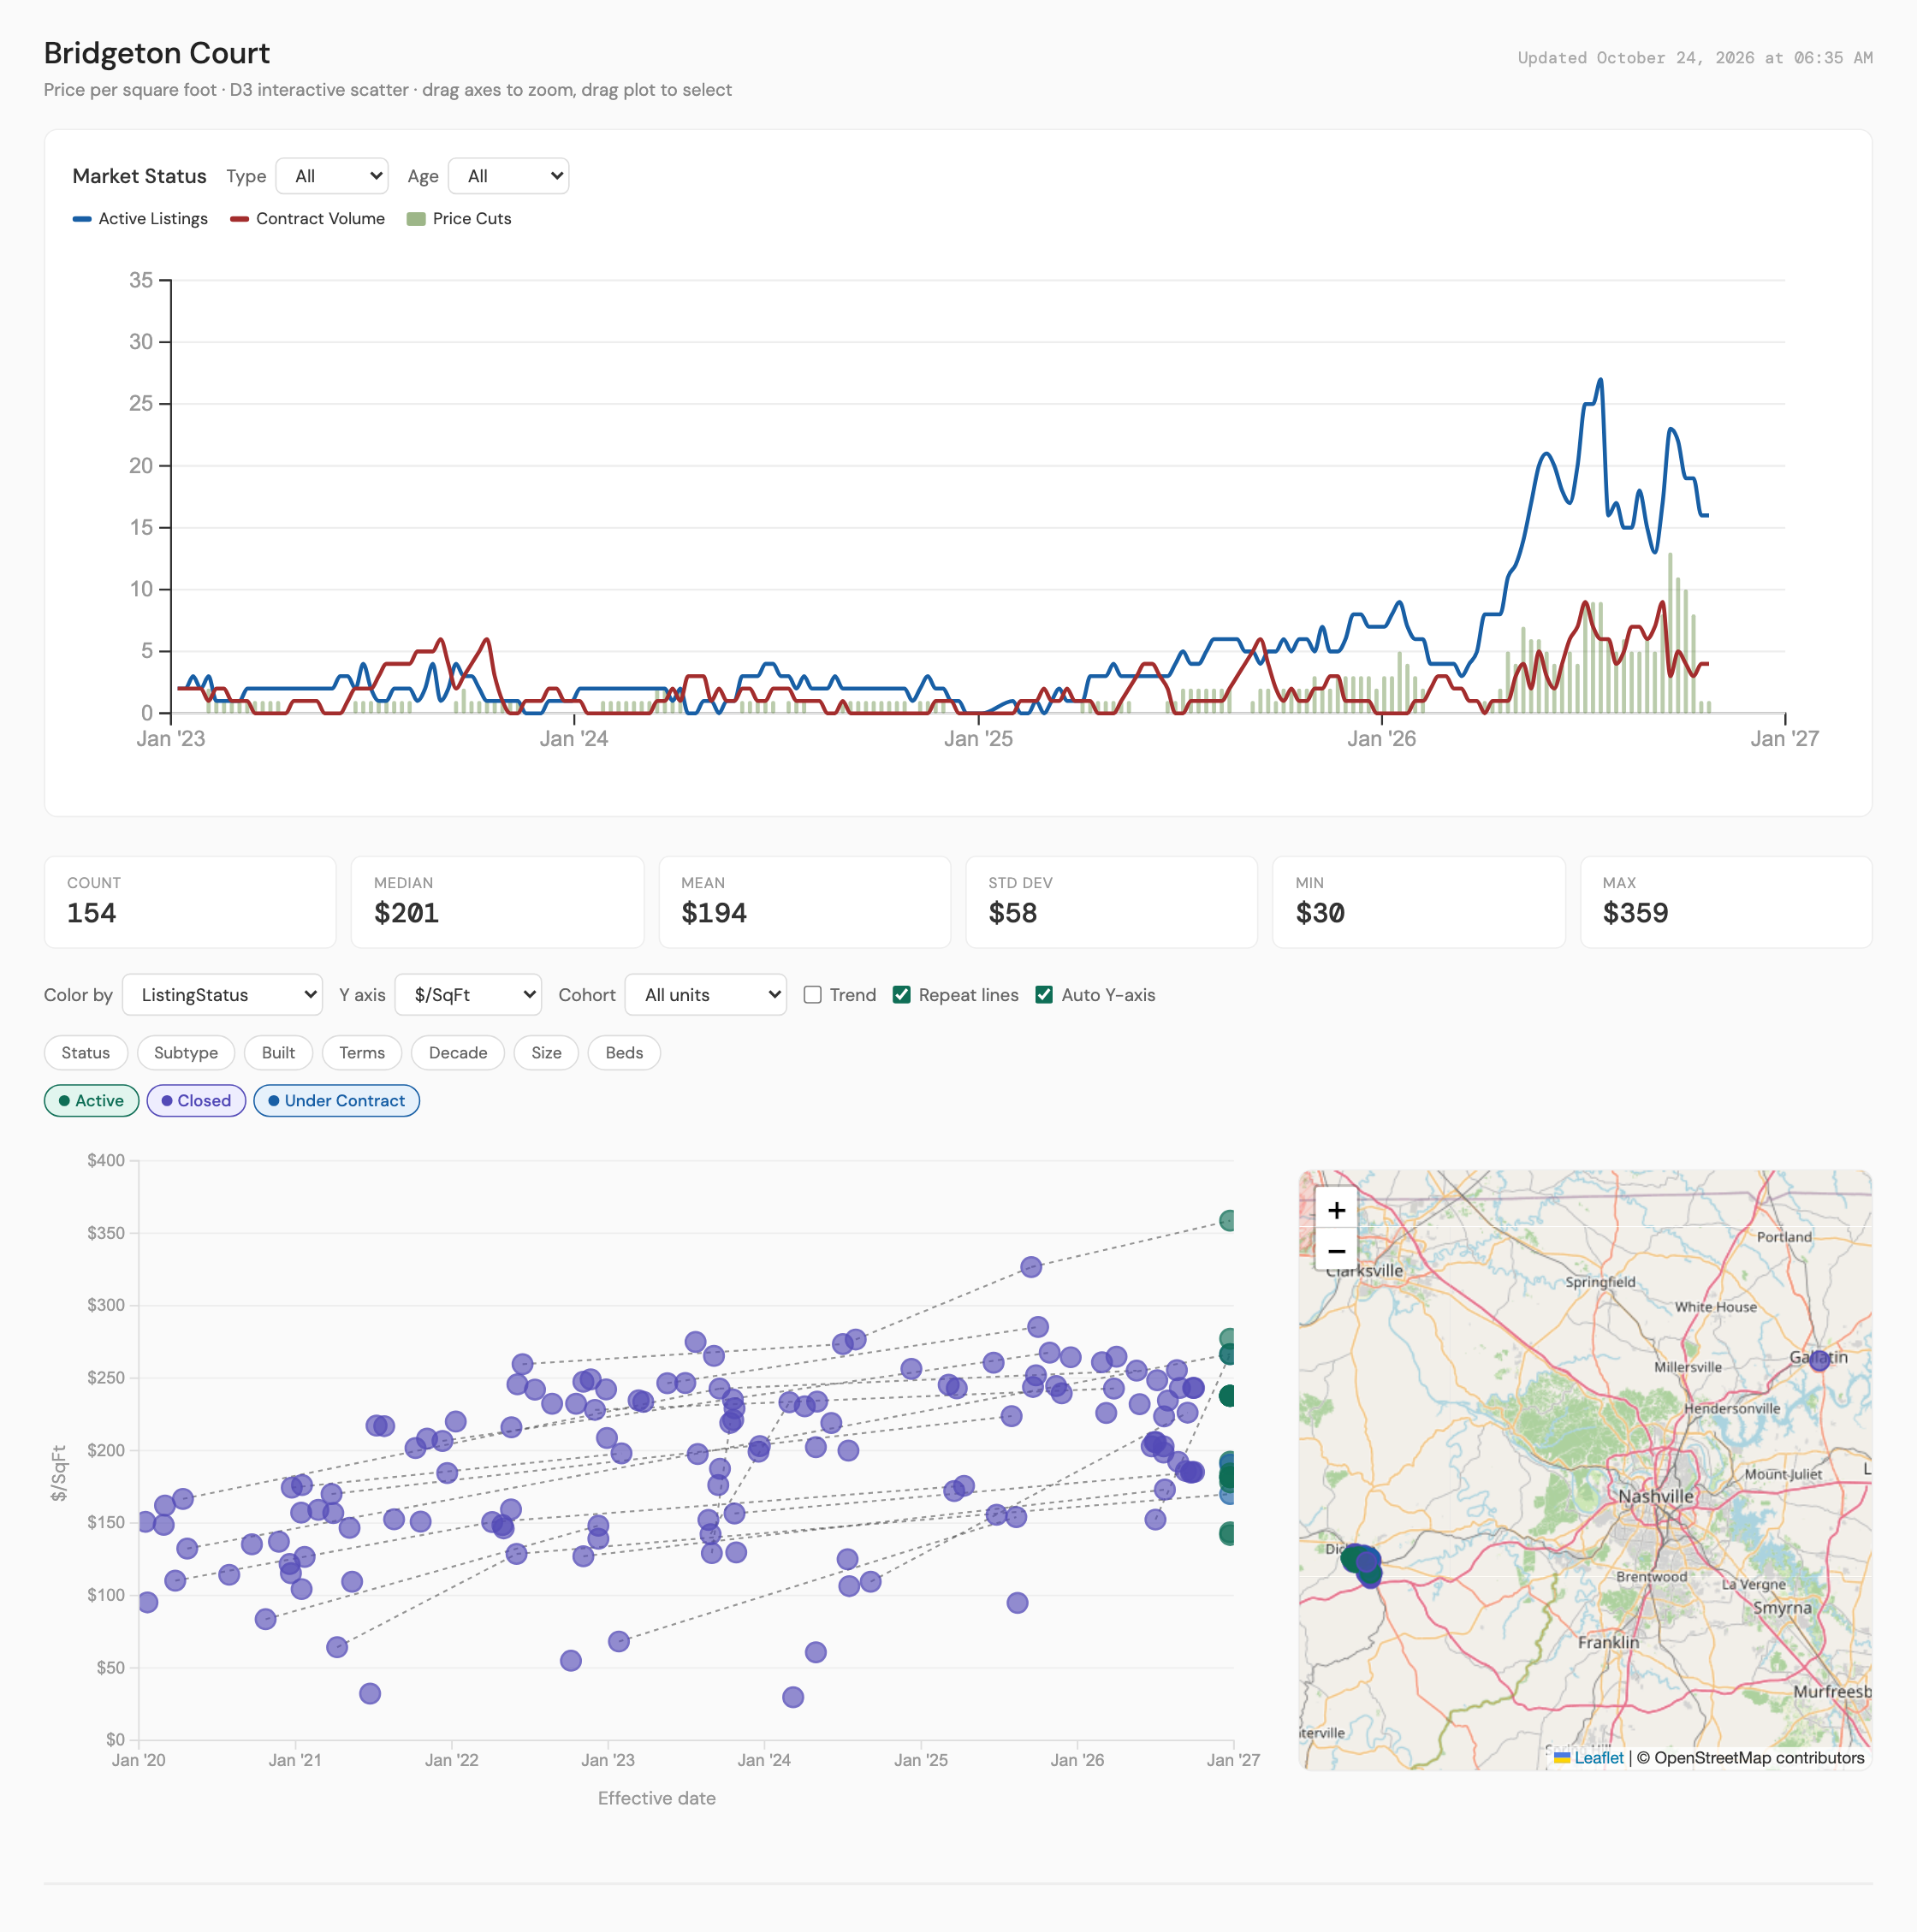
Dickson, the area south of downtown Dickson (map chart: Bridgeton Court). 7 of the area's 9 active Single Family listings are under $300K. Since 2023, 53 of the 85 listings under $300K that ended there sold (62.4%), and in 2026 it is 13 closed against 25 that left the market. The 7 active listings ask a median $220K, have been on the market a median 37 days, and the median one was built in 2026. The map chart, at any price, shows 30 closings in the last 12 months at a median $229 per square foot, -5.88 percent vs the prior 12 months, and 16 active listings against 4 contracts. The area is a new subdivision, The Cottages at Hill Place: active listings went from under 5 before 2026 to 27 in the summer, 16 of the 25 listings that left the market this year were new construction, and 16 of the 42 homes listed there since 2025 were listed more than once.
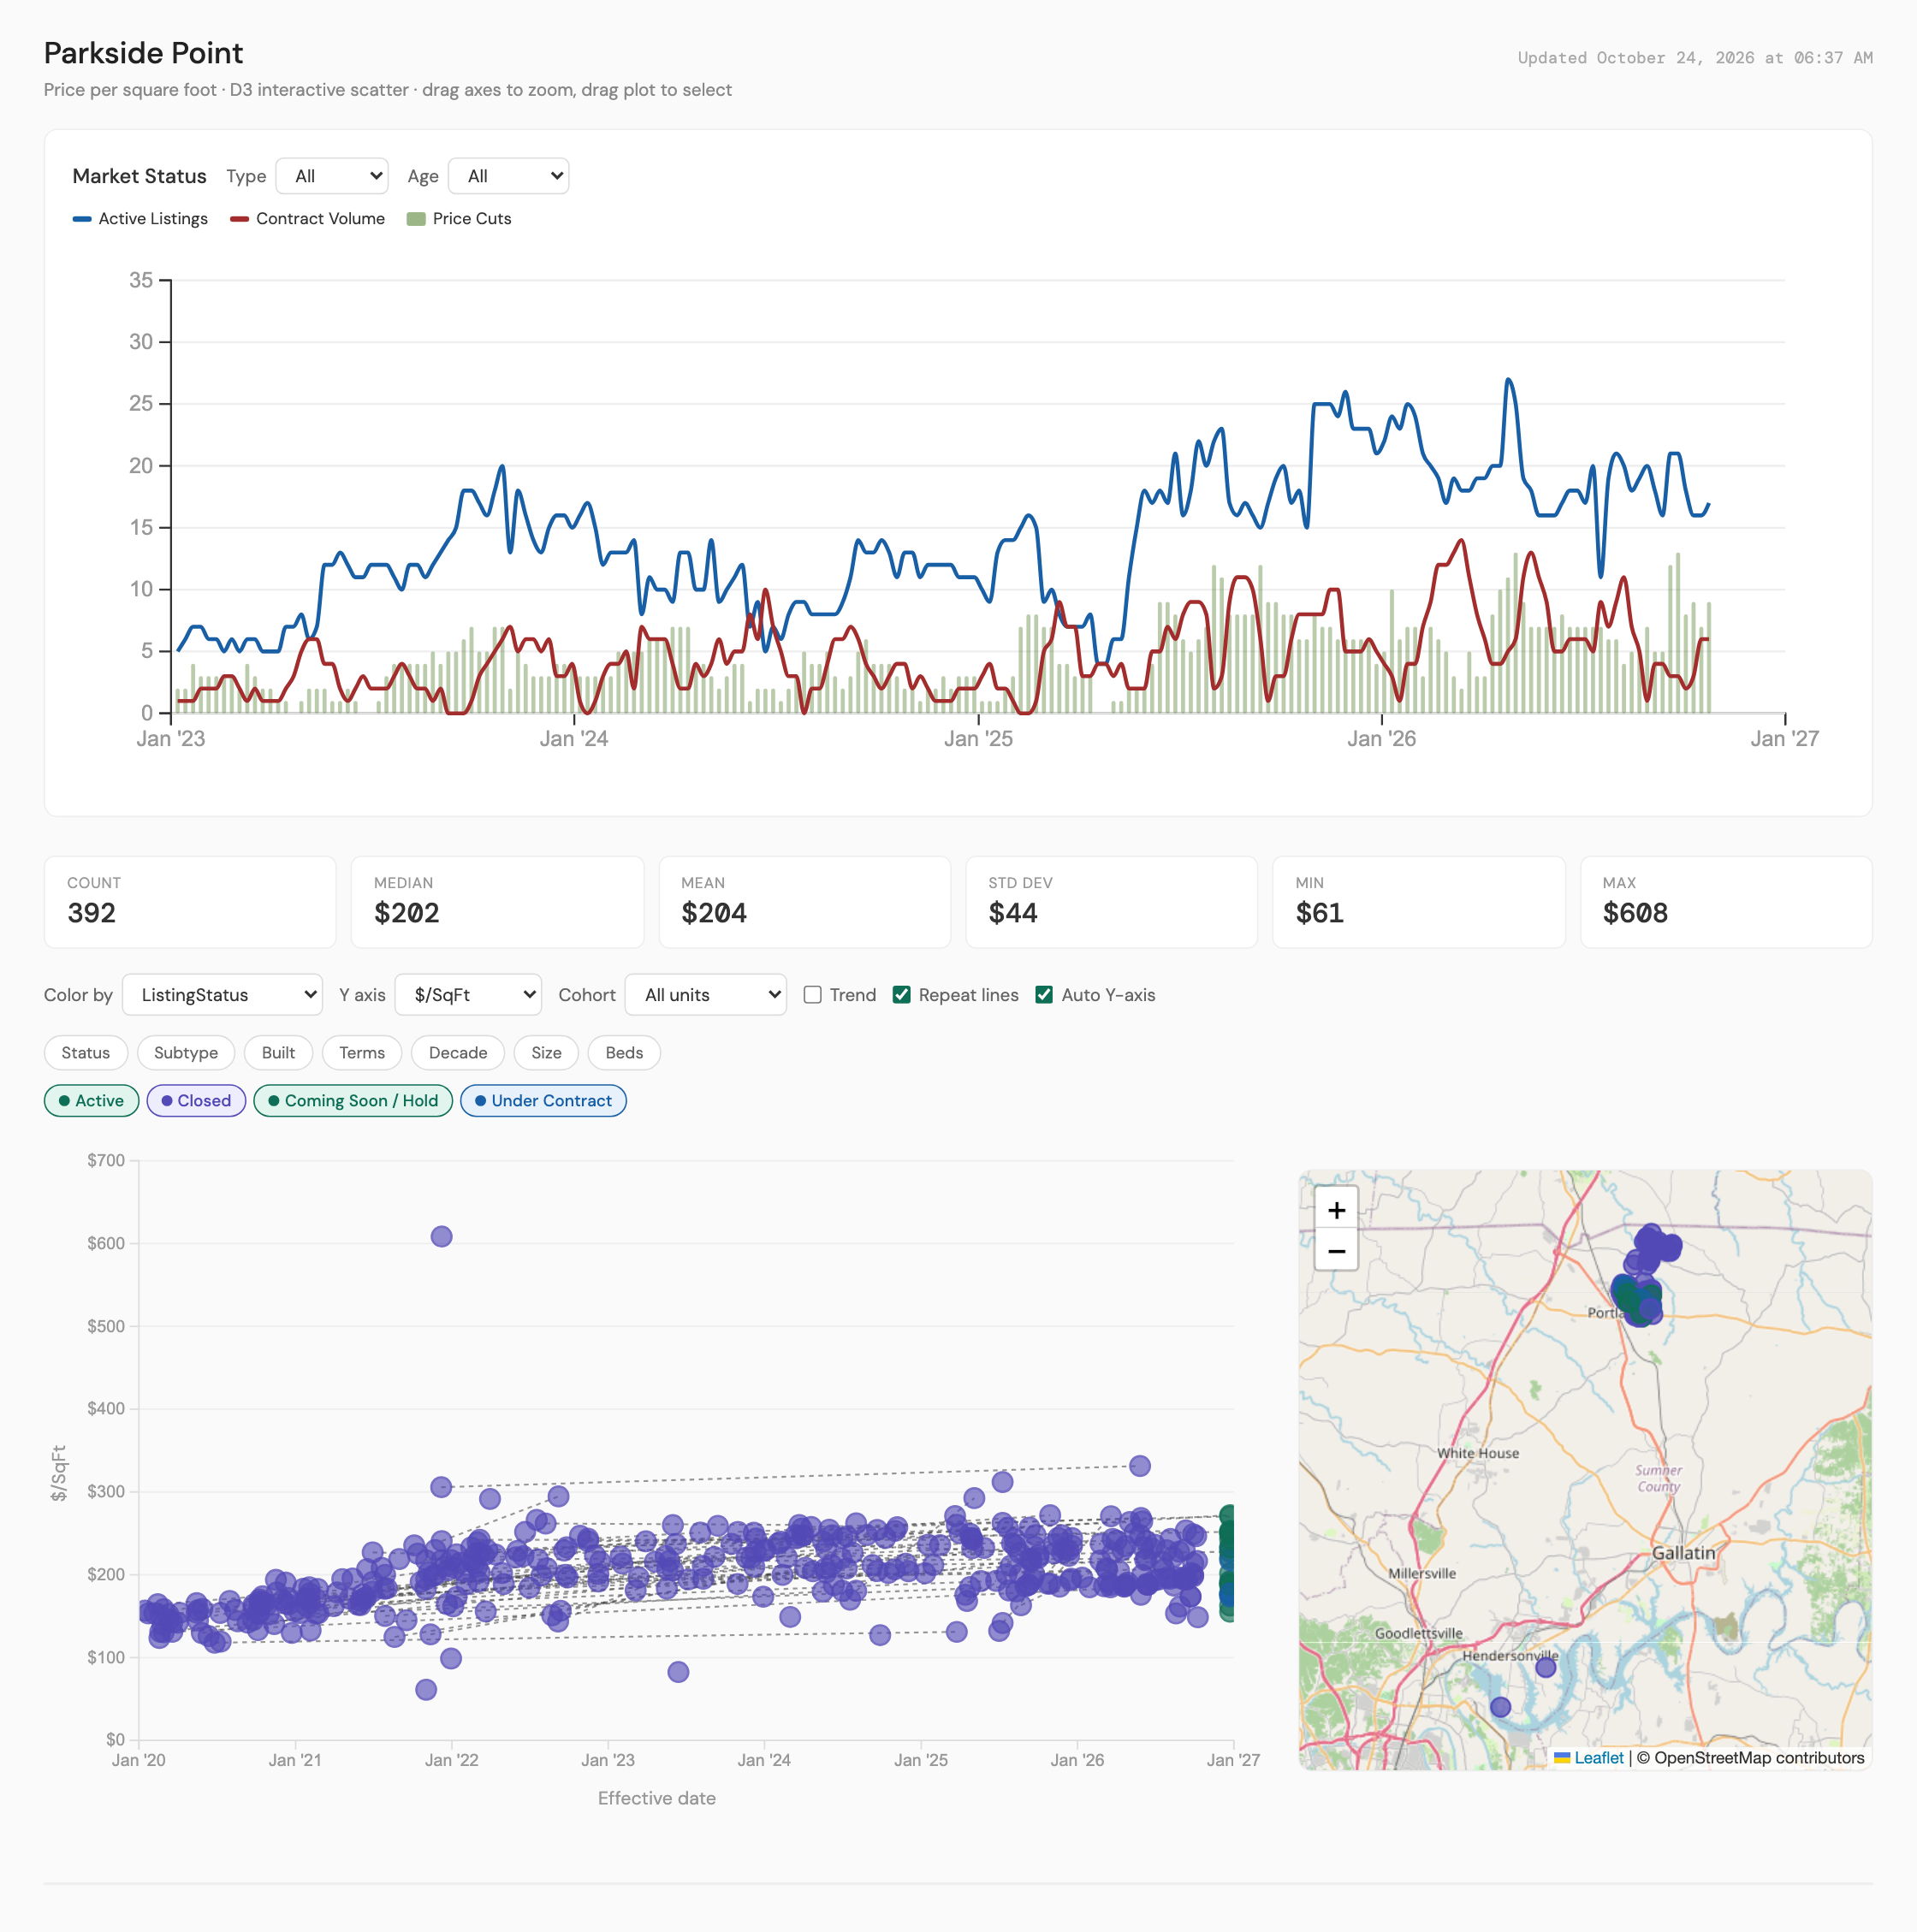
Portland, the area north of downtown Portland (map chart: Parkside Point). 6 of the area's 17 active Single Family listings are under $300K. Since 2023, 76 of the 241 listings under $300K that ended there sold (31.5%), and in 2026 it is 23 closed against 83 that left the market. The 6 active listings ask a median $293K, have been on the market a median 11 days, and the median one was built in 2026. The map chart, at any price, shows 84 closings in the last 12 months at a median $211 per square foot, -3.71 percent vs the prior 12 months, and 17 active listings against 6 contracts. This is the Parkside Point subdivision from part 8; 81 of the 83 listings that left the market this year were its new construction listings, and 31.5% is the lowest share sold of the 8 areas.
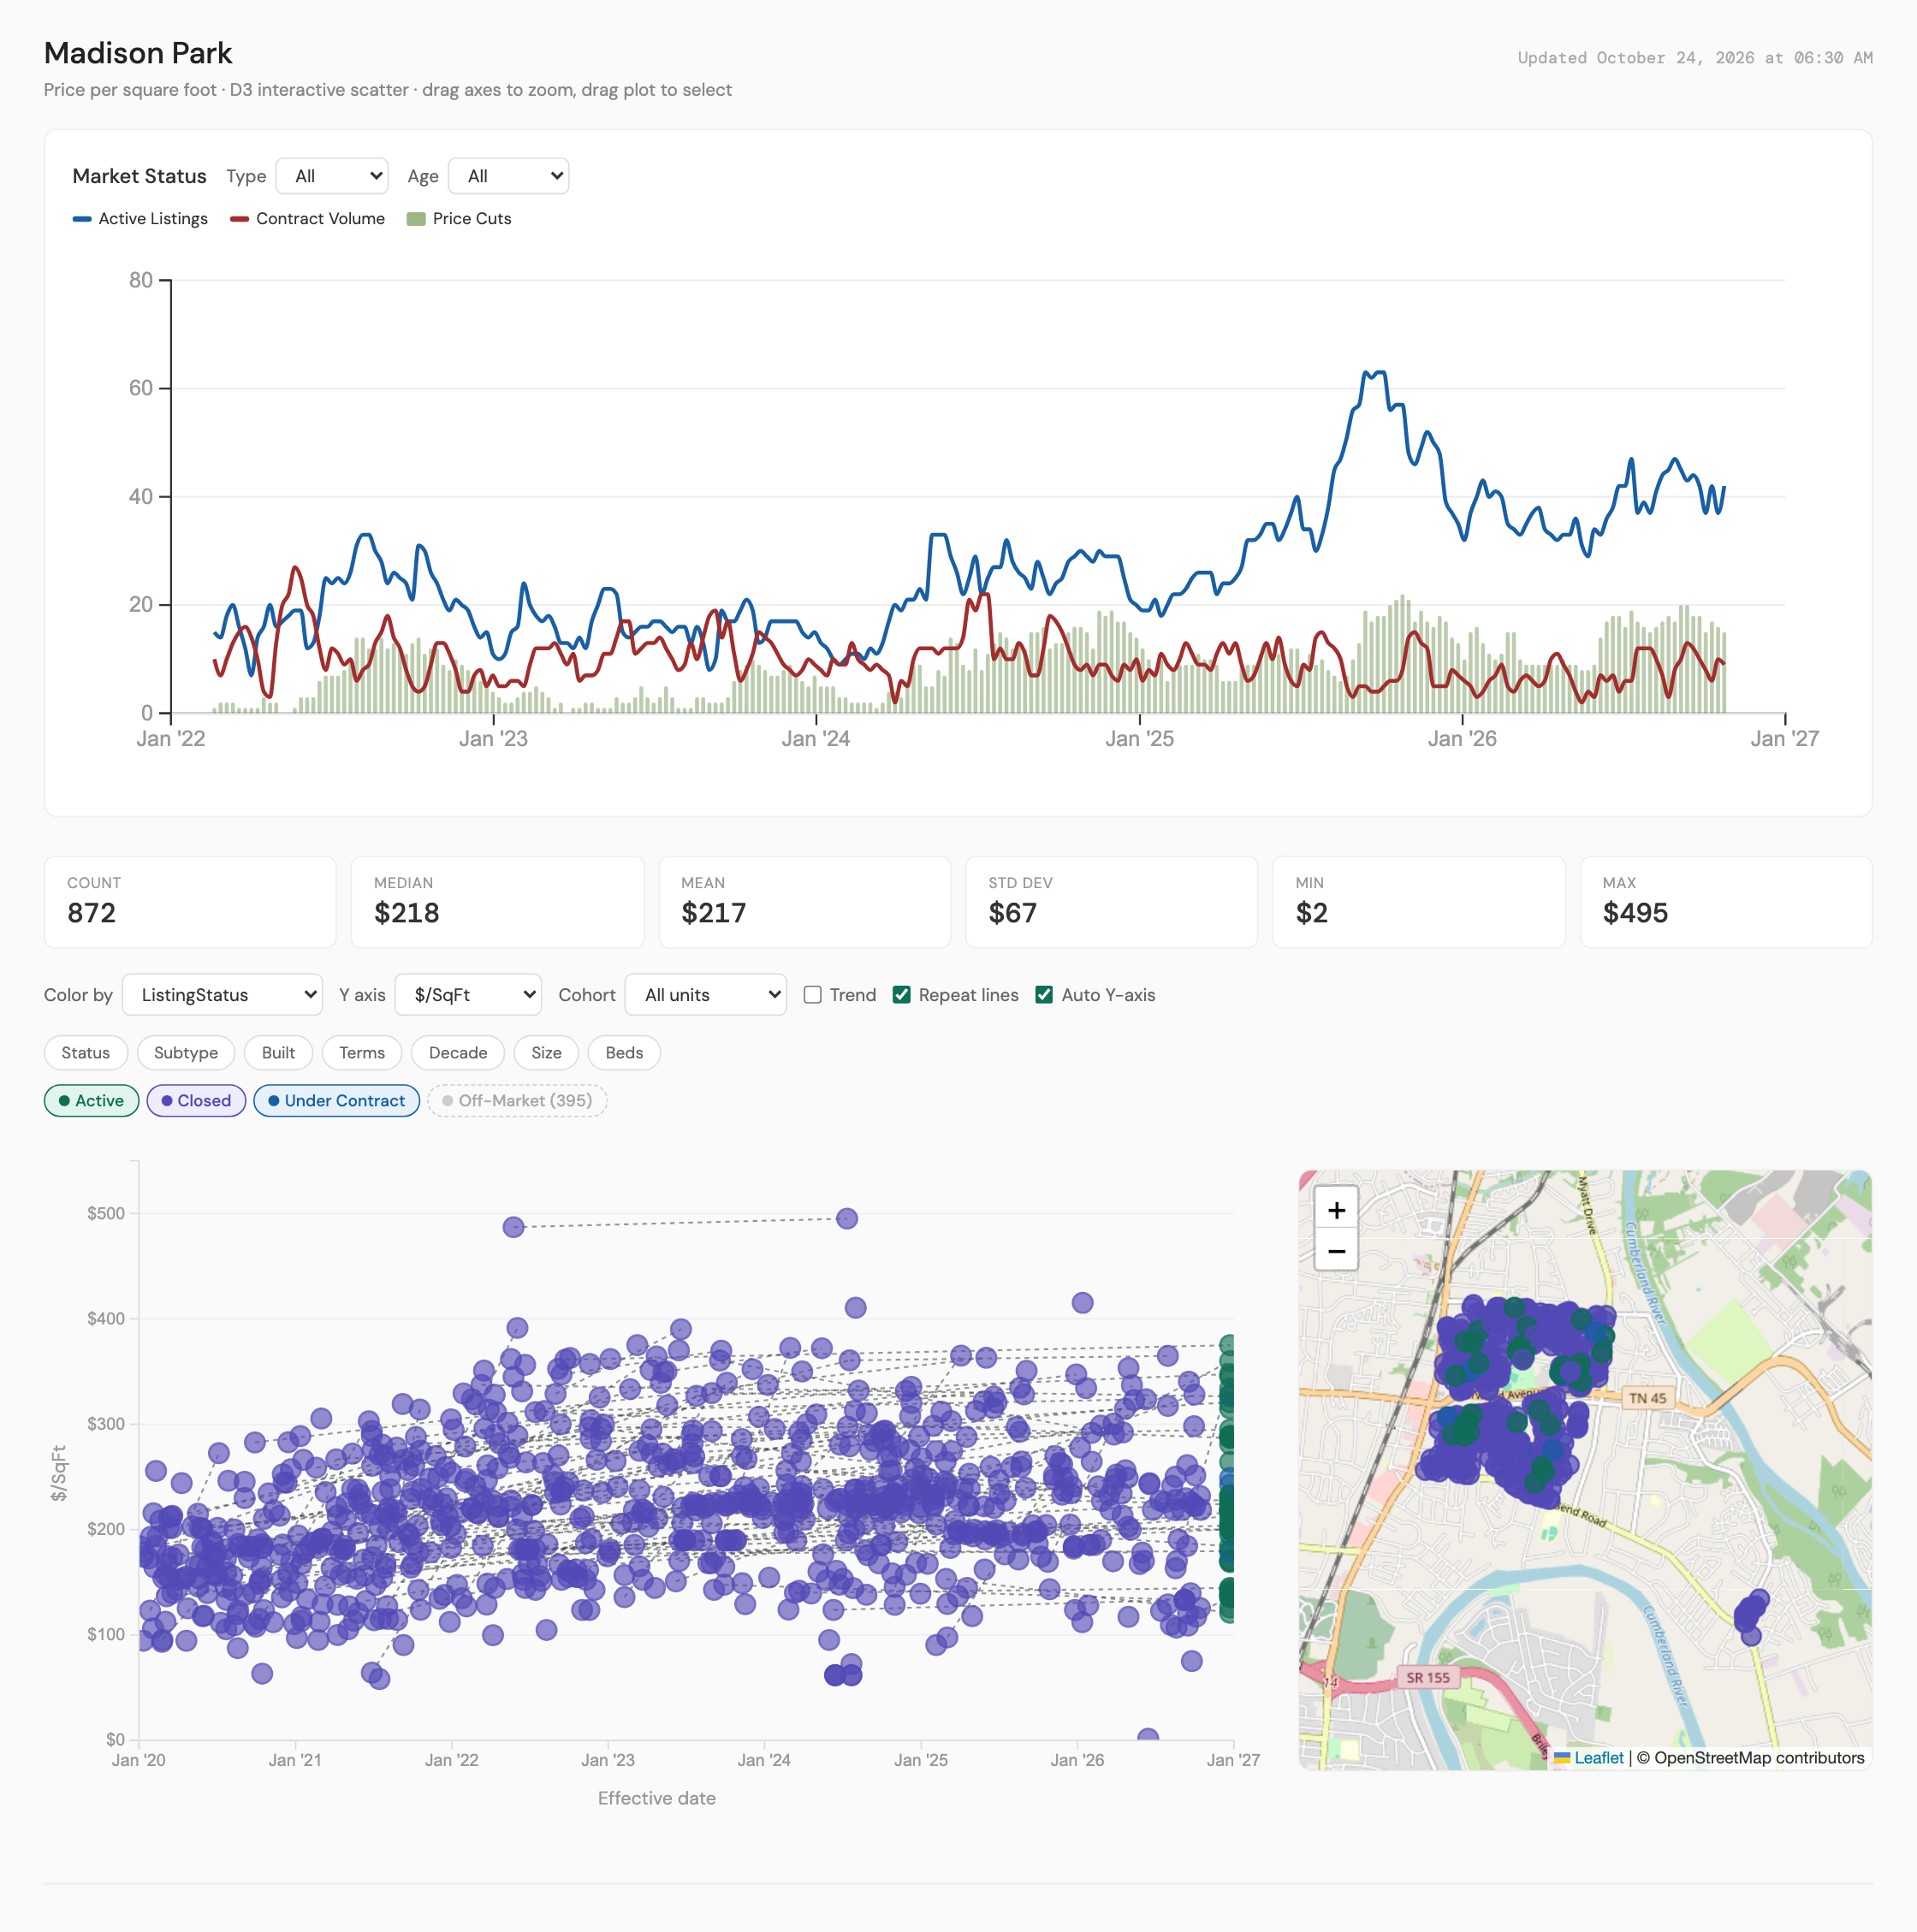
Open the Burwood, Madison chart
Burwood, Madison (map chart: Madison Park). 7 of the area's 27 active Single Family listings are under $300K. Since 2023, 102 of the 173 listings under $300K that ended there sold (59.0%), and in 2026 it is 27 closed against 20 that left the market. The 7 active listings ask a median $275K, have been on the market a median 18 days, and the median one was built in 1948. The map chart, at any price, shows 94 closings in the last 12 months at a median $228 per square foot, -0.50 percent vs the prior 12 months, and 42 active listings against 9 contracts.
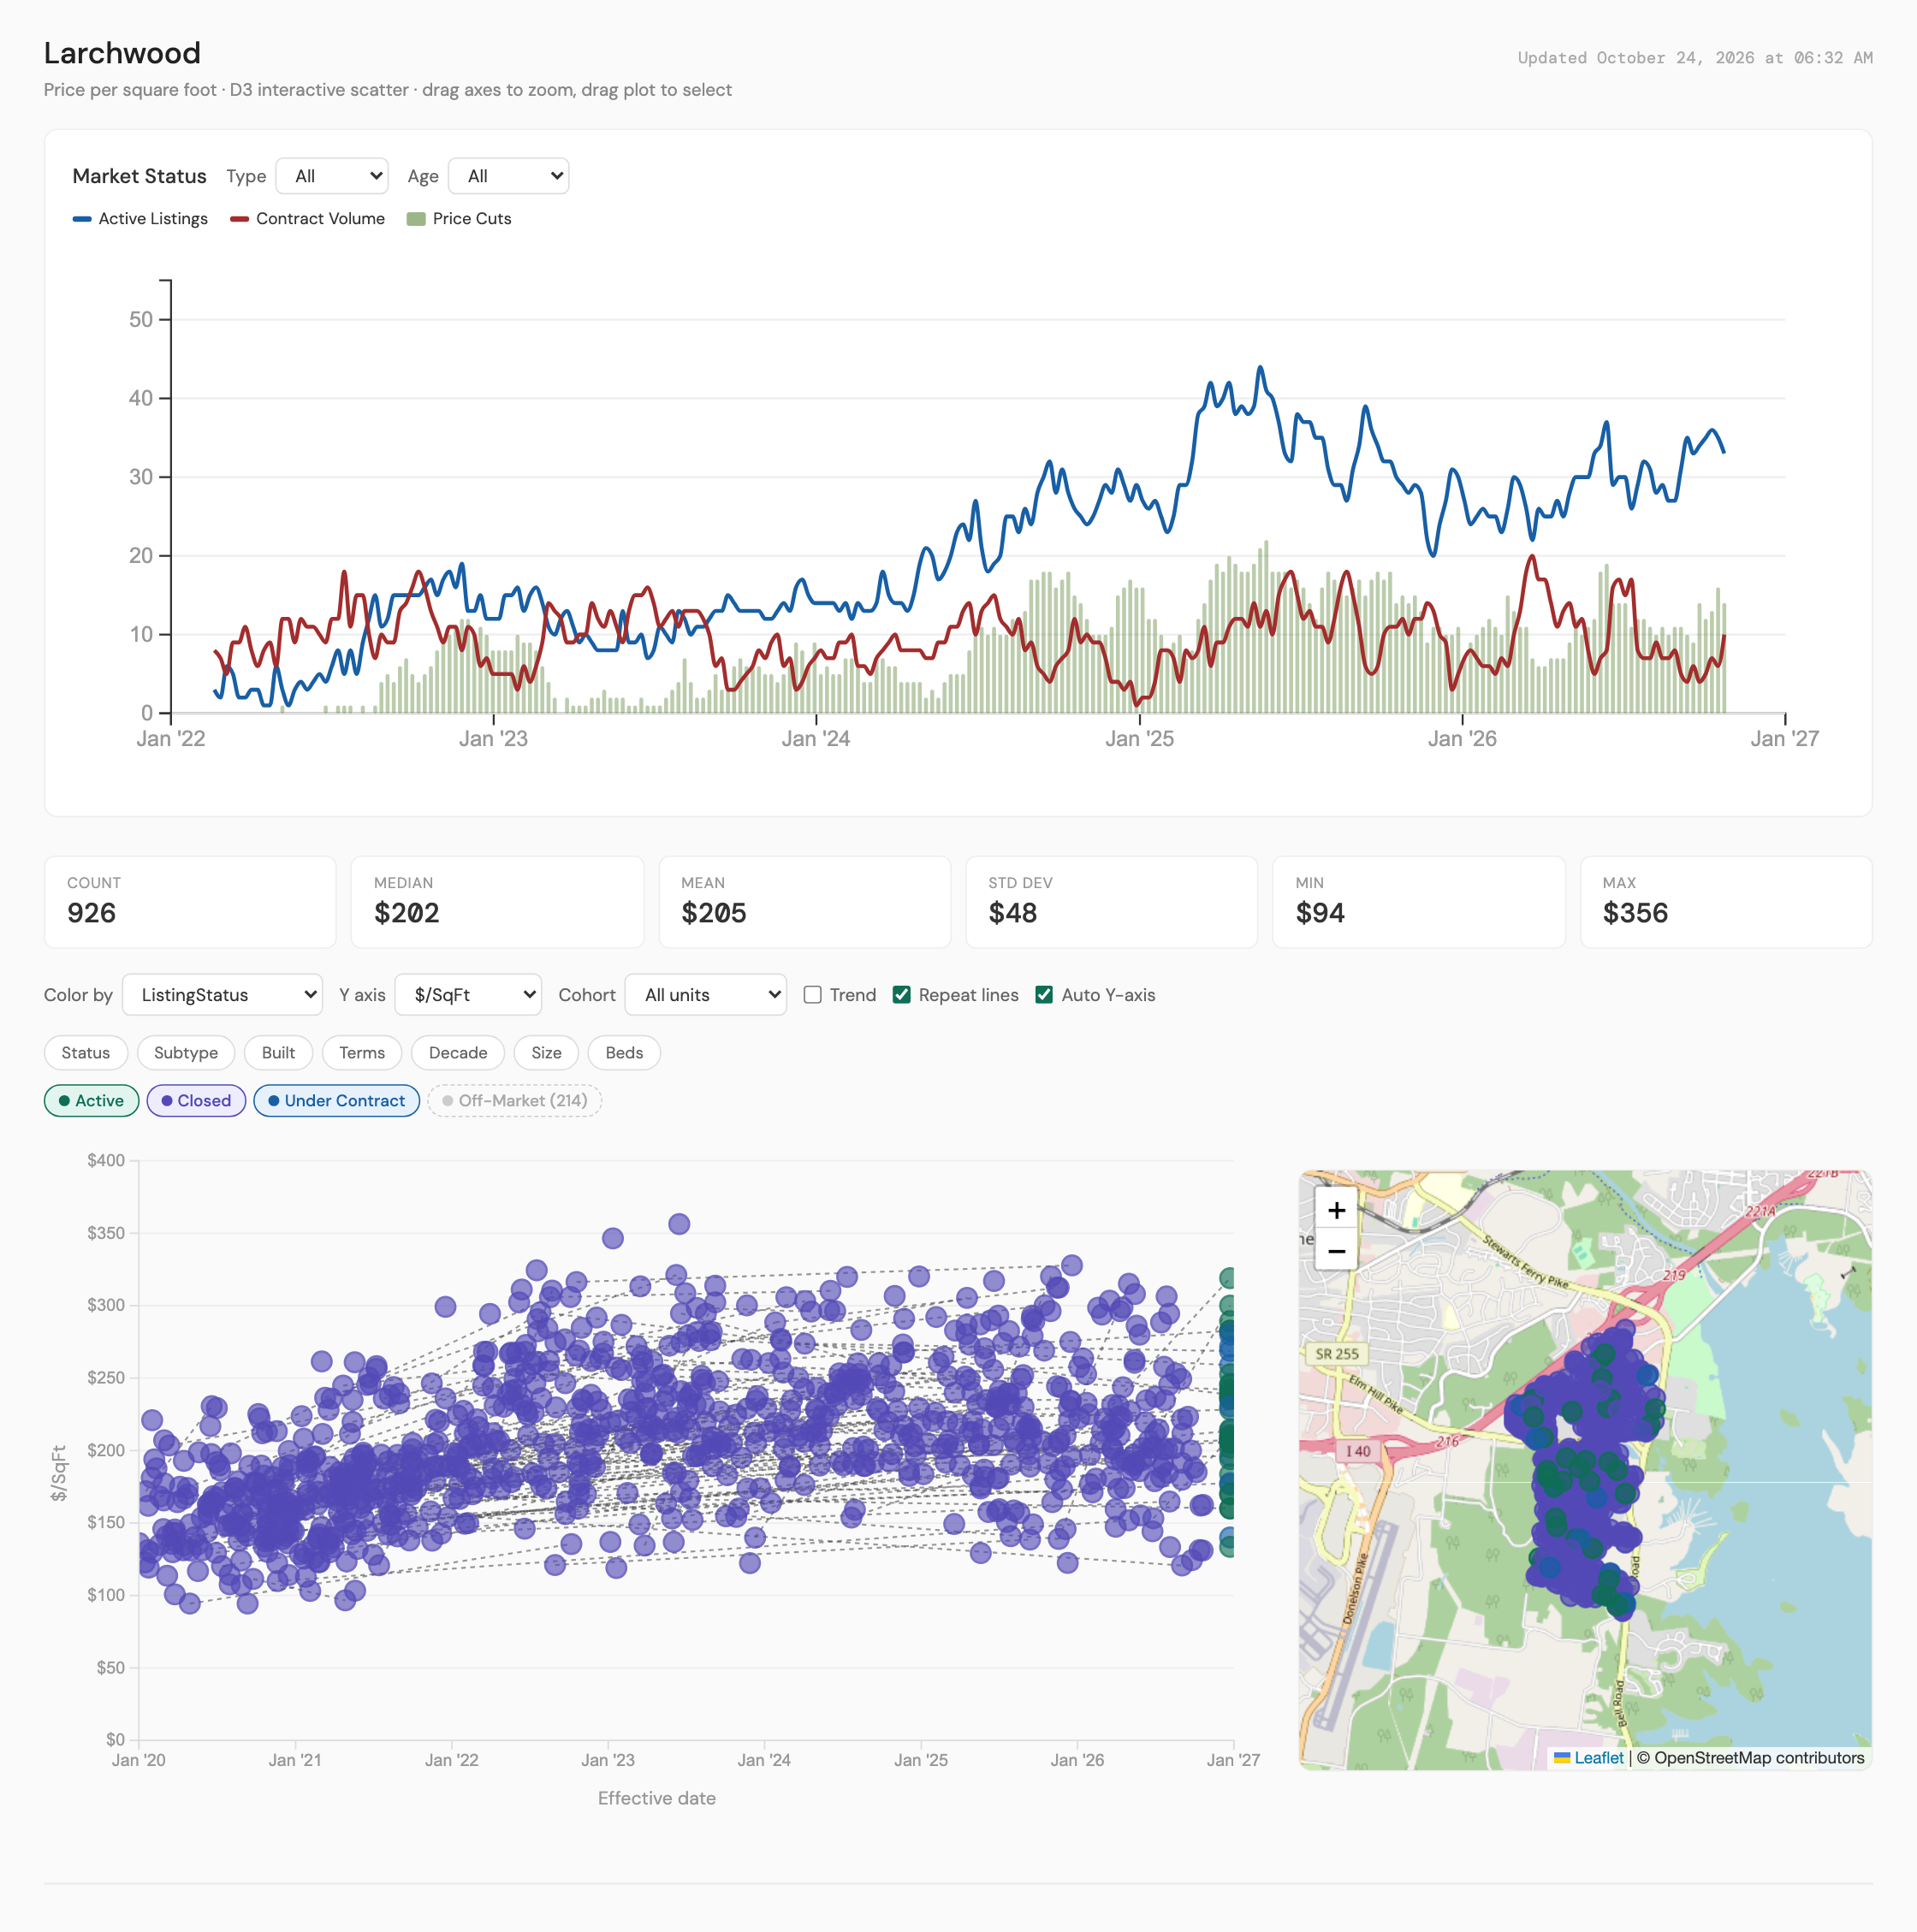
Open the Bell Rd, Donelson chart
Bell Rd, Donelson (map chart: Larchwood). 6 of the area's 23 active Single Family listings are under $300K. Since 2023, 90 of the 146 listings under $300K that ended there sold (61.6%), and in 2026 it is 18 closed against 17 that left the market. The 6 active listings ask a median $280K, have been on the market a median 40 days, and the median one was built in 1984. The map chart, at any price, shows 121 closings in the last 12 months at a median $206 per square foot, -6.62 percent vs the prior 12 months, and 33 active listings against 10 contracts. The 6.6% decline in price per square foot is the largest of the 8 areas.
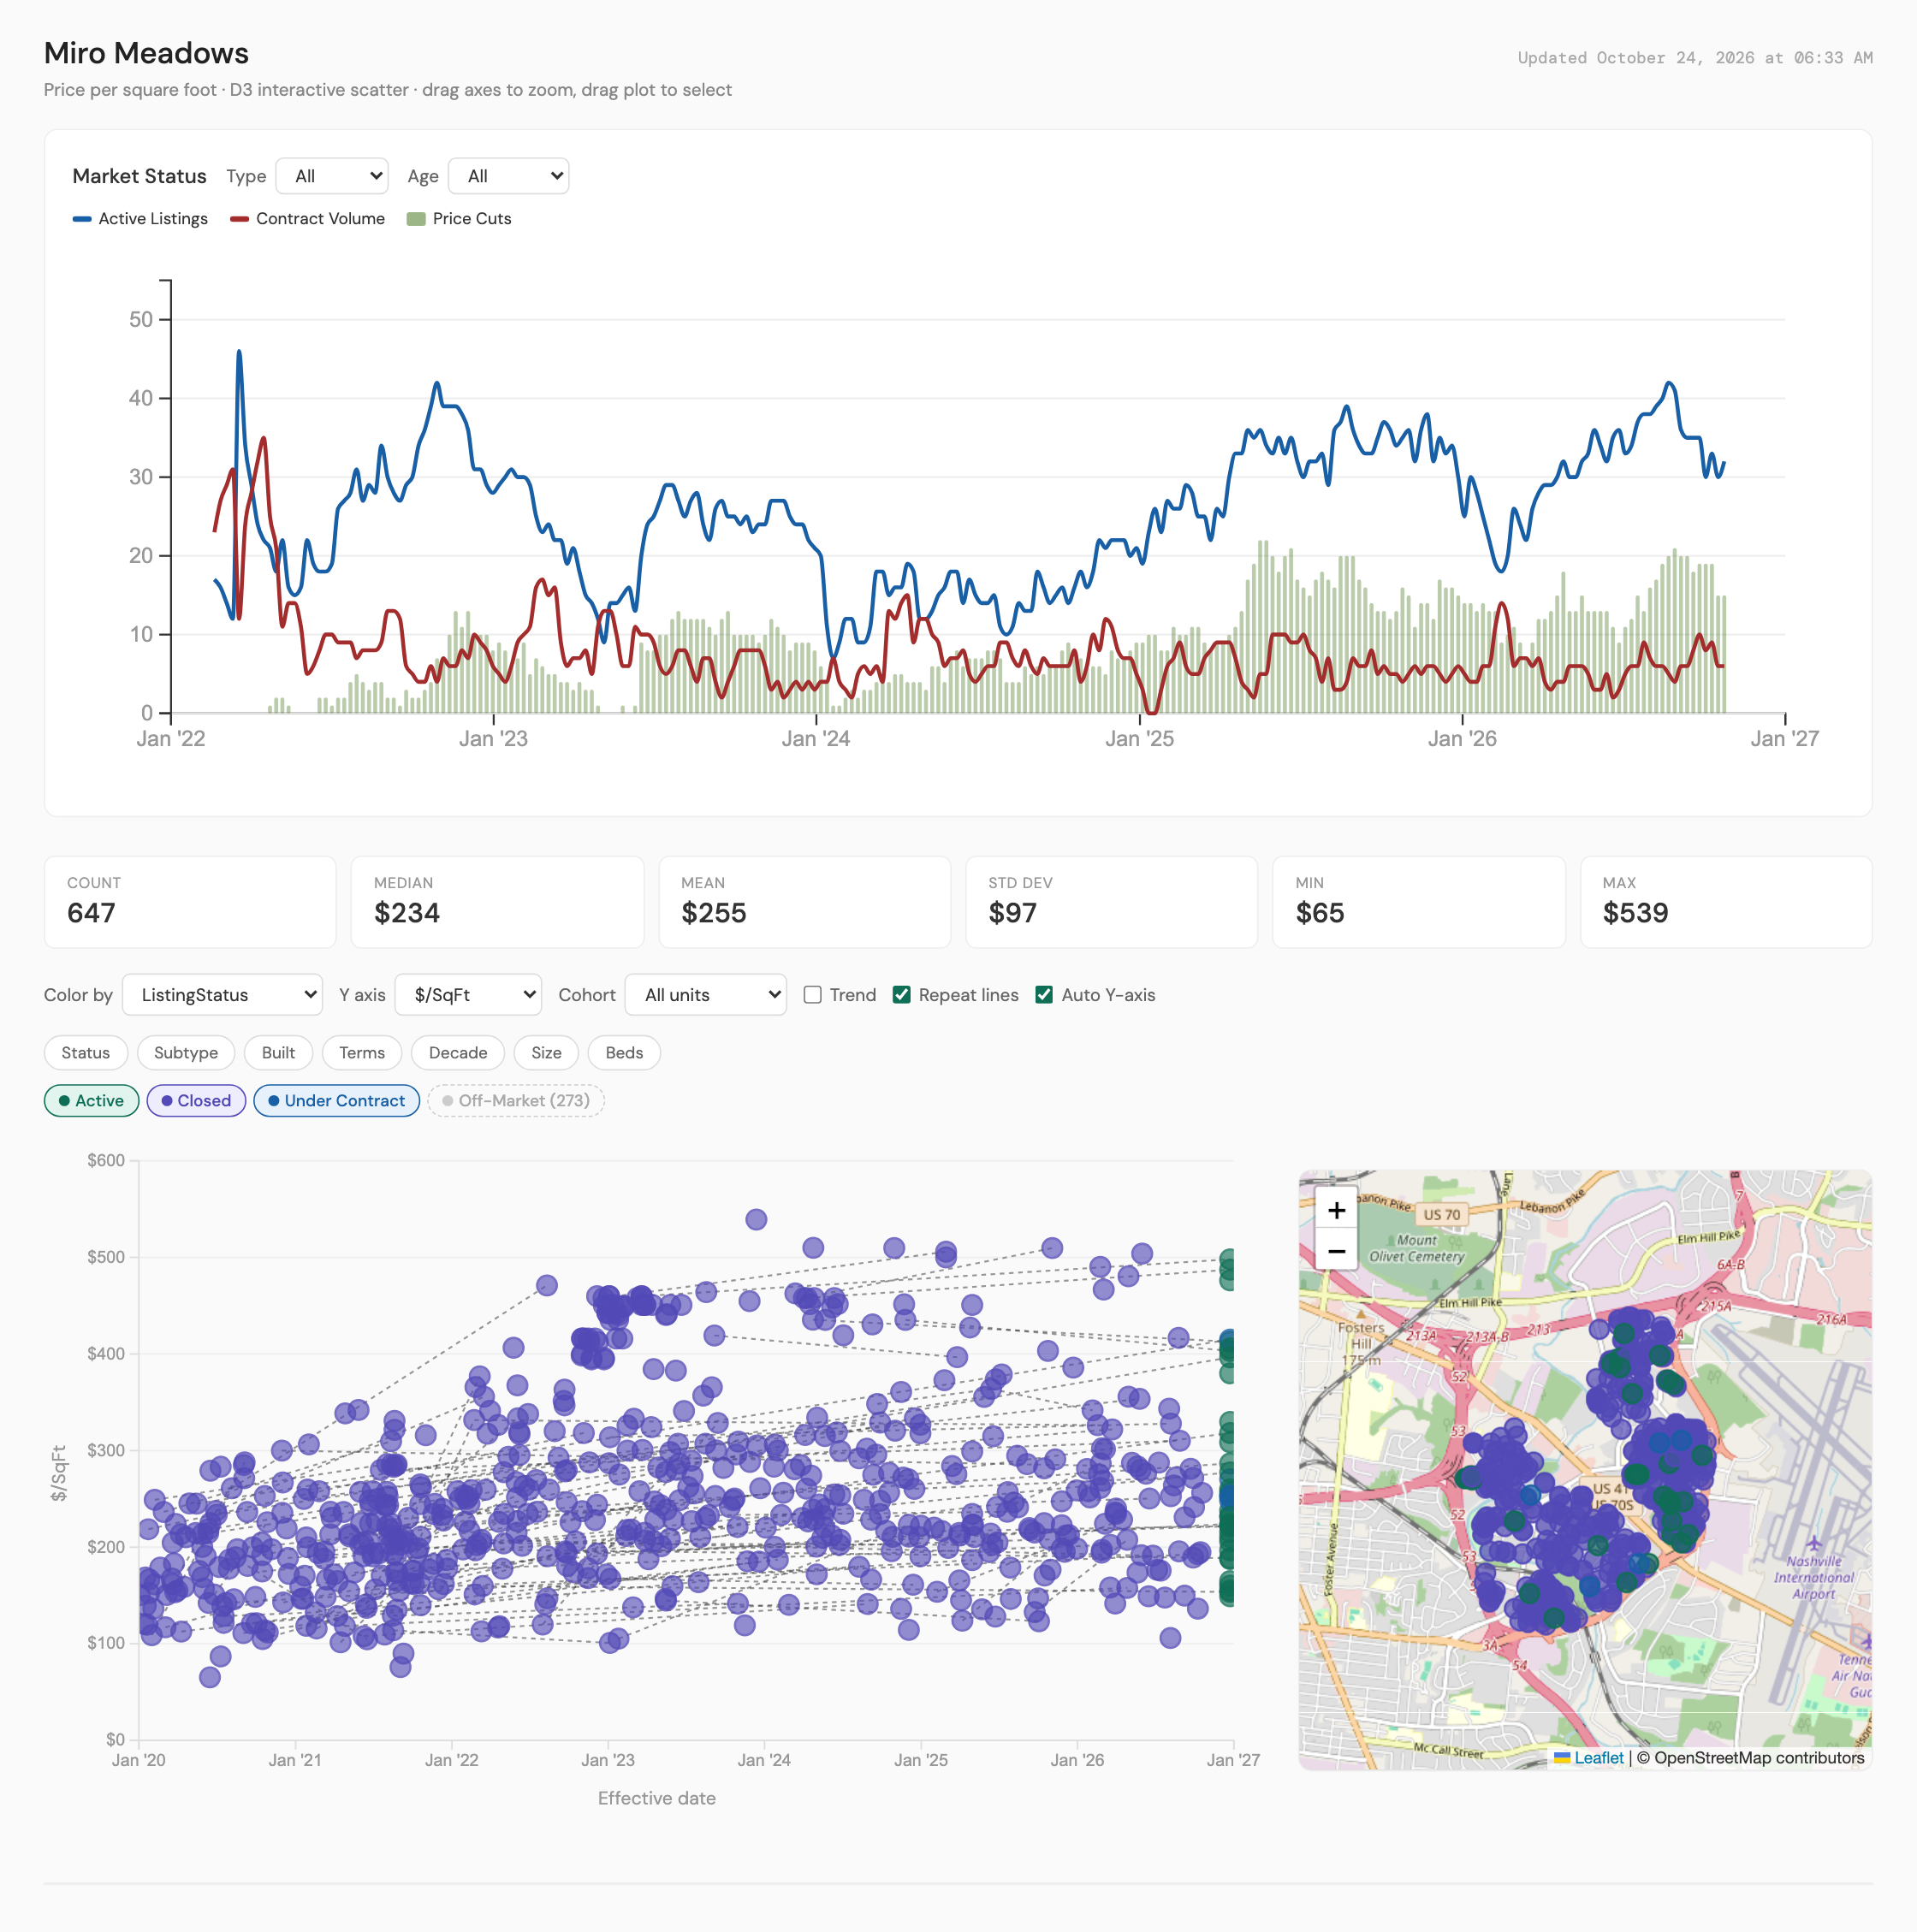
Open the Miro Meadows, 37217 chart
Miro Meadows, 37217. 6 of the area's 19 active Single Family listings are under $300K. Since 2023, 59 of the 82 listings under $300K that ended there sold (72.0%), and in 2026 it is 13 closed against 3 that left the market. The 6 active listings ask a median $289K, have been on the market a median 20 days, and the median one was built in 1950. The map chart, at any price, shows 75 closings in the last 12 months at a median $250 per square foot, 12.04 percent vs the prior 12 months, and 32 active listings against 6 contracts. 72.0% is the highest share sold of the 8 areas, and the 12.0% rise in price per square foot is the largest increase.
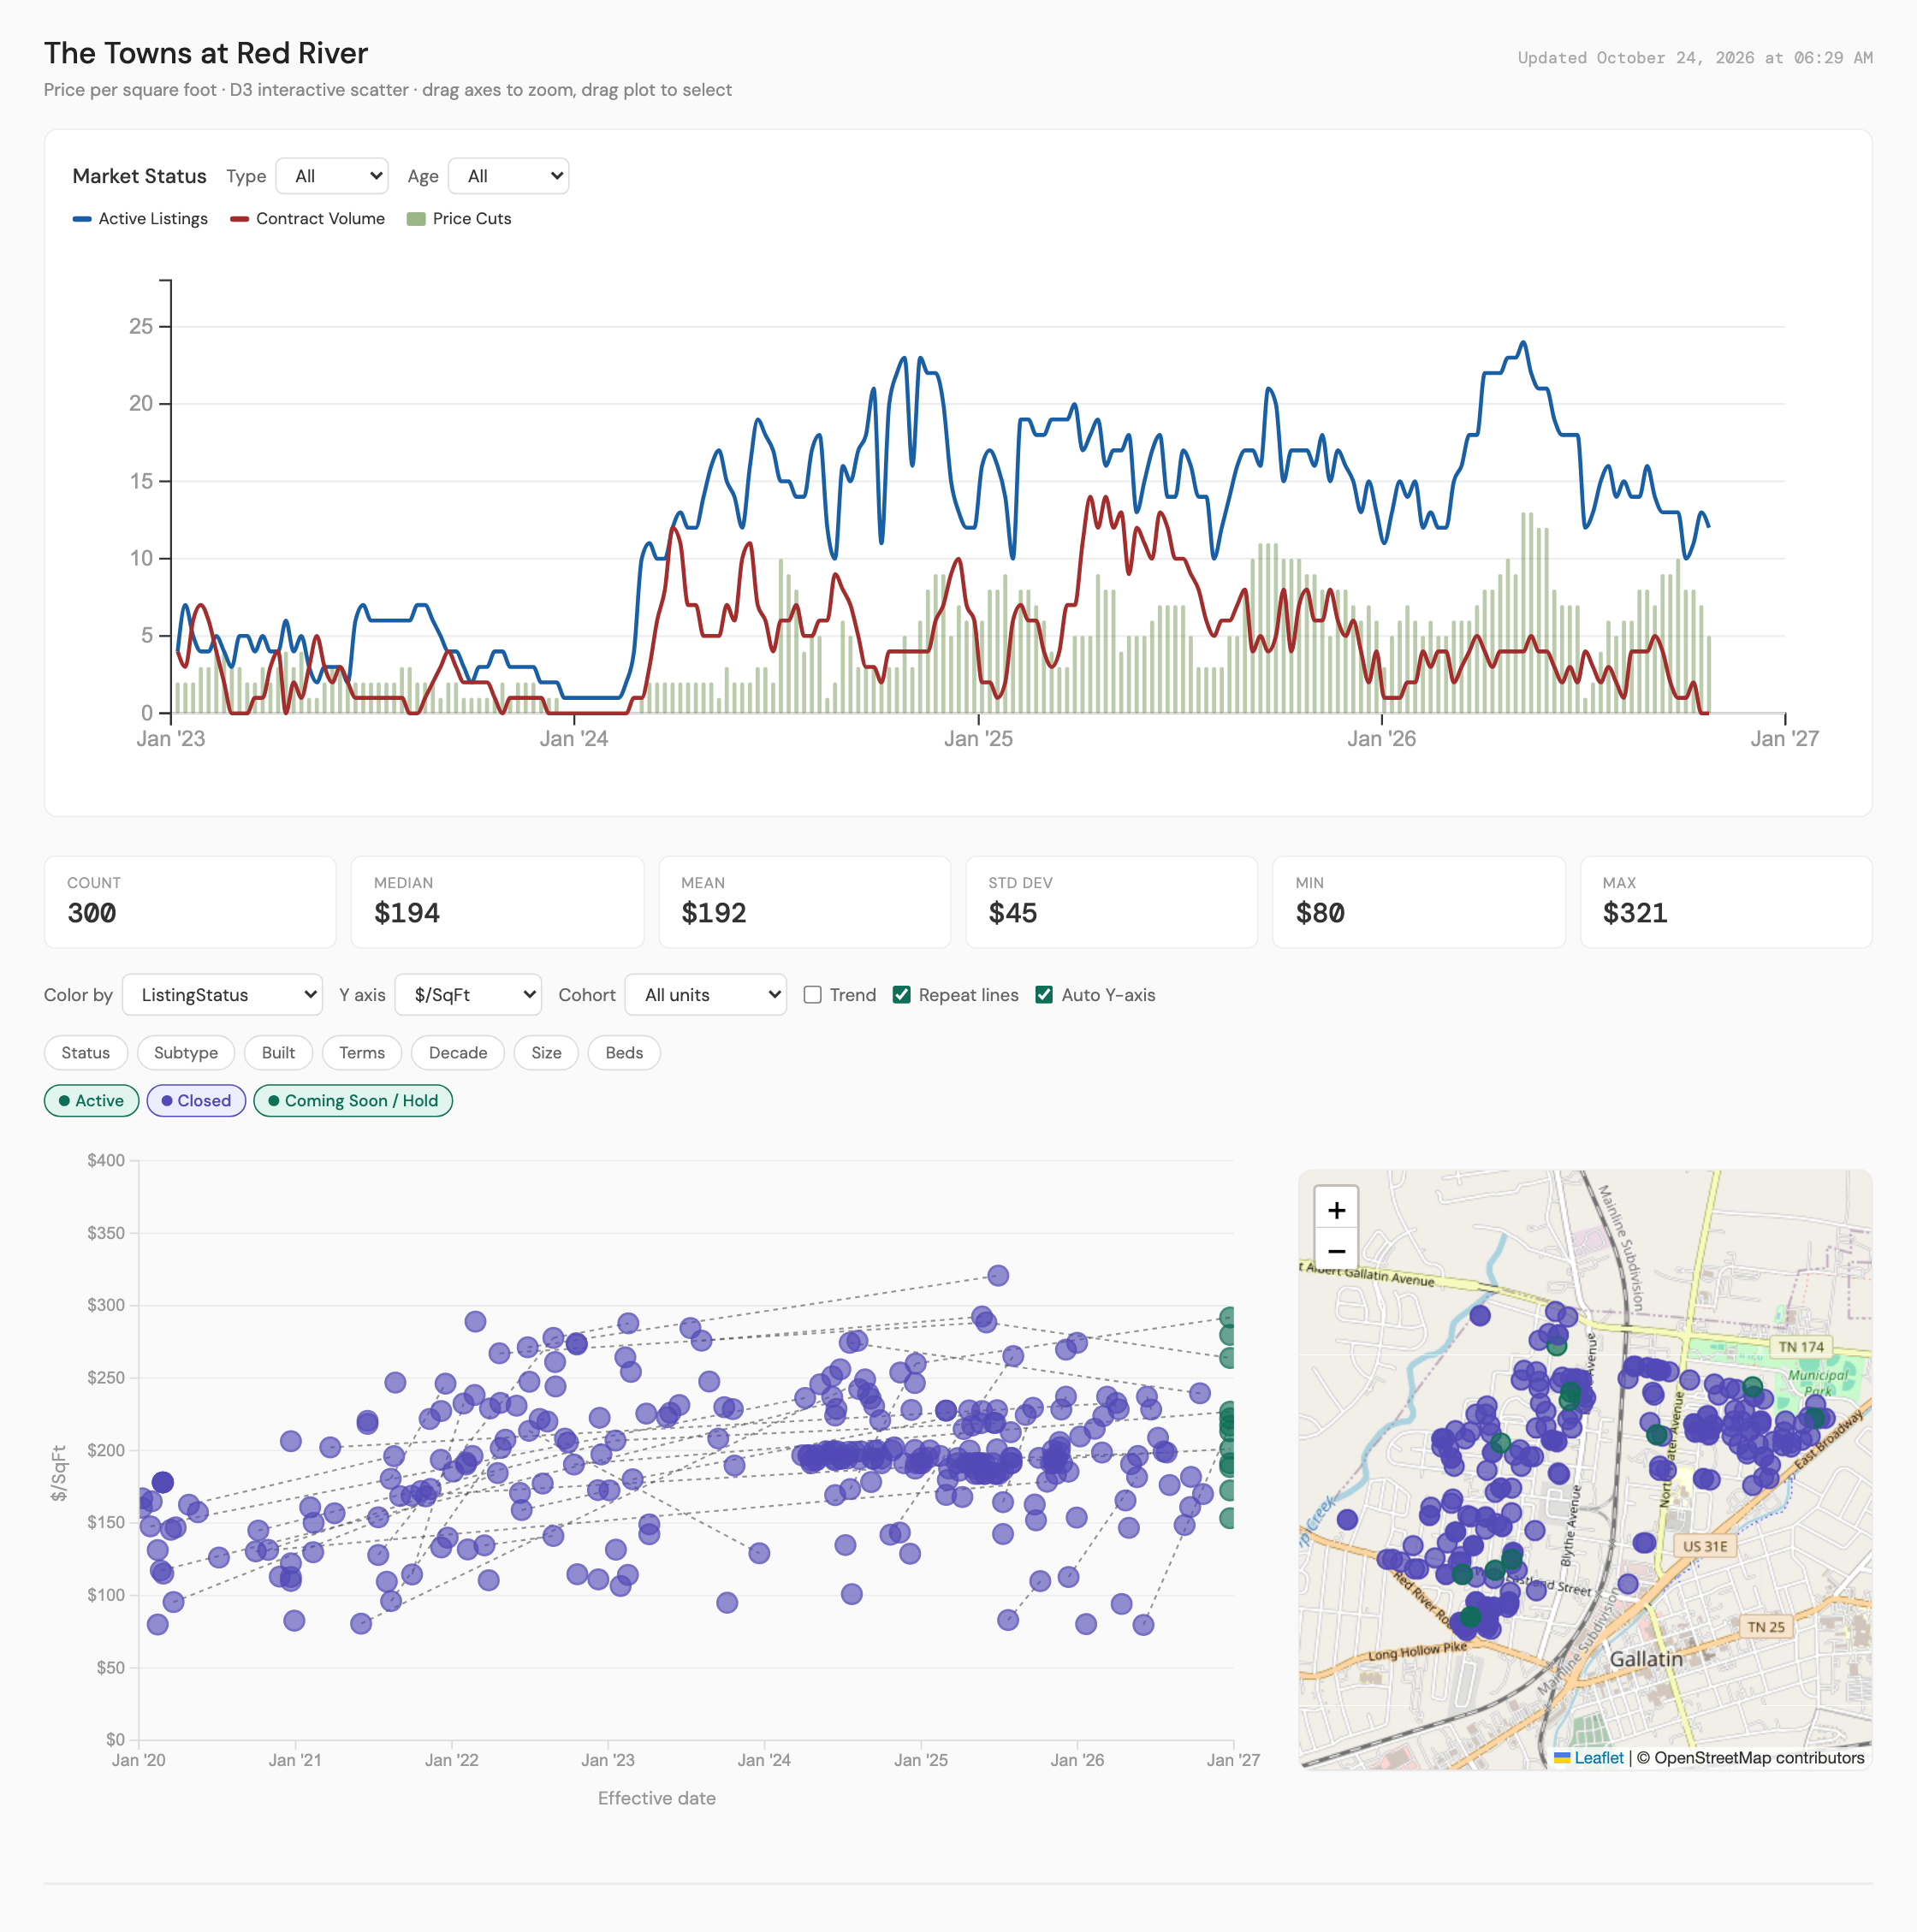
Open the Municipal Park, Gallatin chart
Municipal Park, Gallatin (map chart: The Towns at Red River). 6 of the area's 10 active Single Family listings are under $300K. Since 2023, 84 of the 126 listings under $300K that ended there sold (66.7%), and in 2026 it is 16 closed against 15 that left the market. The 6 active listings ask a median $244K, have been on the market a median 74 days, and the median one was built in 1955. The map chart, at any price, shows 46 closings in the last 12 months at a median $195 per square foot, 1.92 percent vs the prior 12 months, and 12 active listings against 0 contracts. 75 days on the market is the most of the 8 areas.
8. What happens to listings under $300K in the 7 zip codes with the most of them?
7 zip codes have 19 or more of the 447 listings: Columbia (38401) 41, Springfield (37172) 36, Portland (37148) 30, Dickson (37055) 25, Antioch (37013) 21, Madison (37115) 19 and North Nashville's 37207 with 19. They are 191 of the 447 between them. For each one, the chart below shows every Single Family listing under $300K since January 2023 by the day it closed (the blue points) or left the market without selling (the points that are not blue), with the listings on the market now in red on the right, price per square foot up the side, and the past year's median sale as the gold line. A listing that left the MLS feed without a closing is shown as cancelled on the day it was last seen. Under each chart is a link to the chart on its own, where you can see the address and price of any listing, see the chart by price or by year built, and read the full list of listings.
Across the 7 zip codes, 3,388 of 5,091 listings that ended since 2023 sold, 66.5%. The share sold in 2026 is below the same part of 2025 in 5 of the 7: Springfield, Portland, Dickson, Antioch and Madison. Columbia and 37207 are above.
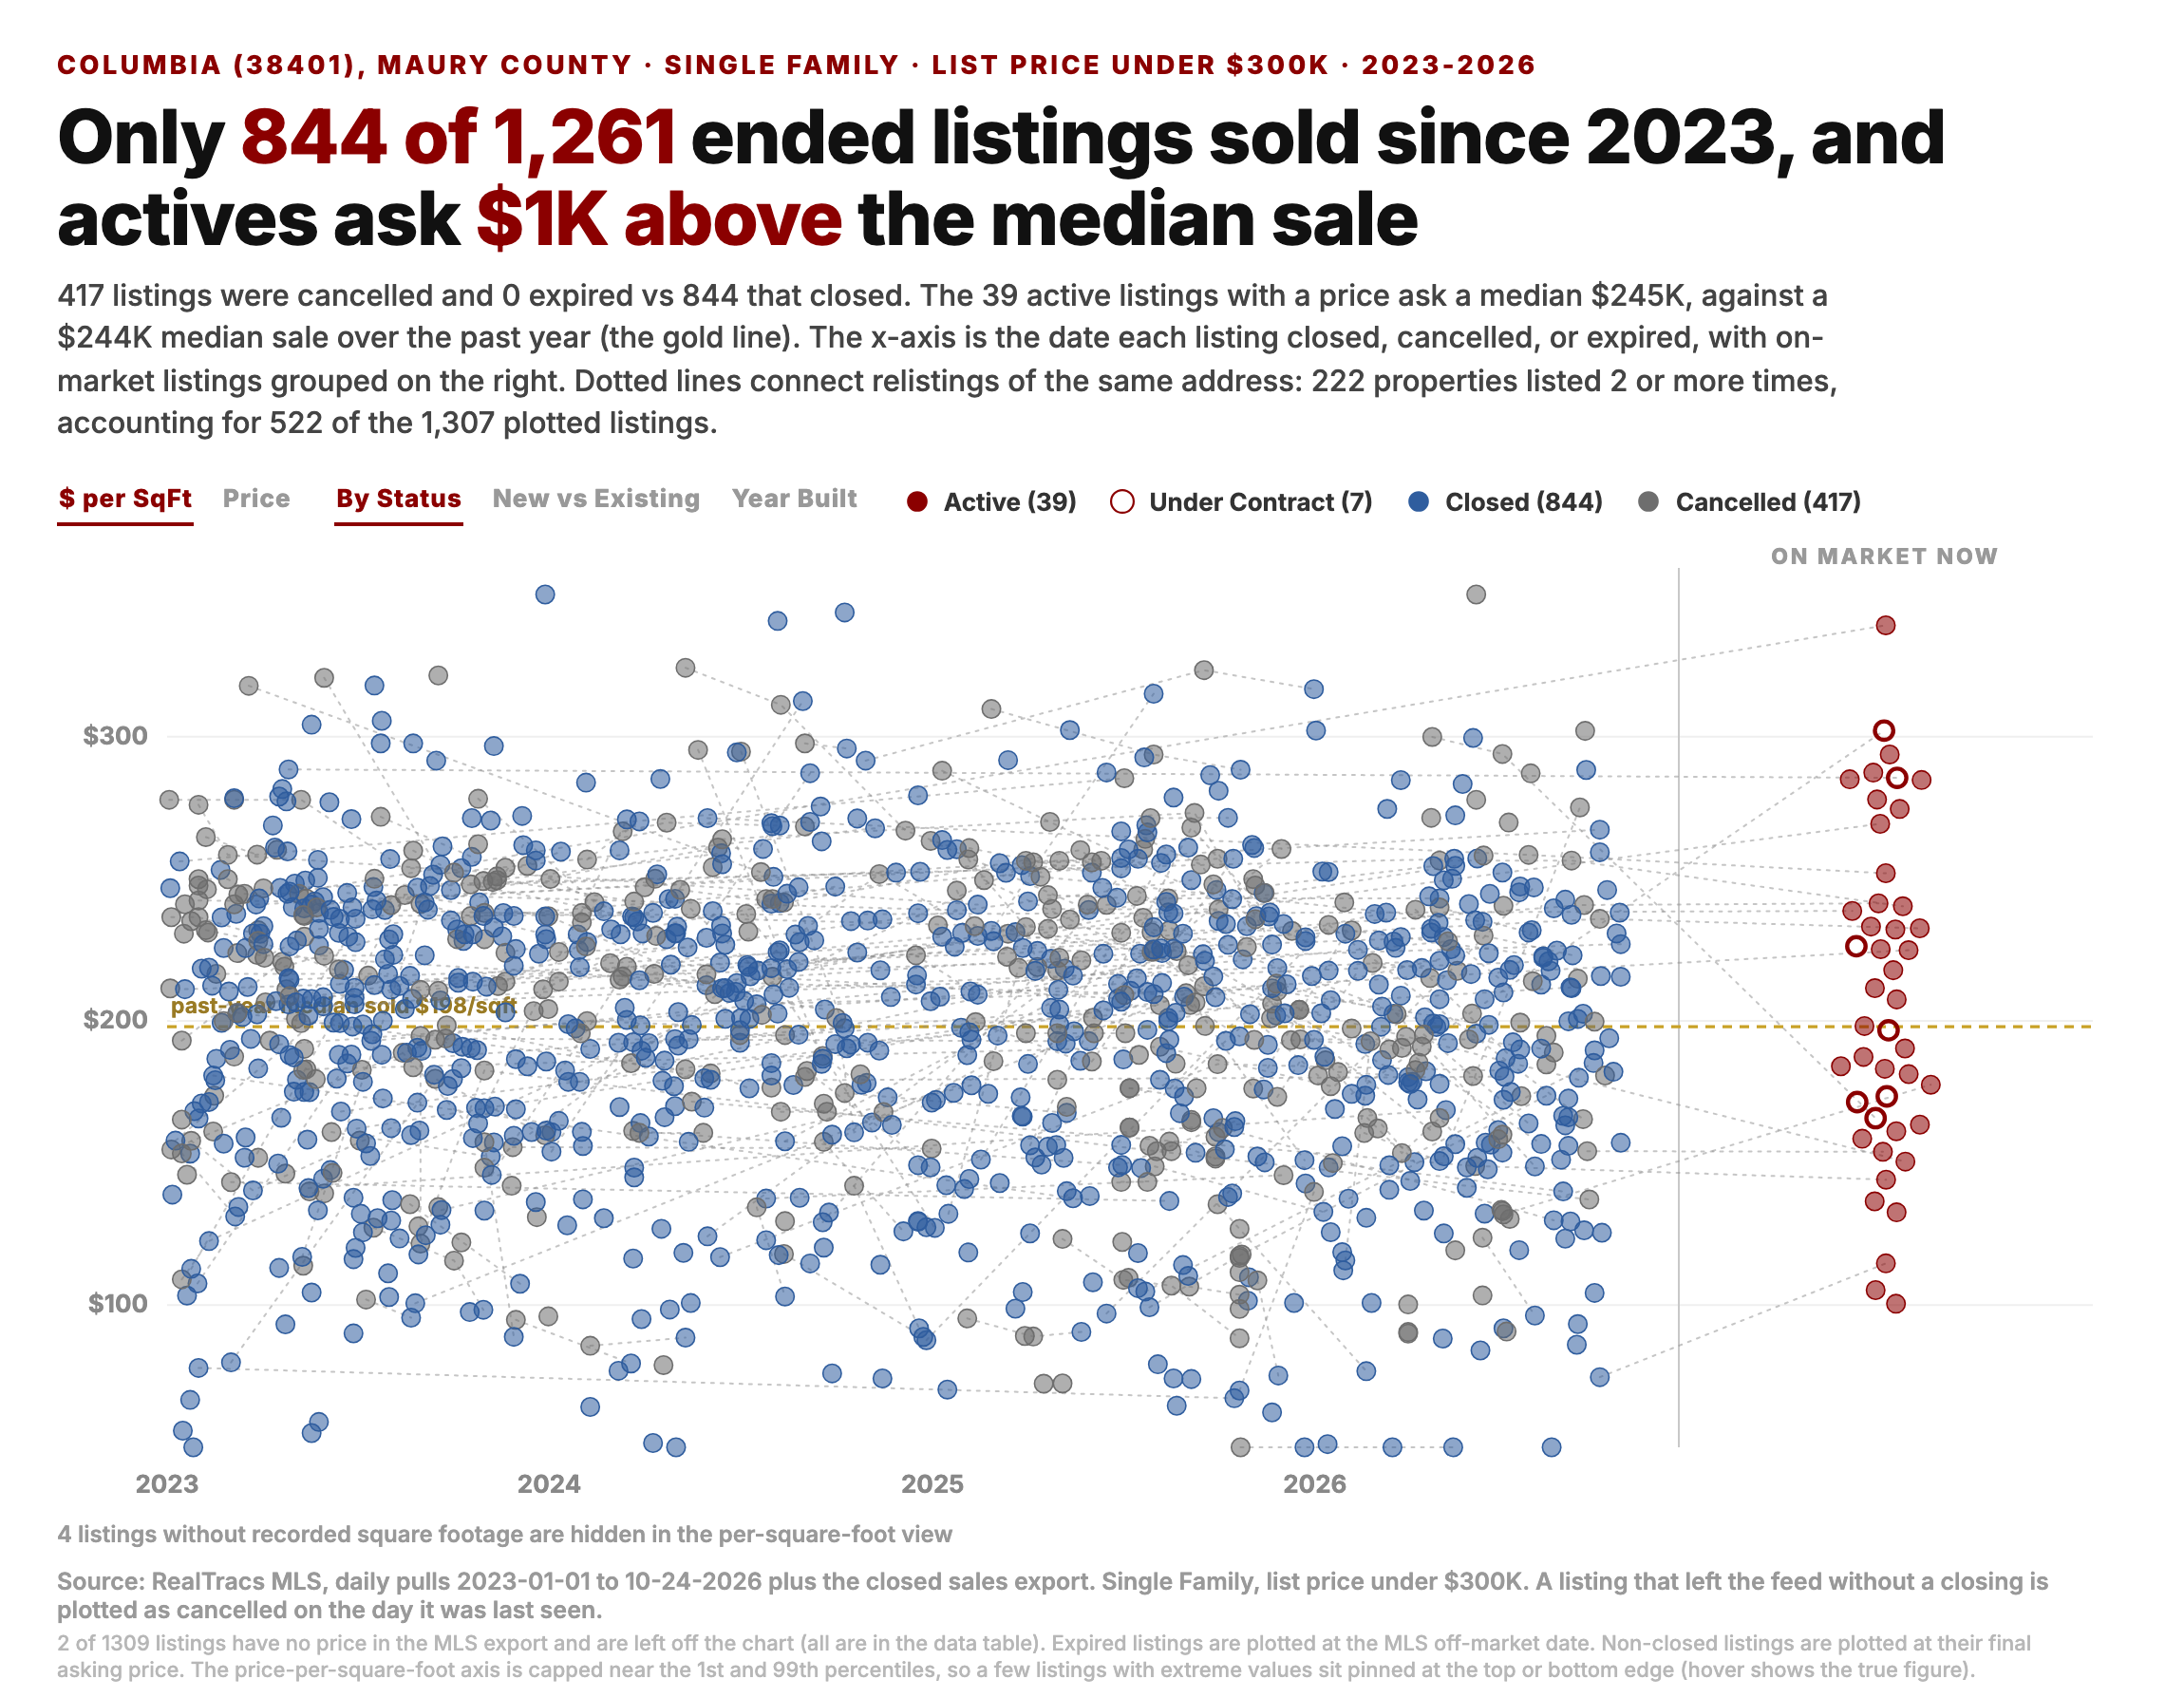
Columbia (38401), 41 listings. 844 of 1,261 listings that ended since 2023 sold, 66.9%, and 417 left the market without selling. In 2026 through October 24, 181 closed against 76 that did not (70.4% sold), from 169 and 112 (60.1%) over the same part of 2025. The 39 active listings with a price ask a median $245K against a $244K median sale over the past year, and the median active listing has been on the market 55 days.
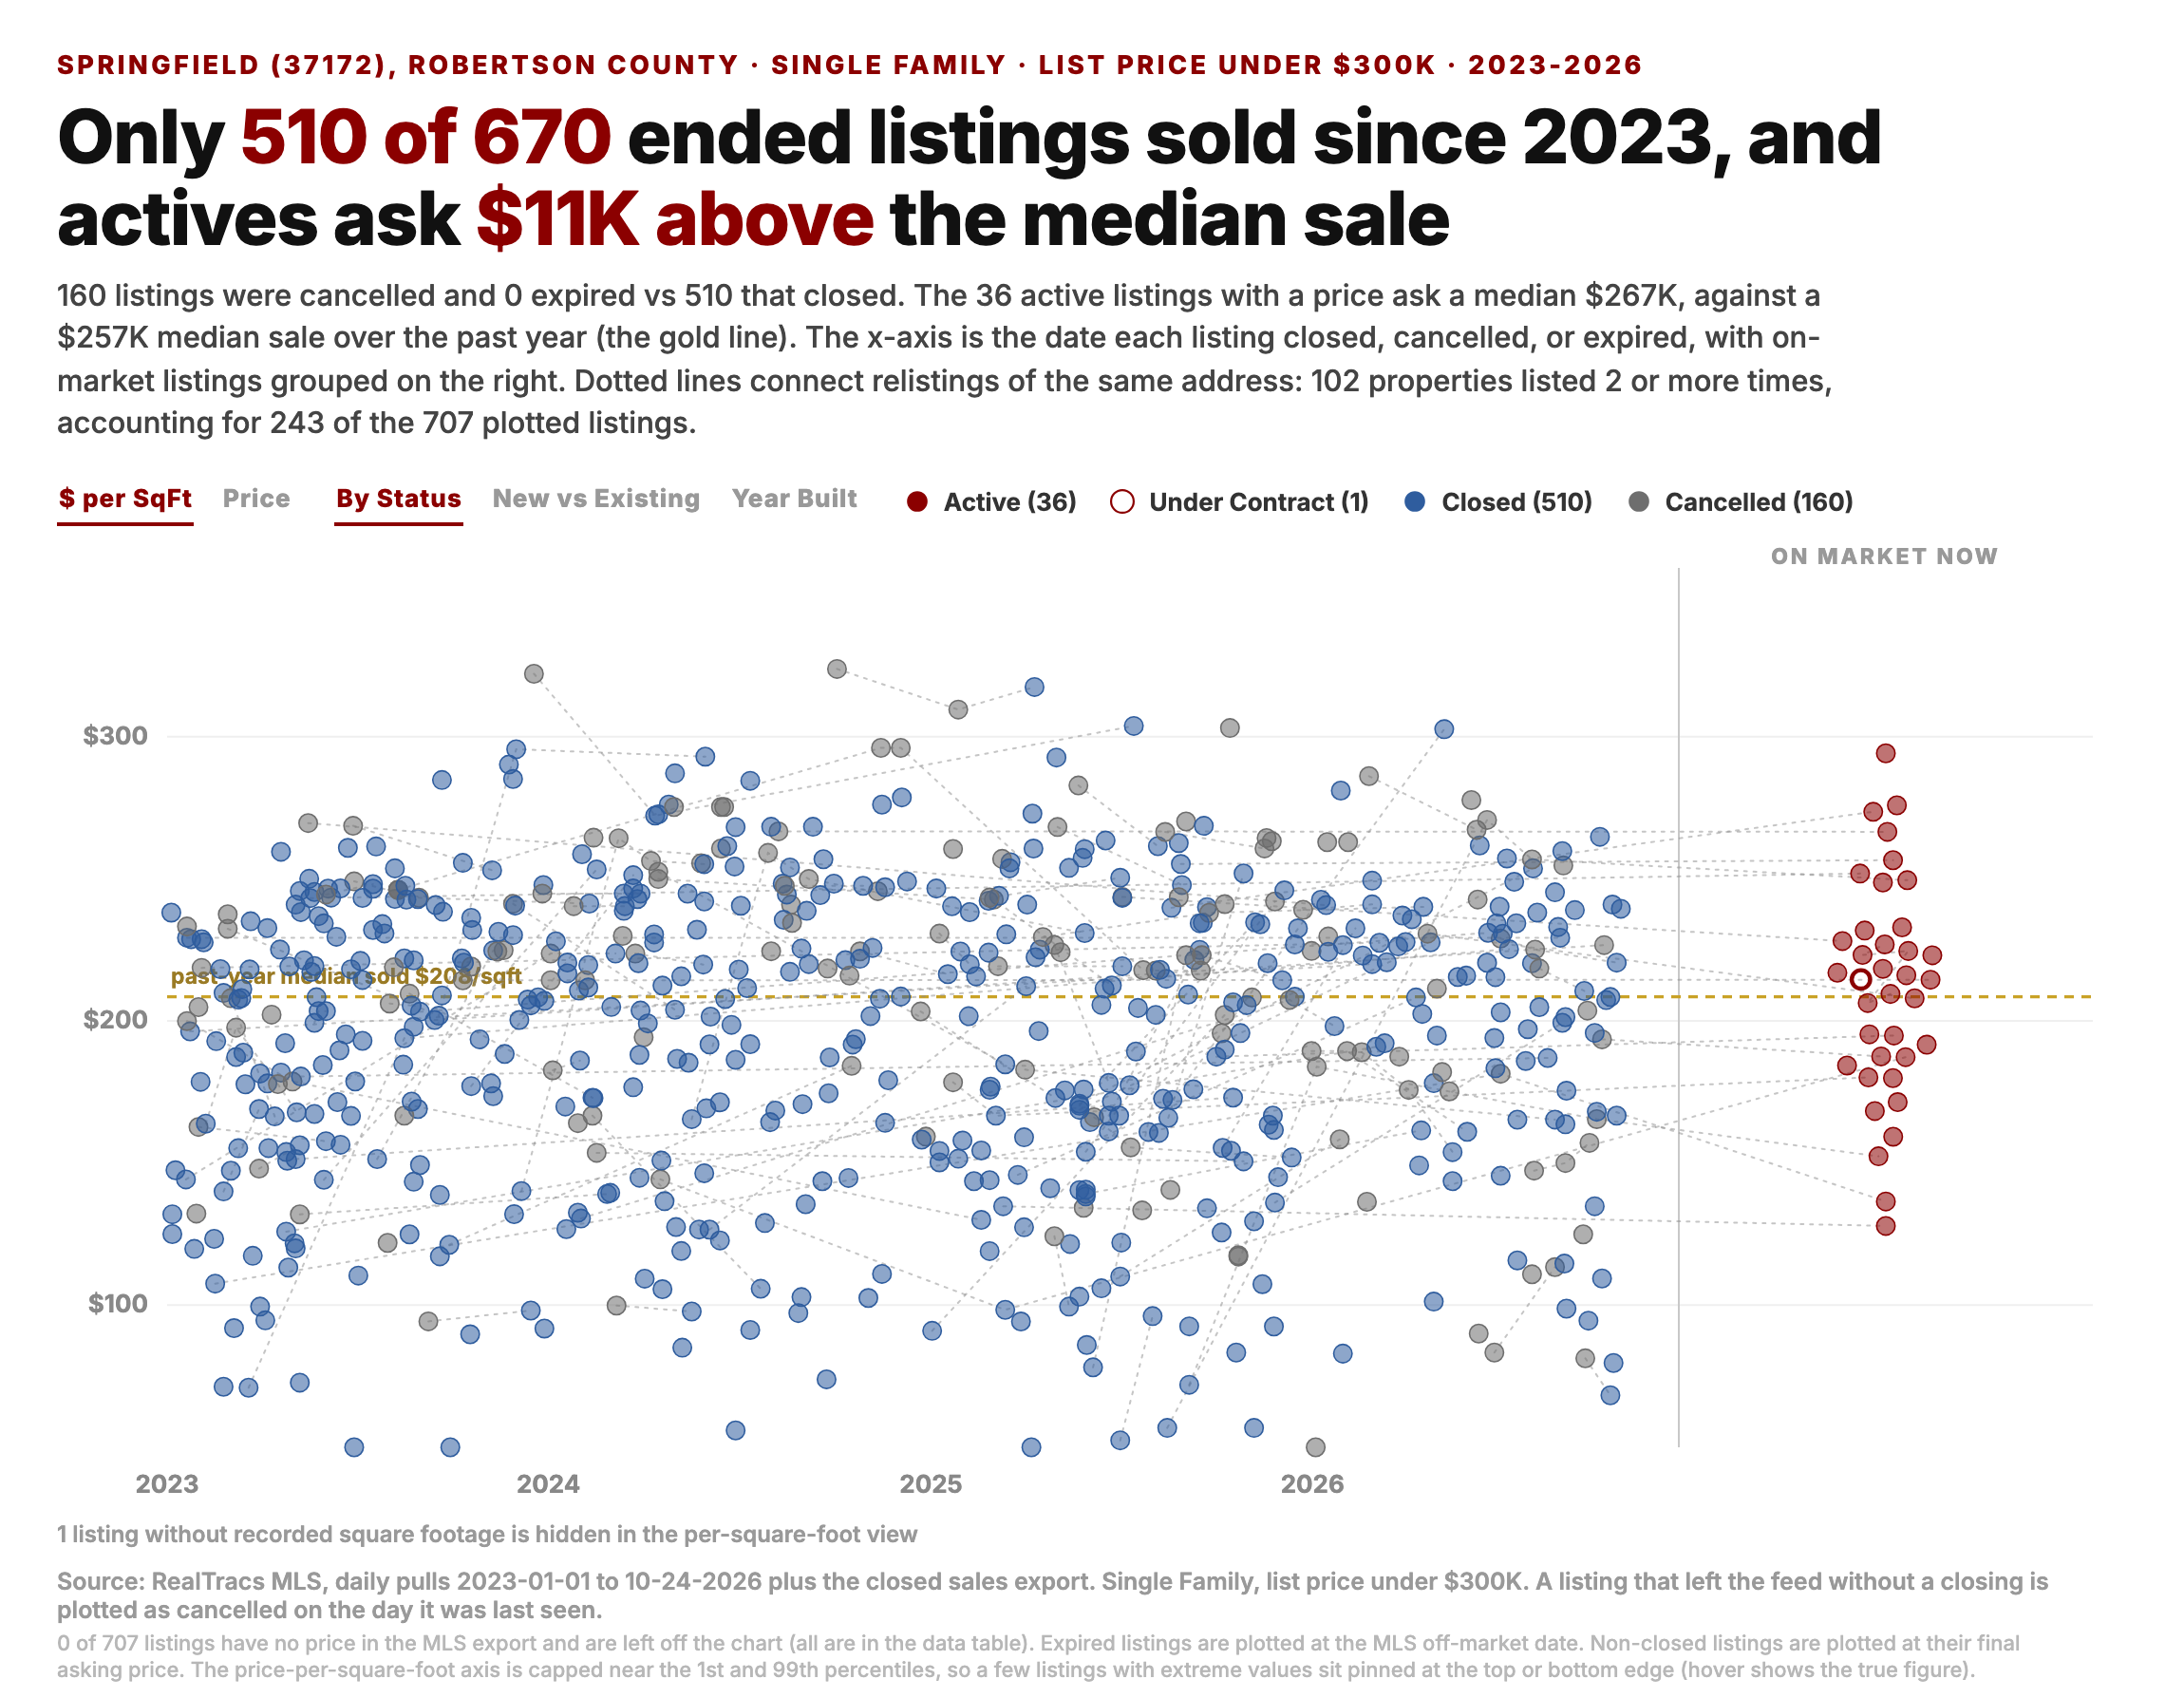
Springfield (37172), 36 listings. 510 of 670 listings that ended since 2023 sold, 76.1%, and 160 left the market without selling. In 2026 through October 24, 86 closed against 39 that did not (68.8% sold), from 121 and 36 (77.1%) over the same part of 2025. The 36 active listings with a price ask a median $267K against a $257K median sale over the past year, and the median active listing has been on the market 49 days. 76.1% is the highest share sold of the 7 zip codes.
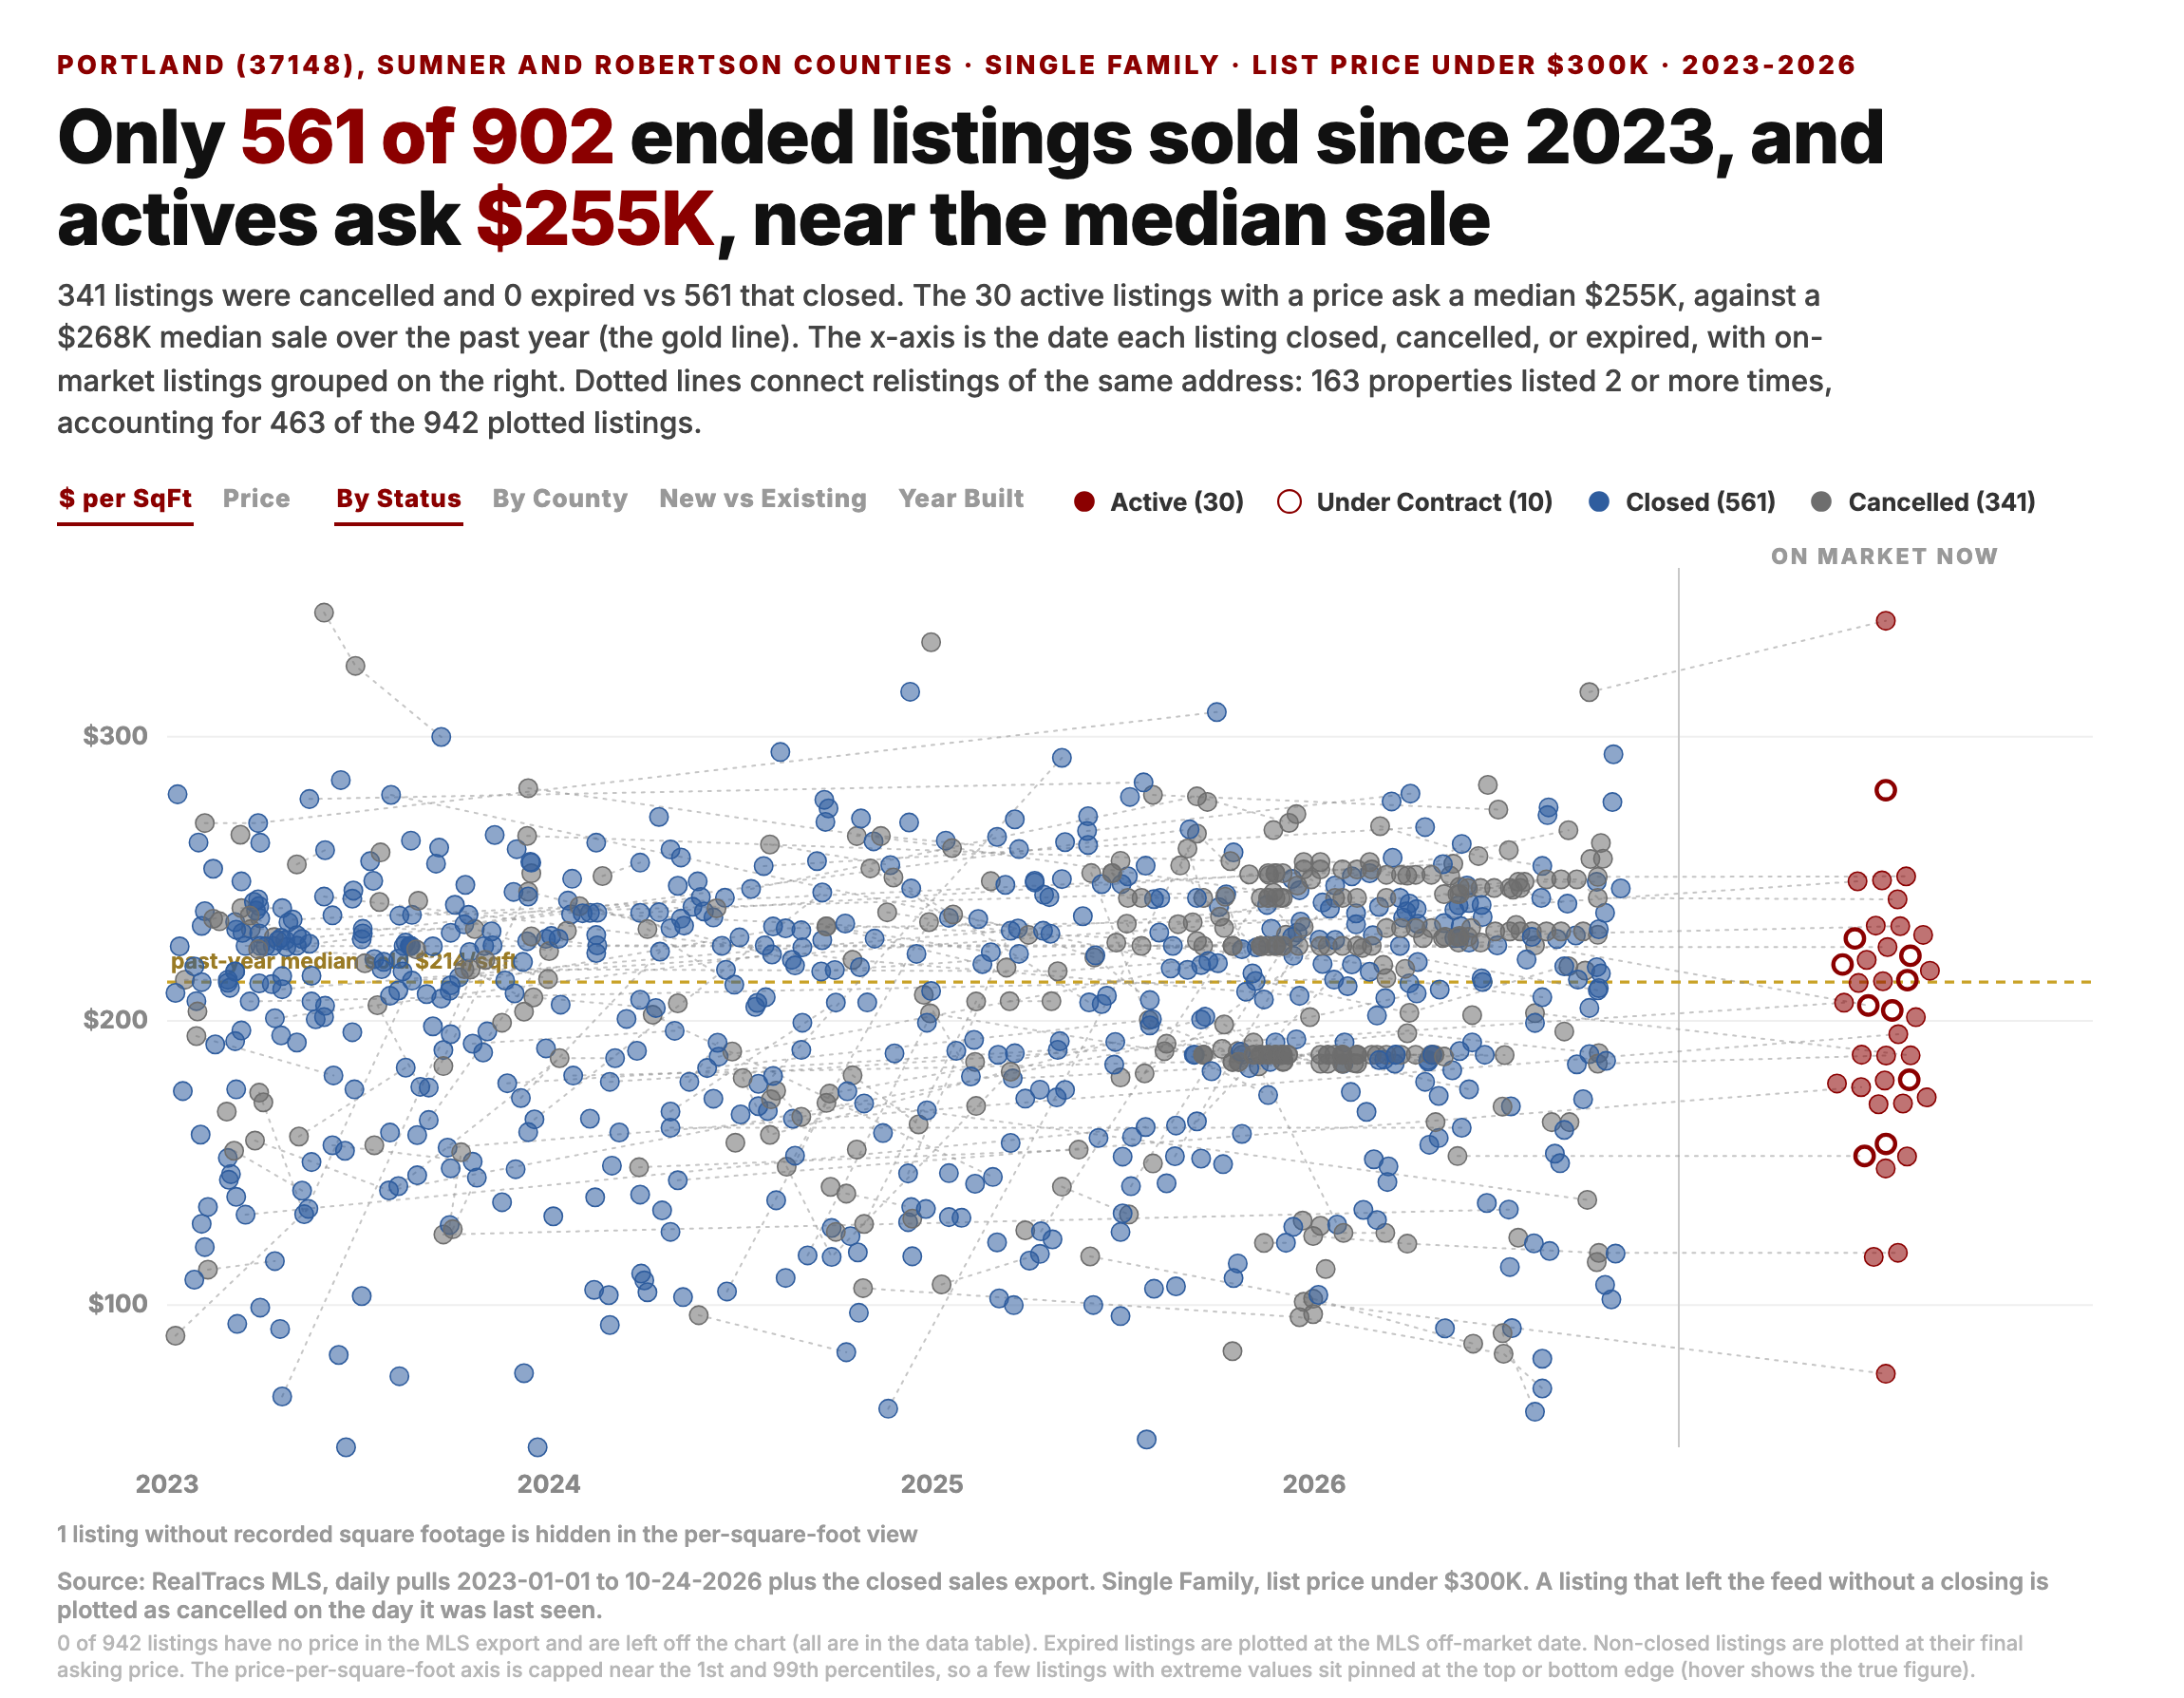
Portland (37148), 30 listings. 561 of 902 listings that ended since 2023 sold, 62.2%, and 341 left the market without selling. In 2026 through October 24, 124 closed against 128 that did not (49.2% sold), from 108 and 63 (63.2%) over the same part of 2025. The 30 active listings with a price ask a median $255K against a $268K median sale over the past year, and the median active listing has been on the market 26 days. 81 of the 128 listings that left the market this year are in one new construction subdivision, Parkside Point, where 44 homes have been listed 173 times since 2025, pulled from the MLS and listed again, and 24 of the 44 have closed. Without Parkside Point, the 2026 count for Portland is 108 closed against 47 that did not (69.7% sold), from 103 and 44 (70.1%) over the same part of 2025. The points at the same price per square foot across 2025 and 2026 in the chart are those listings.
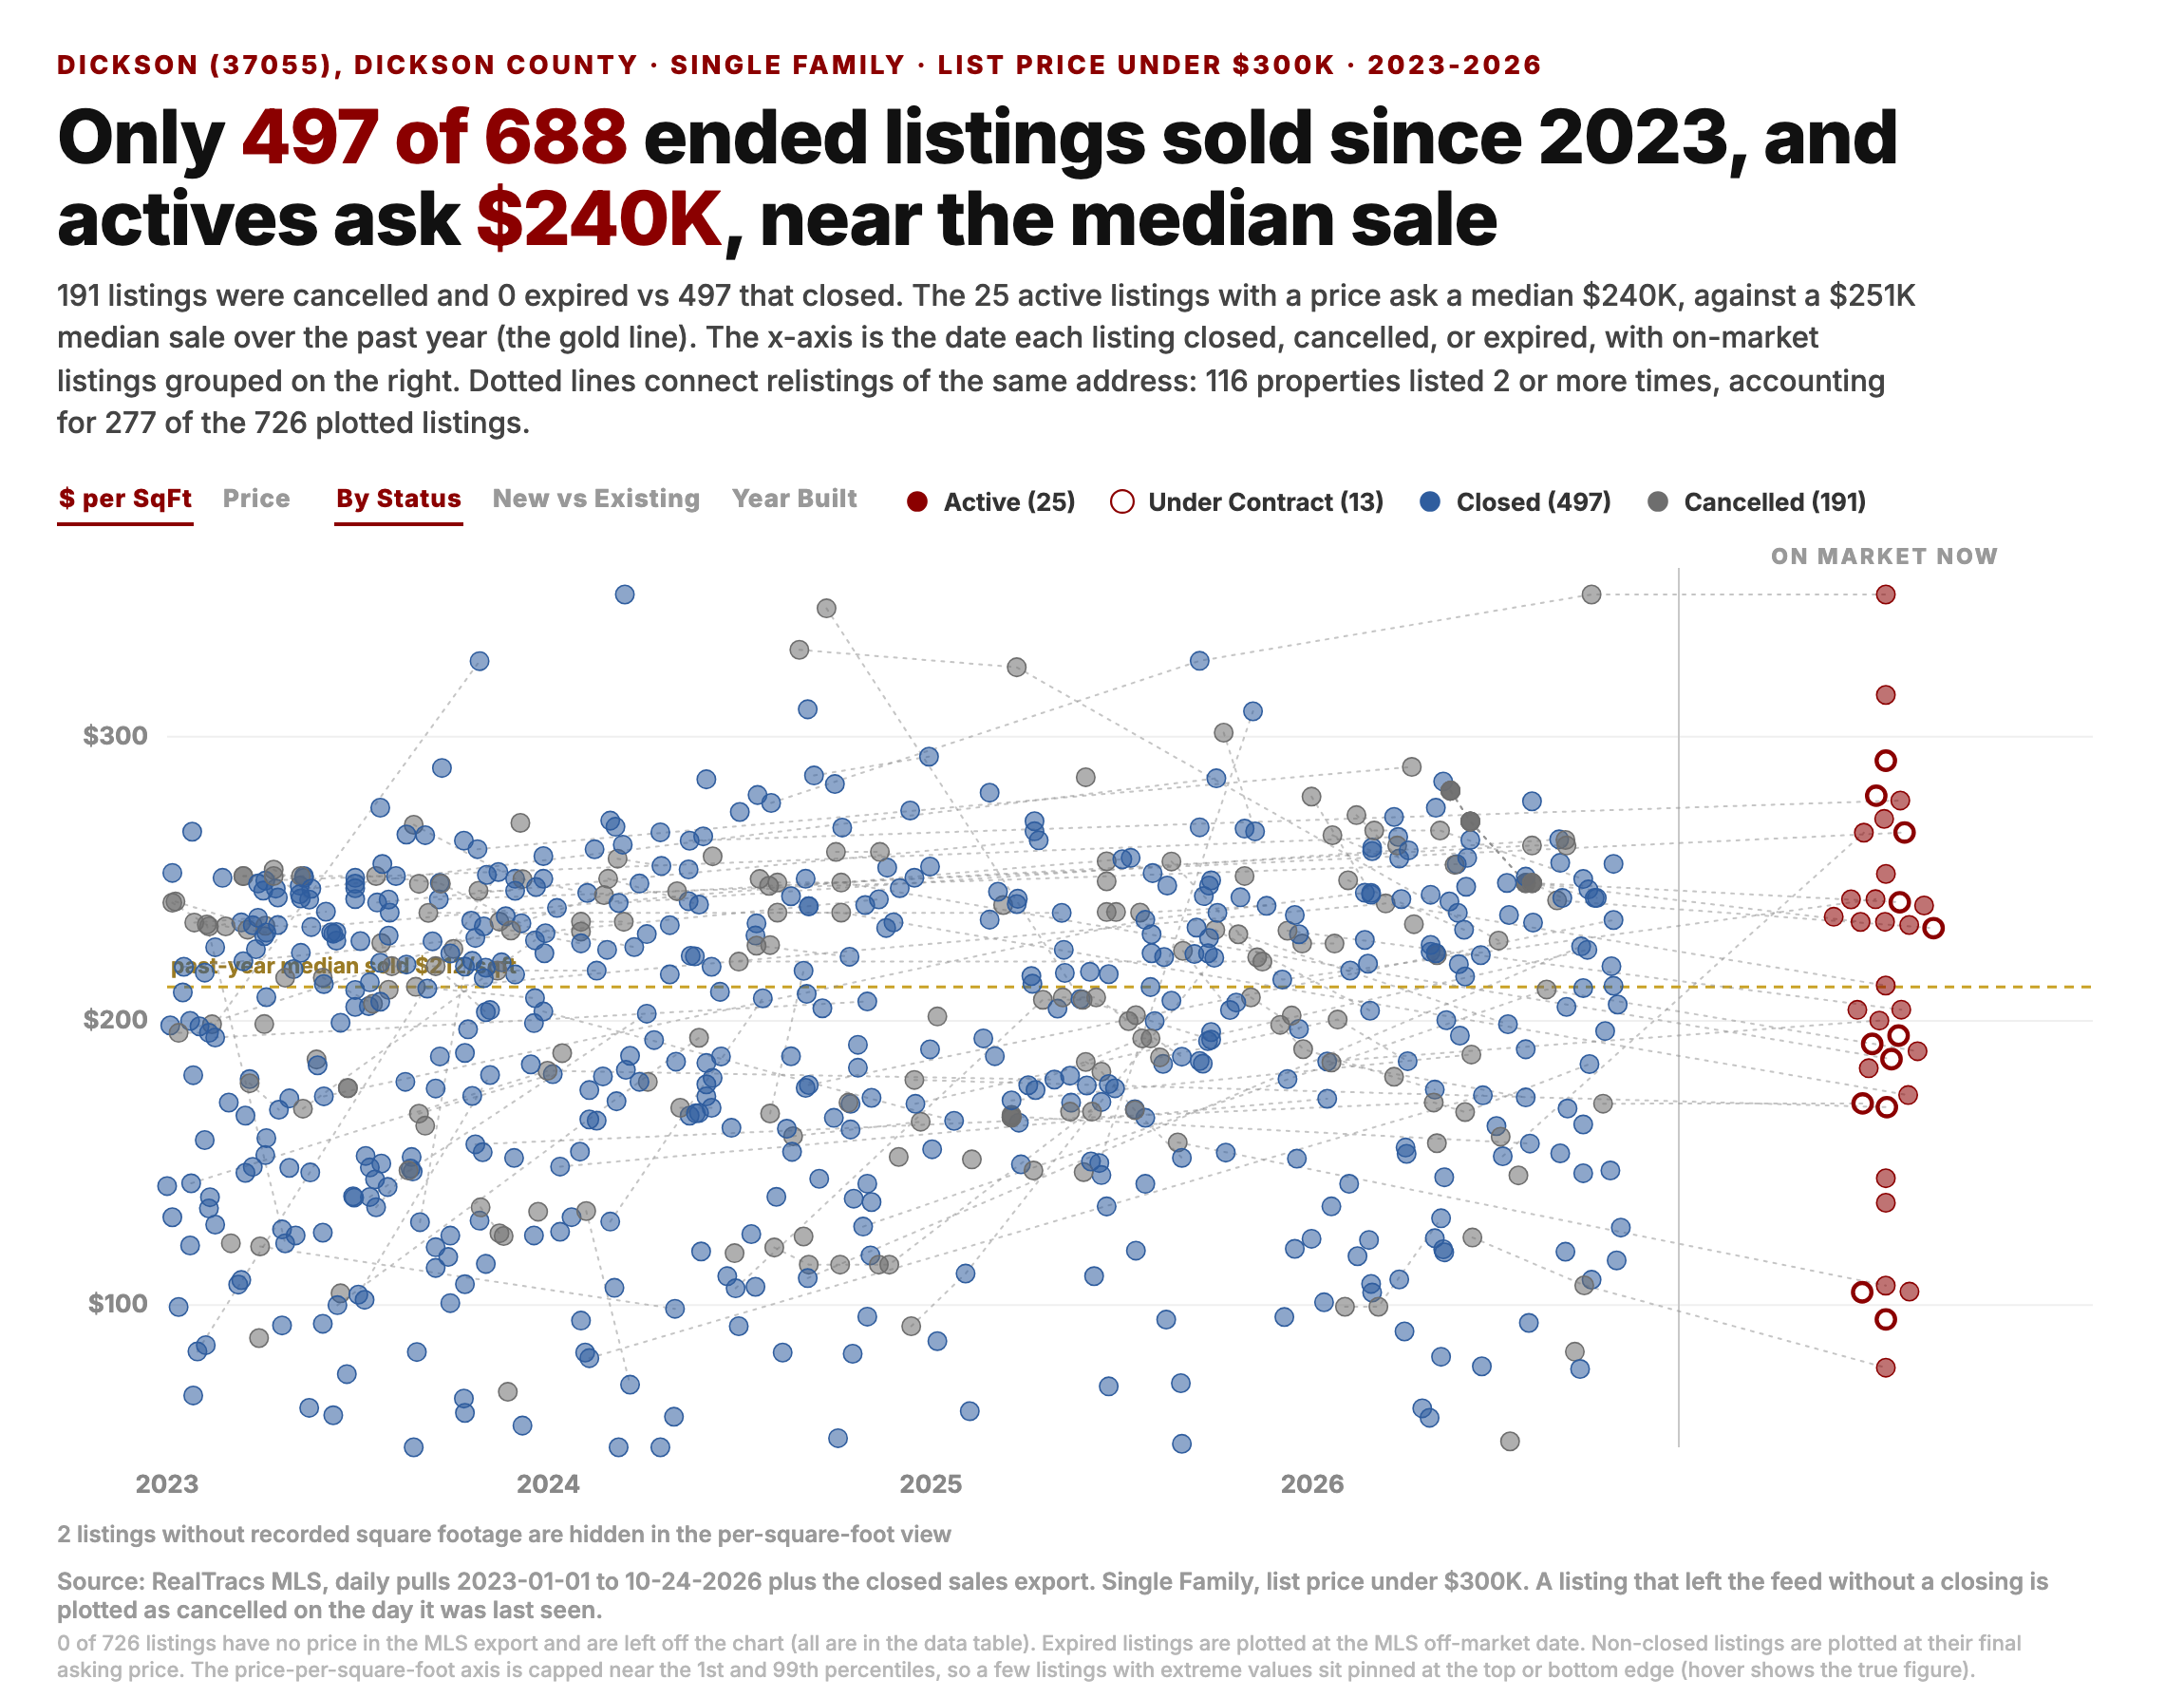
Dickson (37055), 25 listings. 497 of 688 listings that ended since 2023 sold, 72.2%, and 191 left the market without selling. In 2026 through October 24, 98 closed against 51 that did not (65.8% sold), from 85 and 36 (70.2%) over the same part of 2025. The 25 active listings with a price ask a median $240K against a $251K median sale over the past year, and the median active listing has been on the market 29 days. 19 of the 51 listings that left the market this year are new construction.
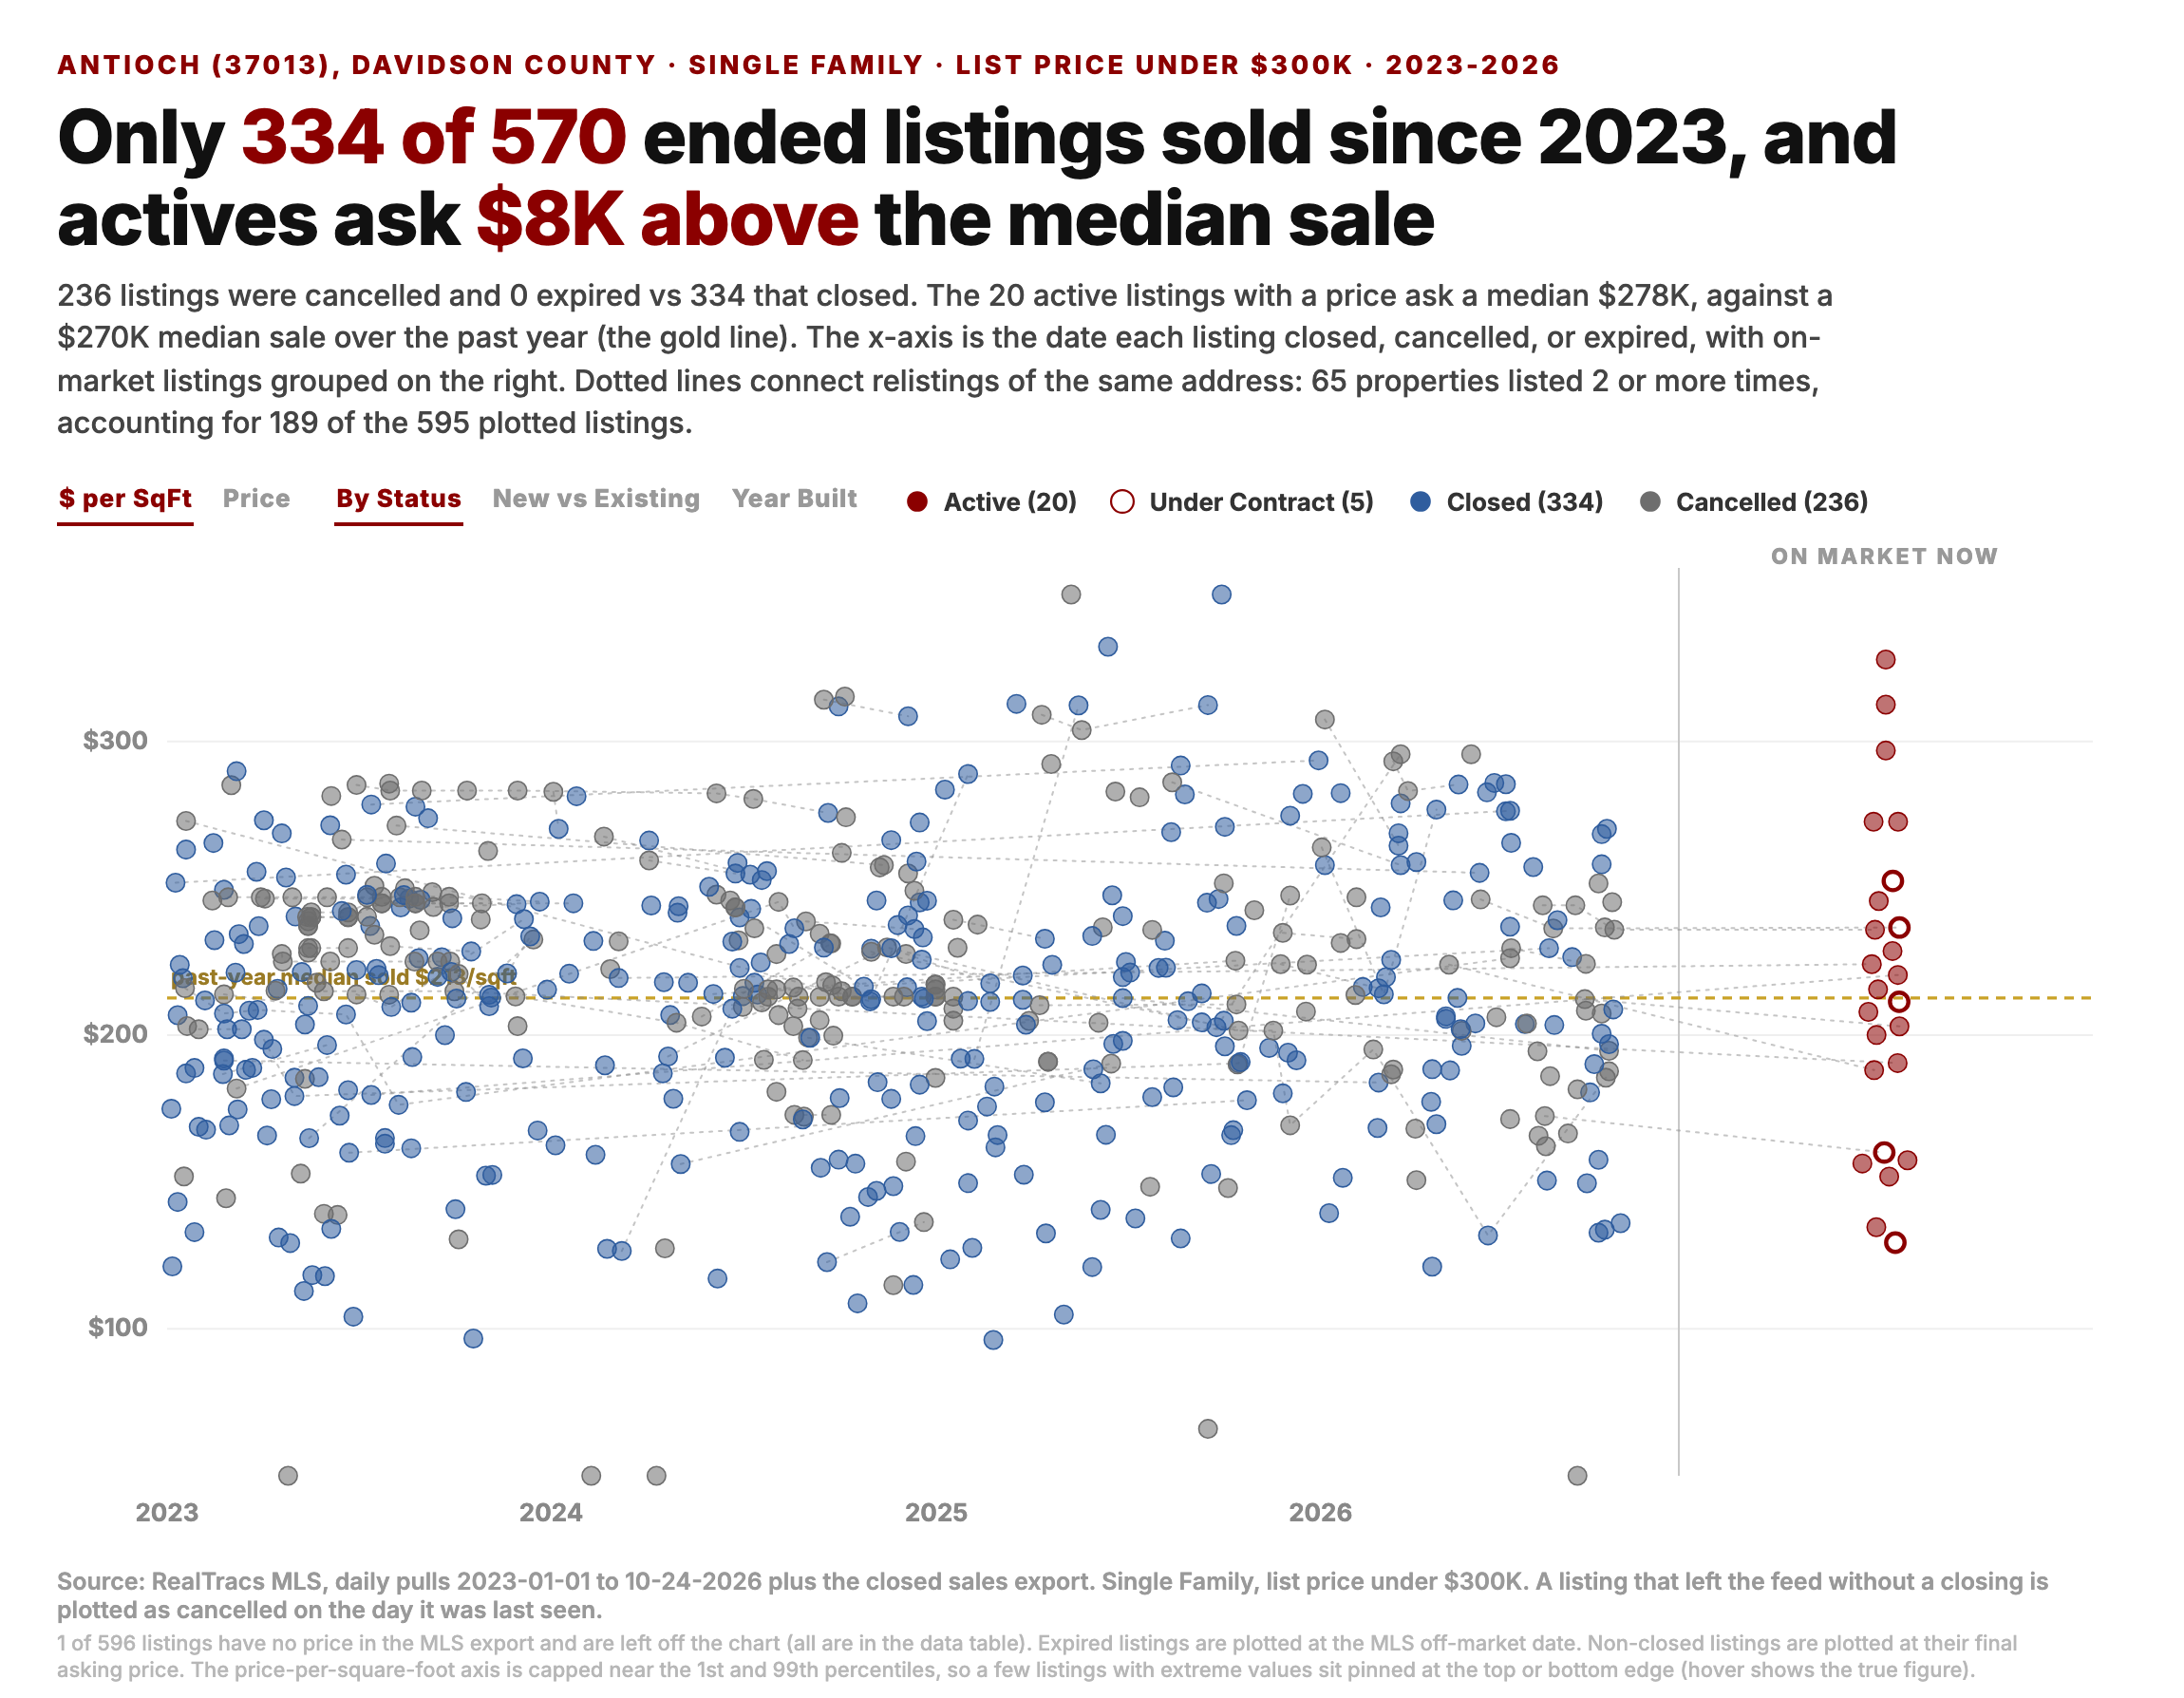
Antioch (37013), 21 listings. 334 of 570 listings that ended since 2023 sold, 58.6%, and 236 left the market without selling. In 2026 through October 24, 60 closed against 45 that did not (57.1% sold), from 71 and 29 (71.0%) over the same part of 2025. The 20 active listings with a price ask a median $278K against a $270K median sale over the past year, and the median active listing has been on the market 35 days. 58.6% is the lowest share sold of the 7 zip codes, and the 2026 share is 13.9 points below 2025, close to the 14.0 point decline for Portland.
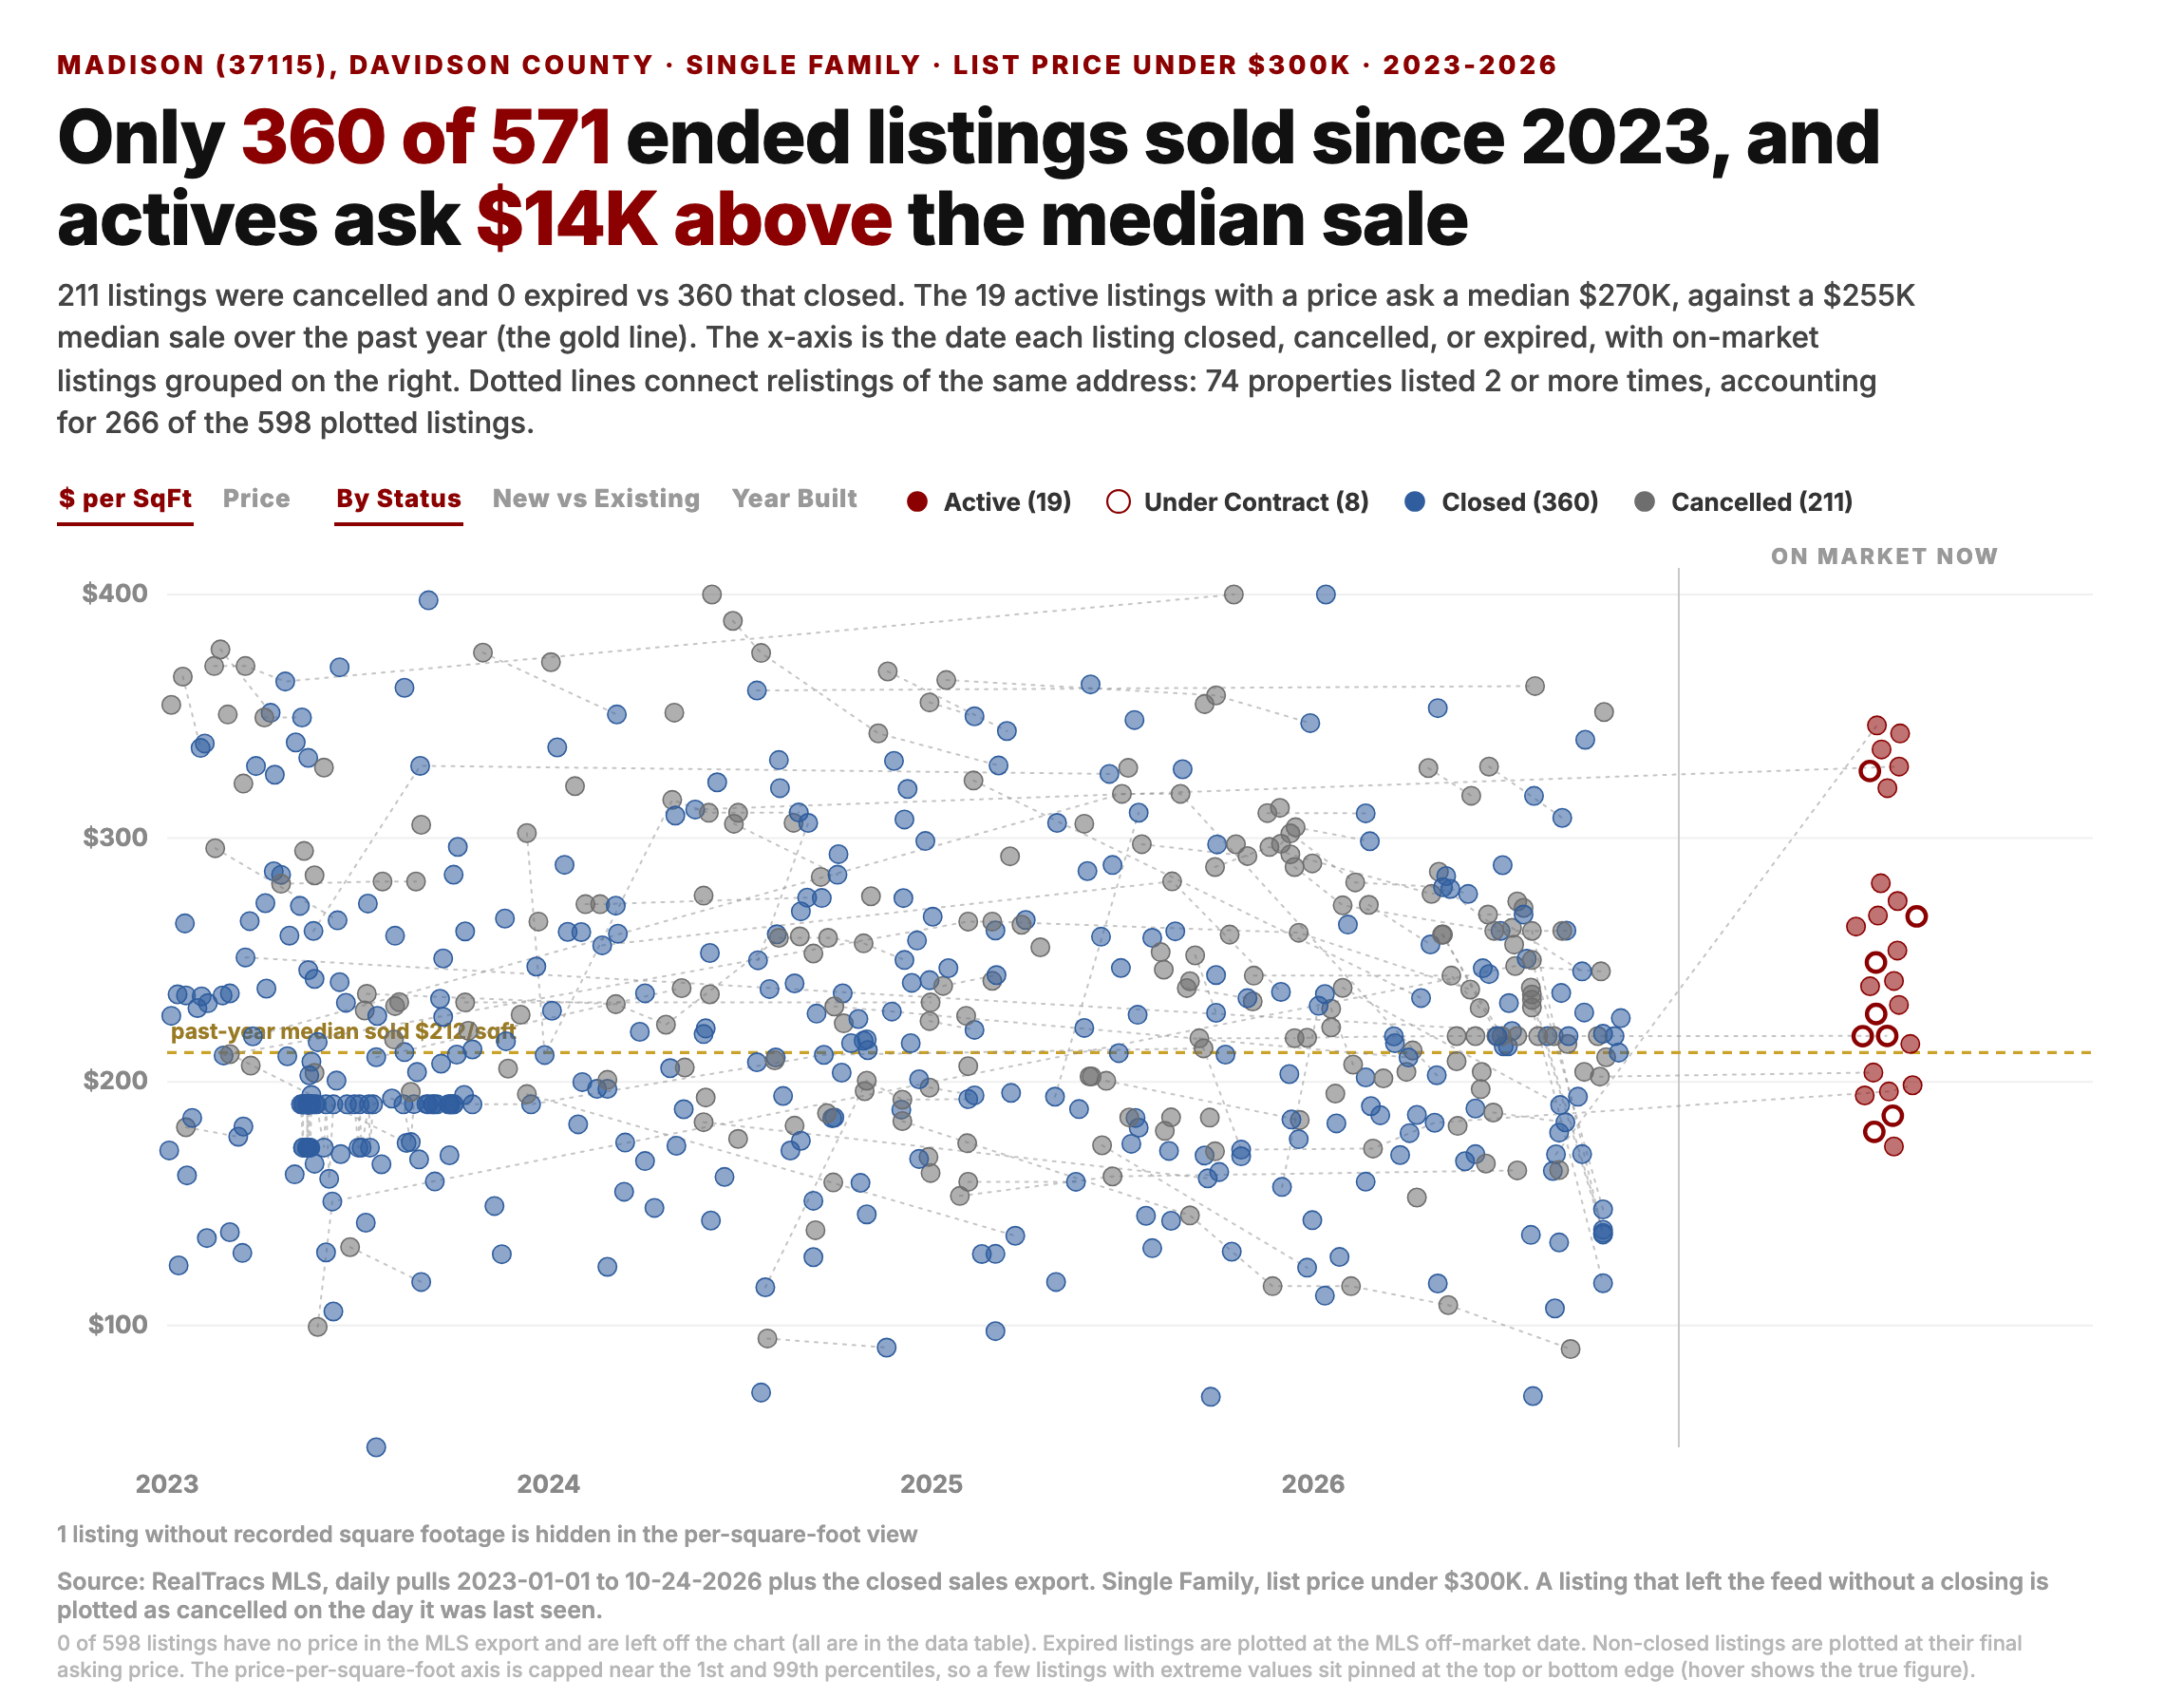
Madison (37115), 19 listings. 360 of 571 listings that ended since 2023 sold, 63.0%, and 211 left the market without selling. In 2026 through October 24, 72 closed against 63 that did not (53.3% sold), from 53 and 44 (54.6%) over the same part of 2025. The 19 active listings with a price ask a median $270K against a $255K median sale over the past year, and the median active listing has been on the market 22 days. The Burwood and Heritage Village areas of Madison have 11 of the 19 listings.
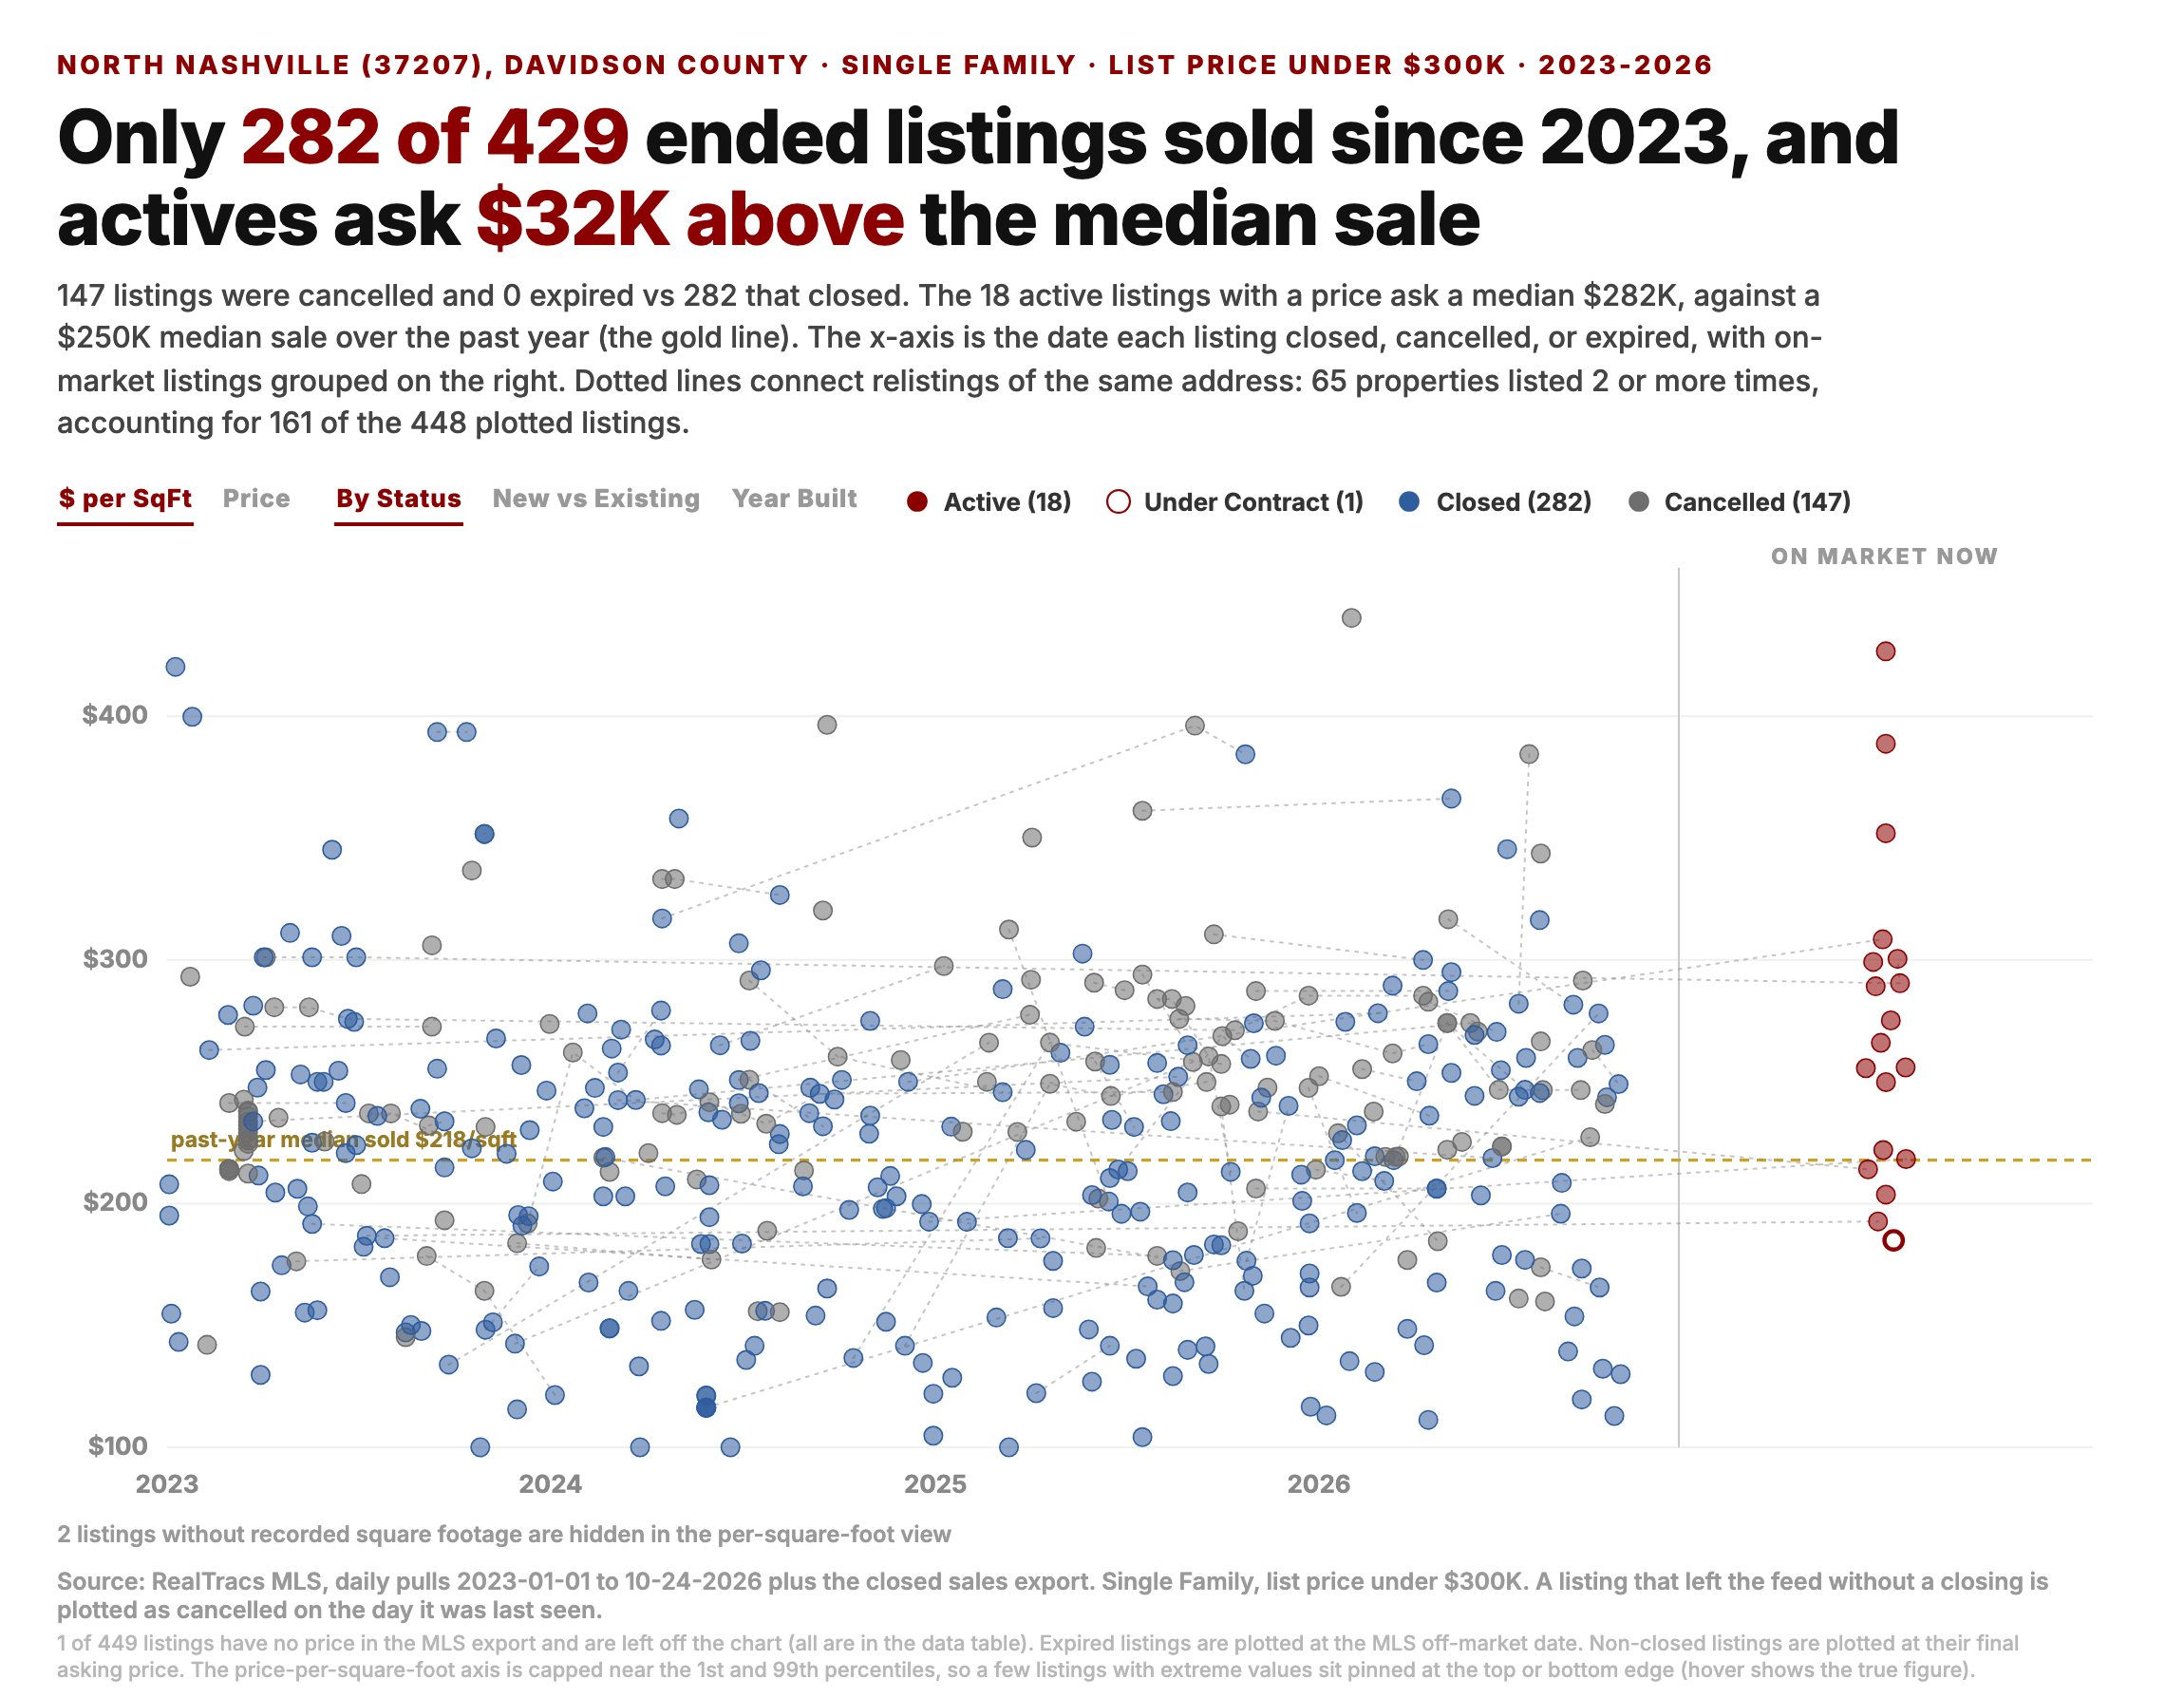
North Nashville (37207), 19 listings. 282 of 429 listings that ended since 2023 sold, 65.7%, and 147 left the market without selling. In 2026 through October 24, 61 closed against 36 that did not (62.9% sold), from 53 and 38 (58.2%) over the same part of 2025. The 18 active listings with a price ask a median $282K against a $250K median sale over the past year, and the median active listing has been on the market 112 days. The $32K gap between the median ask and the median sale is the largest of the 7 zip codes, and 112 days on the market is the most.
Adding it up
- 447 Single Family homes are listed under $300K, above every week of 2023, 2024 and 2025. 4 weeks ago the count was 418.
- 133 contracts in the band, 24.4% below last year and below all 3 prior years at the last 4 data points. With the contracts that already closed included, 160 against 209.
- 3.4 listings per contract in the band against 2.0 last year, the most in the 4 years of data.
- Davidson has 141 of the listings, from 93 last year and 67 in 2023. The rise is in Antioch, 37207 and Old Hickory.
- 332 of the 447 are detached homes, up from 281. 49.9% of the band has a price cut.
- Closings in the band have not fallen: September 205 against 193, January to September +6.7%.
- On the NRD neighborhood map the listings fall in 215 of 2,401 areas. West 17th in Columbia has 11, the most. Davidson's are in Madison, Old Hickory, Donelson, 37217, Antioch and North Nashville.
- In the 7 zip codes with the most of these listings, 3,388 of 5,091 listings that ended since 2023 sold, 66.5%. The share sold in 2026 is below 2025 in 5 of the 7.
For a buyer under $300K, there are more Single Family homes to pick from than at any point in the last 4 years, half of them have already cut price, and a third of them are in Davidson County. The band's contracts fell 24% with the mortgage rate between 7.3% and 7.6% for the last 4 weeks, so the buyers who were in the band in September are not there in October. For a seller in the band, there are 3.4 listings per contract against 2 last year, and the median listing has been on the market 44 days.
What to watch: the band's listing count fell from late October to the end of December in 2025 (358 to 323) and in 2023 (263 to 246), and rose in 2024 (272 to 282). Last year it was 376 on November 22. I expect the count to be above 400 at the November 21 data point, which would be the most for late November in the 4 years of data. On the contract side, the 14 day count including closed contracts was 69 against 86 on October 24. If the 31 day count at the November 21 data point is within 10% of last year's 153, the October decline was a 4 week pause. If it is 20% or more below, the band is at a lower level of demand at a 7.3% rate. I also expect the band's 31 day closed count to be below last year by the December 19 data point, since that is when the October contracts close.
Data through 10-24-2026, Greater Nashville (9 counties: Davidson, Williamson, Rutherford, Wilson, Sumner, Maury, Dickson, Cheatham, Robertson), Single Family only, with condos under $300K broken out on their own in part 1. Active listings are a count on the day and contracts are a 31 day count, each weekly data point at the same week each year. Price bands use the list price for active listings and contracts and the sales price for closings. The 31 day and 14 day numbers under chart 3, the home types under chart 5 and the Davidson numbers are from the daily MLS pulls on 09-26 and 10-24-2026 and the same days of the week in 2023, 2024 and 2025. Whole month closings are from the closed sales pull with data through 10-23-2026. The maps in part 7 use the NRD map's neighborhood areas, with each listing put in its area by its location in the MLS; the street map under them is OpenStreetMap, and each neighborhood chart is the NRD map's own chart as of 10-24-2026. The 7 zip code charts under part 8 are built from the daily MLS pulls from 01-01-2023 to 10-24-2026 plus the closed sales pull; a listing that left the feed without a closing is shown as cancelled on the day it was last seen, and listings that left the feed in the last 14 days are left out until their outcome is known. Mortgage rates are the Mortgage News Daily 30 year fixed. Source: RealTracs MLS.