1,856 Single Family homes went under contract in Greater Nashville in the last 31 days, against 2,234 at the same week of 2025 (-16.9%), 2,247 in 2024 (-17.4%) and 2,061 in 2023 (-9.9%). There are 9,750 active Single Family listings, so there are 5.25 active listings for every contract. That is the highest of any week in the 4 years of data. The condo number is 7.85, also the highest in the 4 years of data.
The October 3 post covered the contract decline for all property types and the rise in mortgage rates. The Mortgage News Daily 30 year rate was 7.61% on October 5, the highest of 2026 and the highest since November 1, 2023. 7 charts below cover active listings per contract for Single Family, the contract count, how fast it fell, resale vs new builds, the counties, the price bands, and condos.
1. How many active Single Family listings are there per contract?
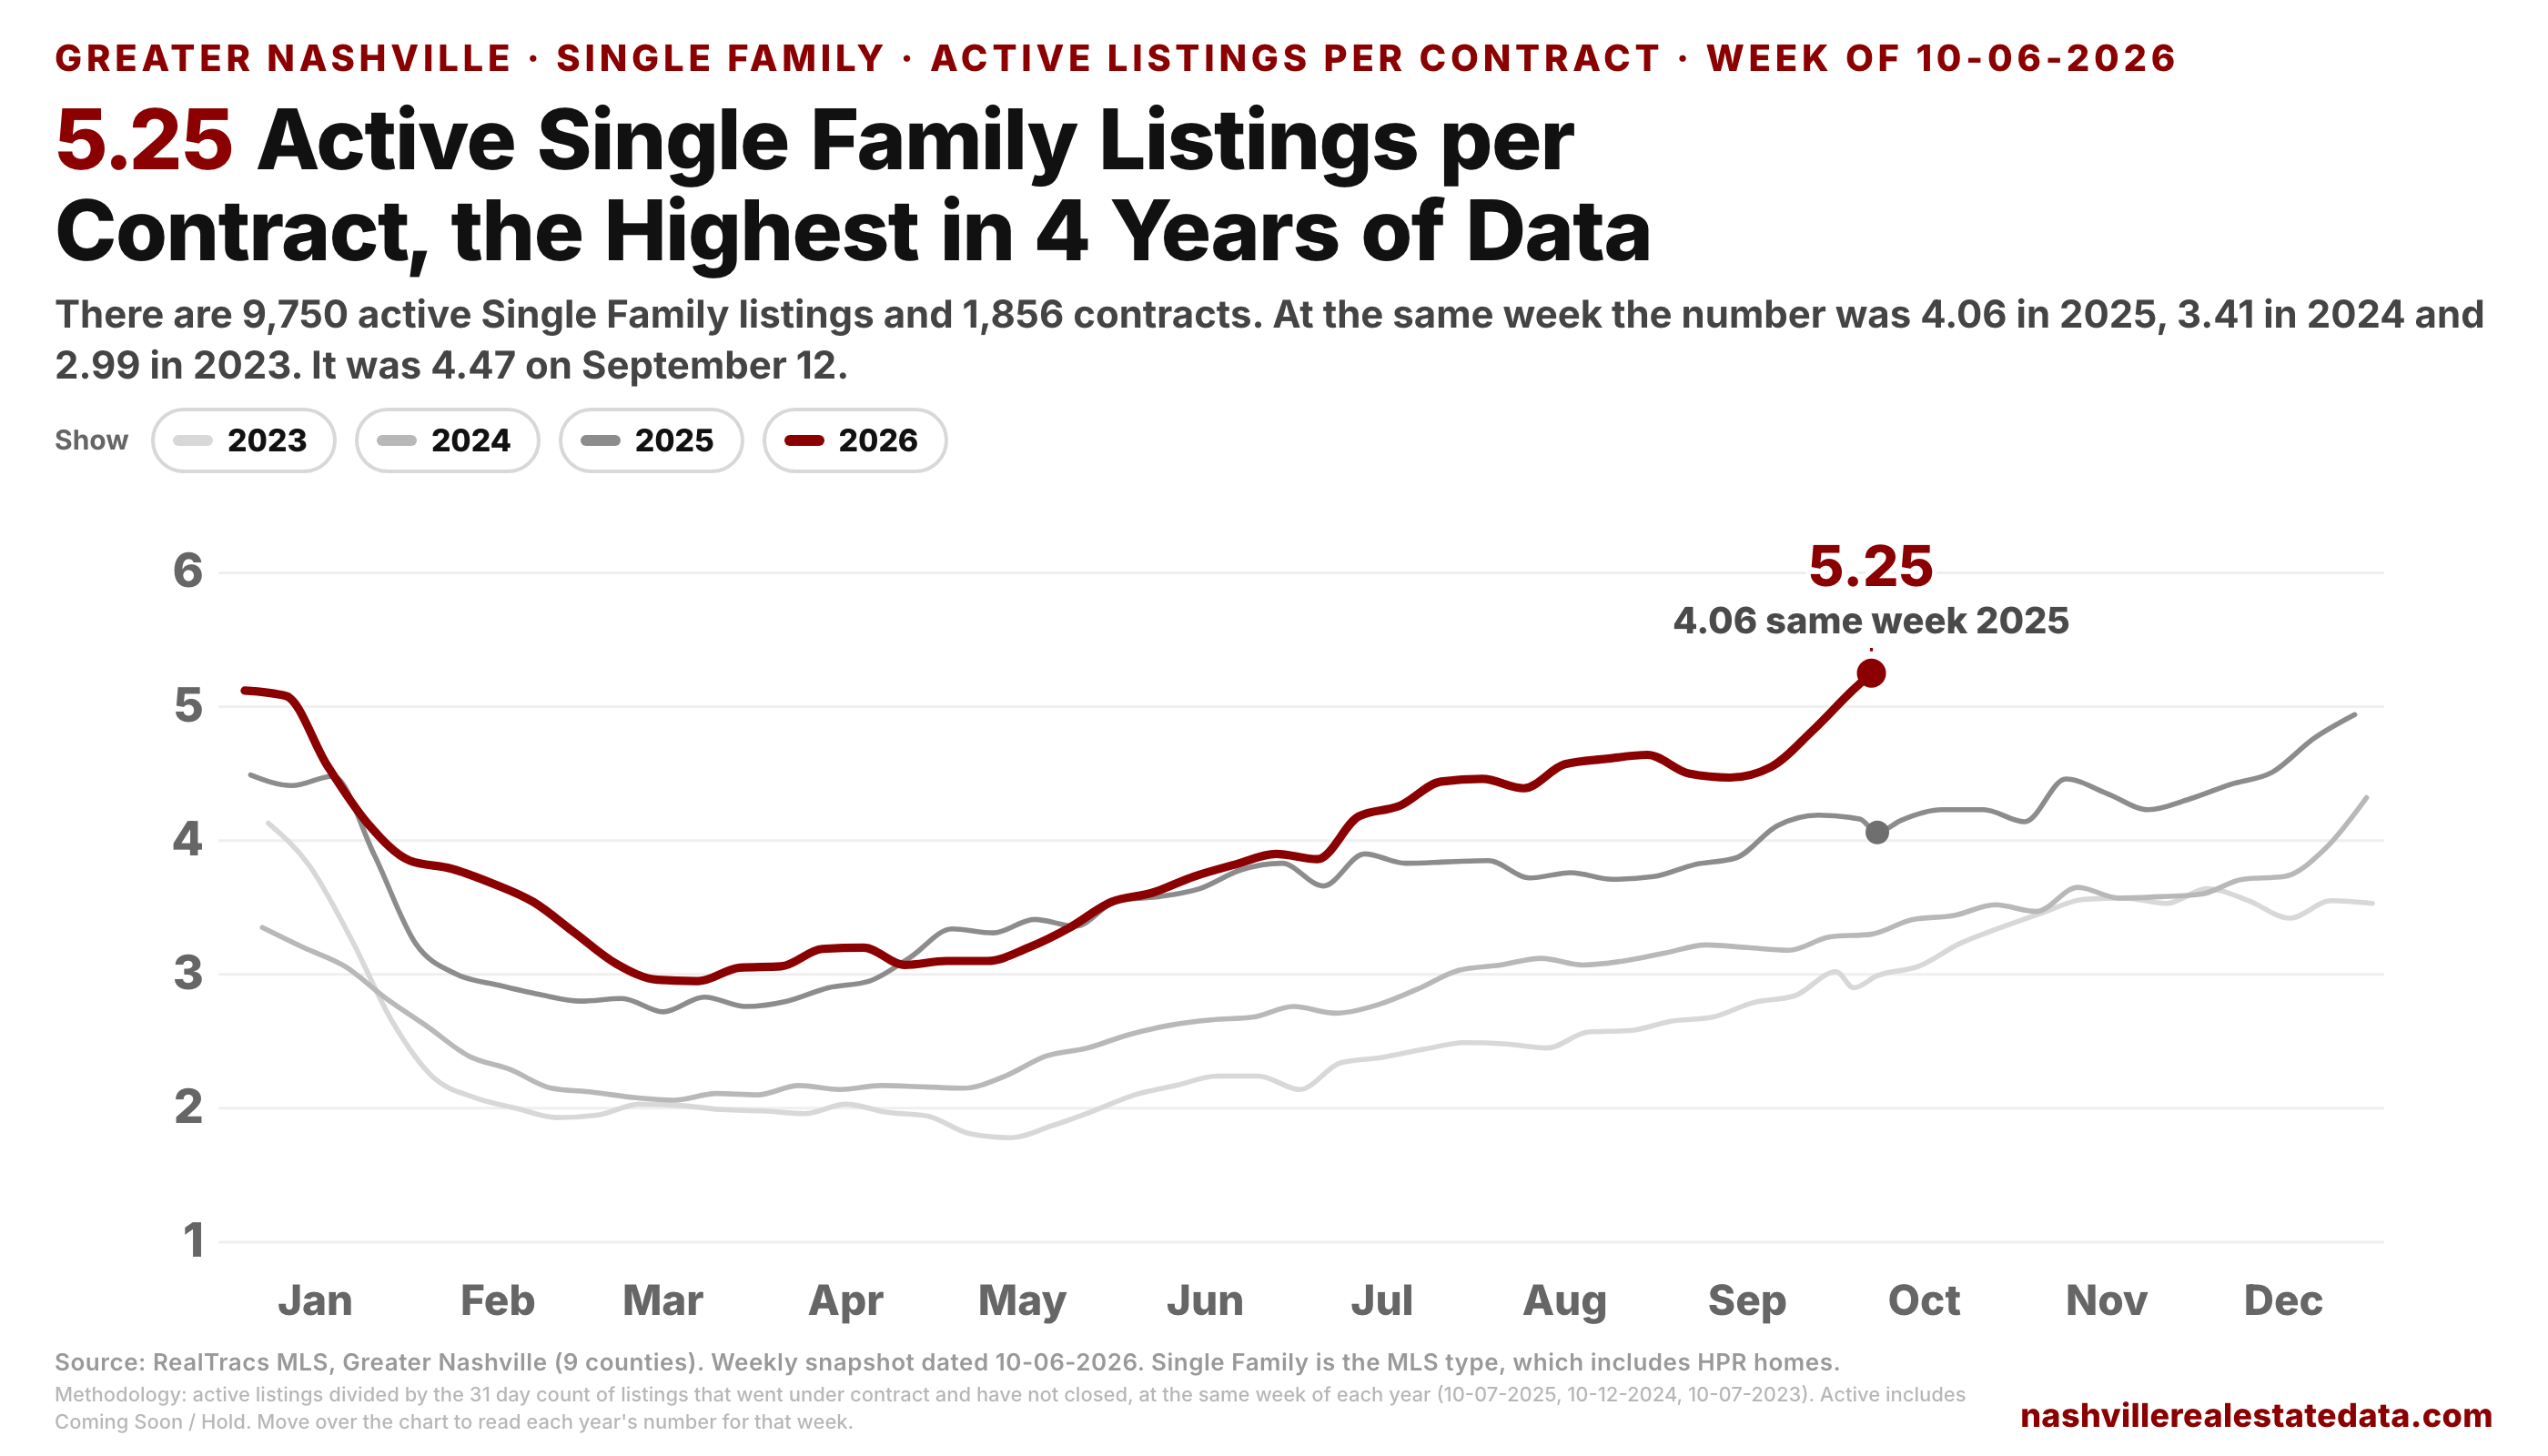
5.25. At the same week the number was 4.06 in 2025, 3.41 in 2024 and 2.99 in 2023. It was 4.47 on September 12 and 5.13 on October 3.
The number is highest in late December and early January, when contract volume is at its low for the year. The high for 2023 was 4.13, the high for 2024 was 4.32 and the high for 2025 was 4.94, on December 27. This year started at 5.12 on January 3 and 5.08 on January 10. Those 2 weeks and the last 2 data points are the only weeks above 5 in the 4 years of data, and this week is above both of the January weeks.
2. How low is the Single Family contract count?
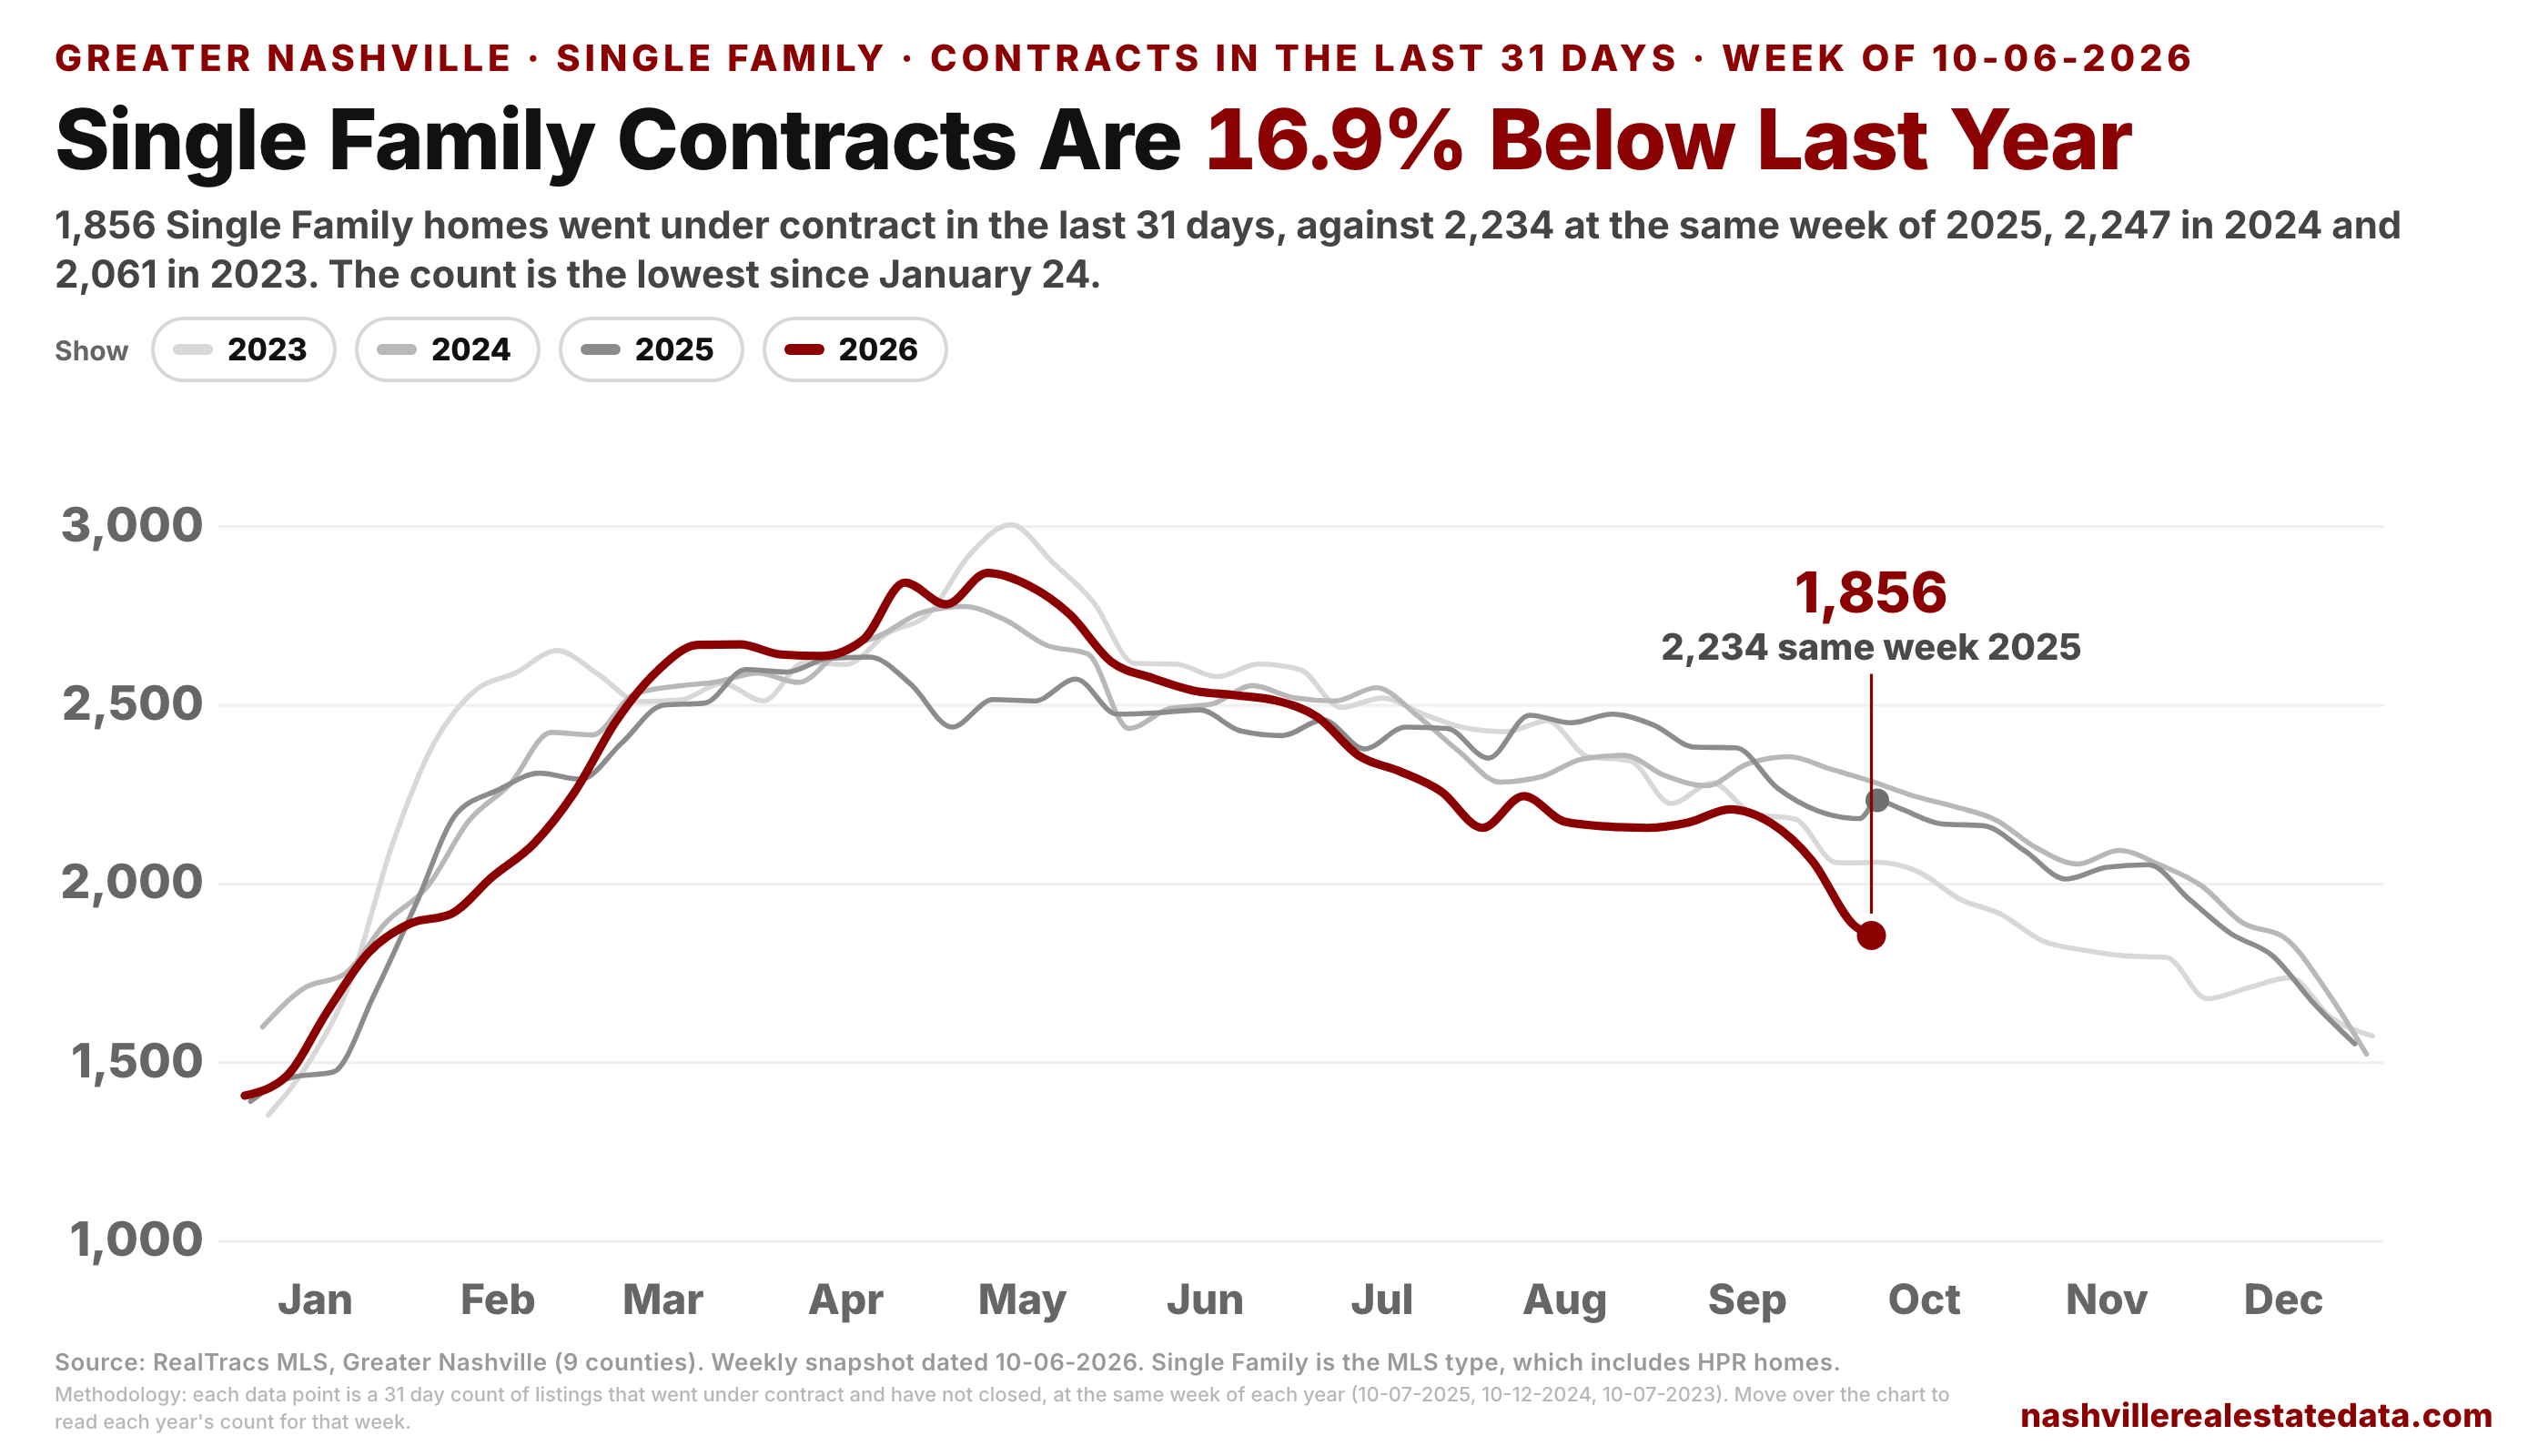
1,856 is the lowest count since January 24. It is 378 contracts below last year and 391 below 2024, and the 16.9% decline vs last year is the largest of any week in 2026. The count is also 205 below 2023, when the mortgage rate was 7.81% at this week. The rate was 7.61% on October 5, against 6.38% at this week of 2025.
The weekly count only includes contracts that have not closed yet. With the contracts from the last 31 days that already closed added in, the total is 2,188, against 2,578 last year (-15.1%), 2,556 in 2024 (-14.4%) and 2,371 in 2023 (-7.7%). Contracts from the last 14 days are 988, against 1,231 last year (-19.7%), 1,149 in 2024 and 1,061 in 2023.
3. Did the number rise because of listings or contracts?
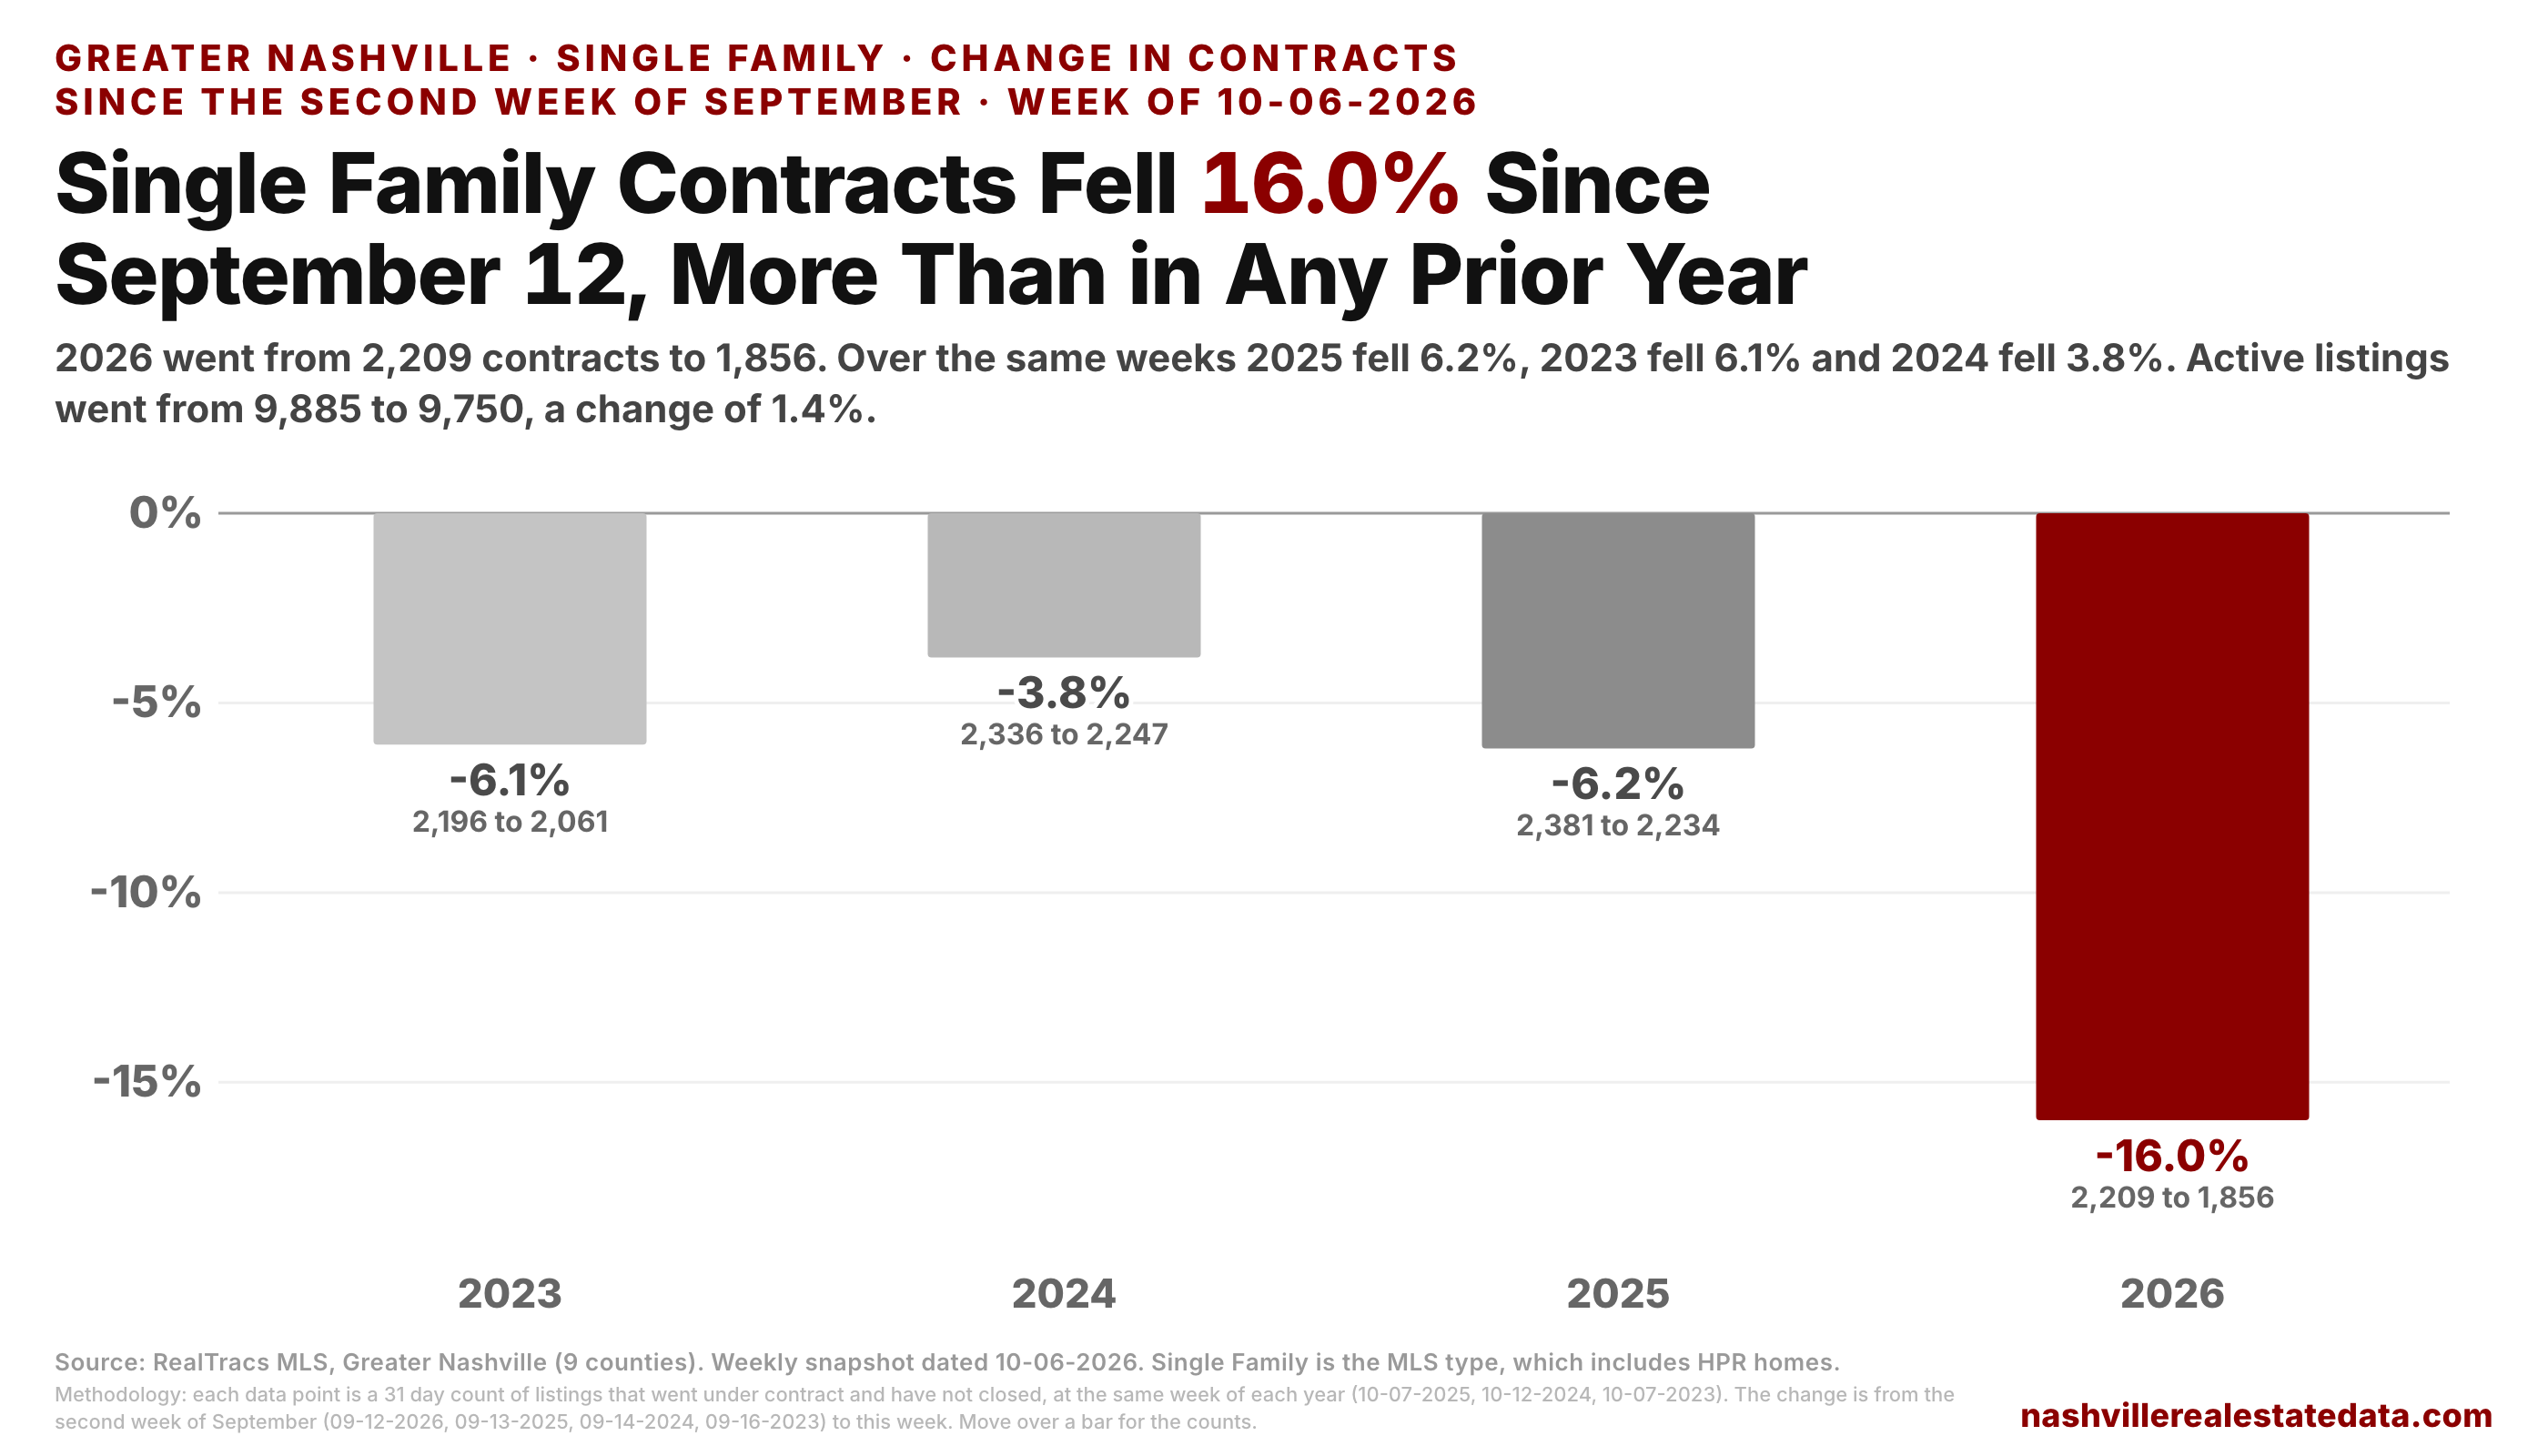
Contracts. Since September 12 the Single Family contract count went from 2,209 to 1,856, a decline of 16.0%. Over the same weeks 2025 fell 6.2%, 2023 fell 6.1% and 2024 fell 3.8%. Active listings went from 9,885 to 9,750, a decline of 1.4%. With the September 12 contract count and today's active listings, the number would be 4.41.
Active listings are still 7.5% above last year (9,068), 27.1% above 2024 and 58.0% above 2023. There are more listings than in any of the three prior years and fewer buyers who can pay at current prices and mortgage rates.
4. Is the number higher for resale or for new builds?
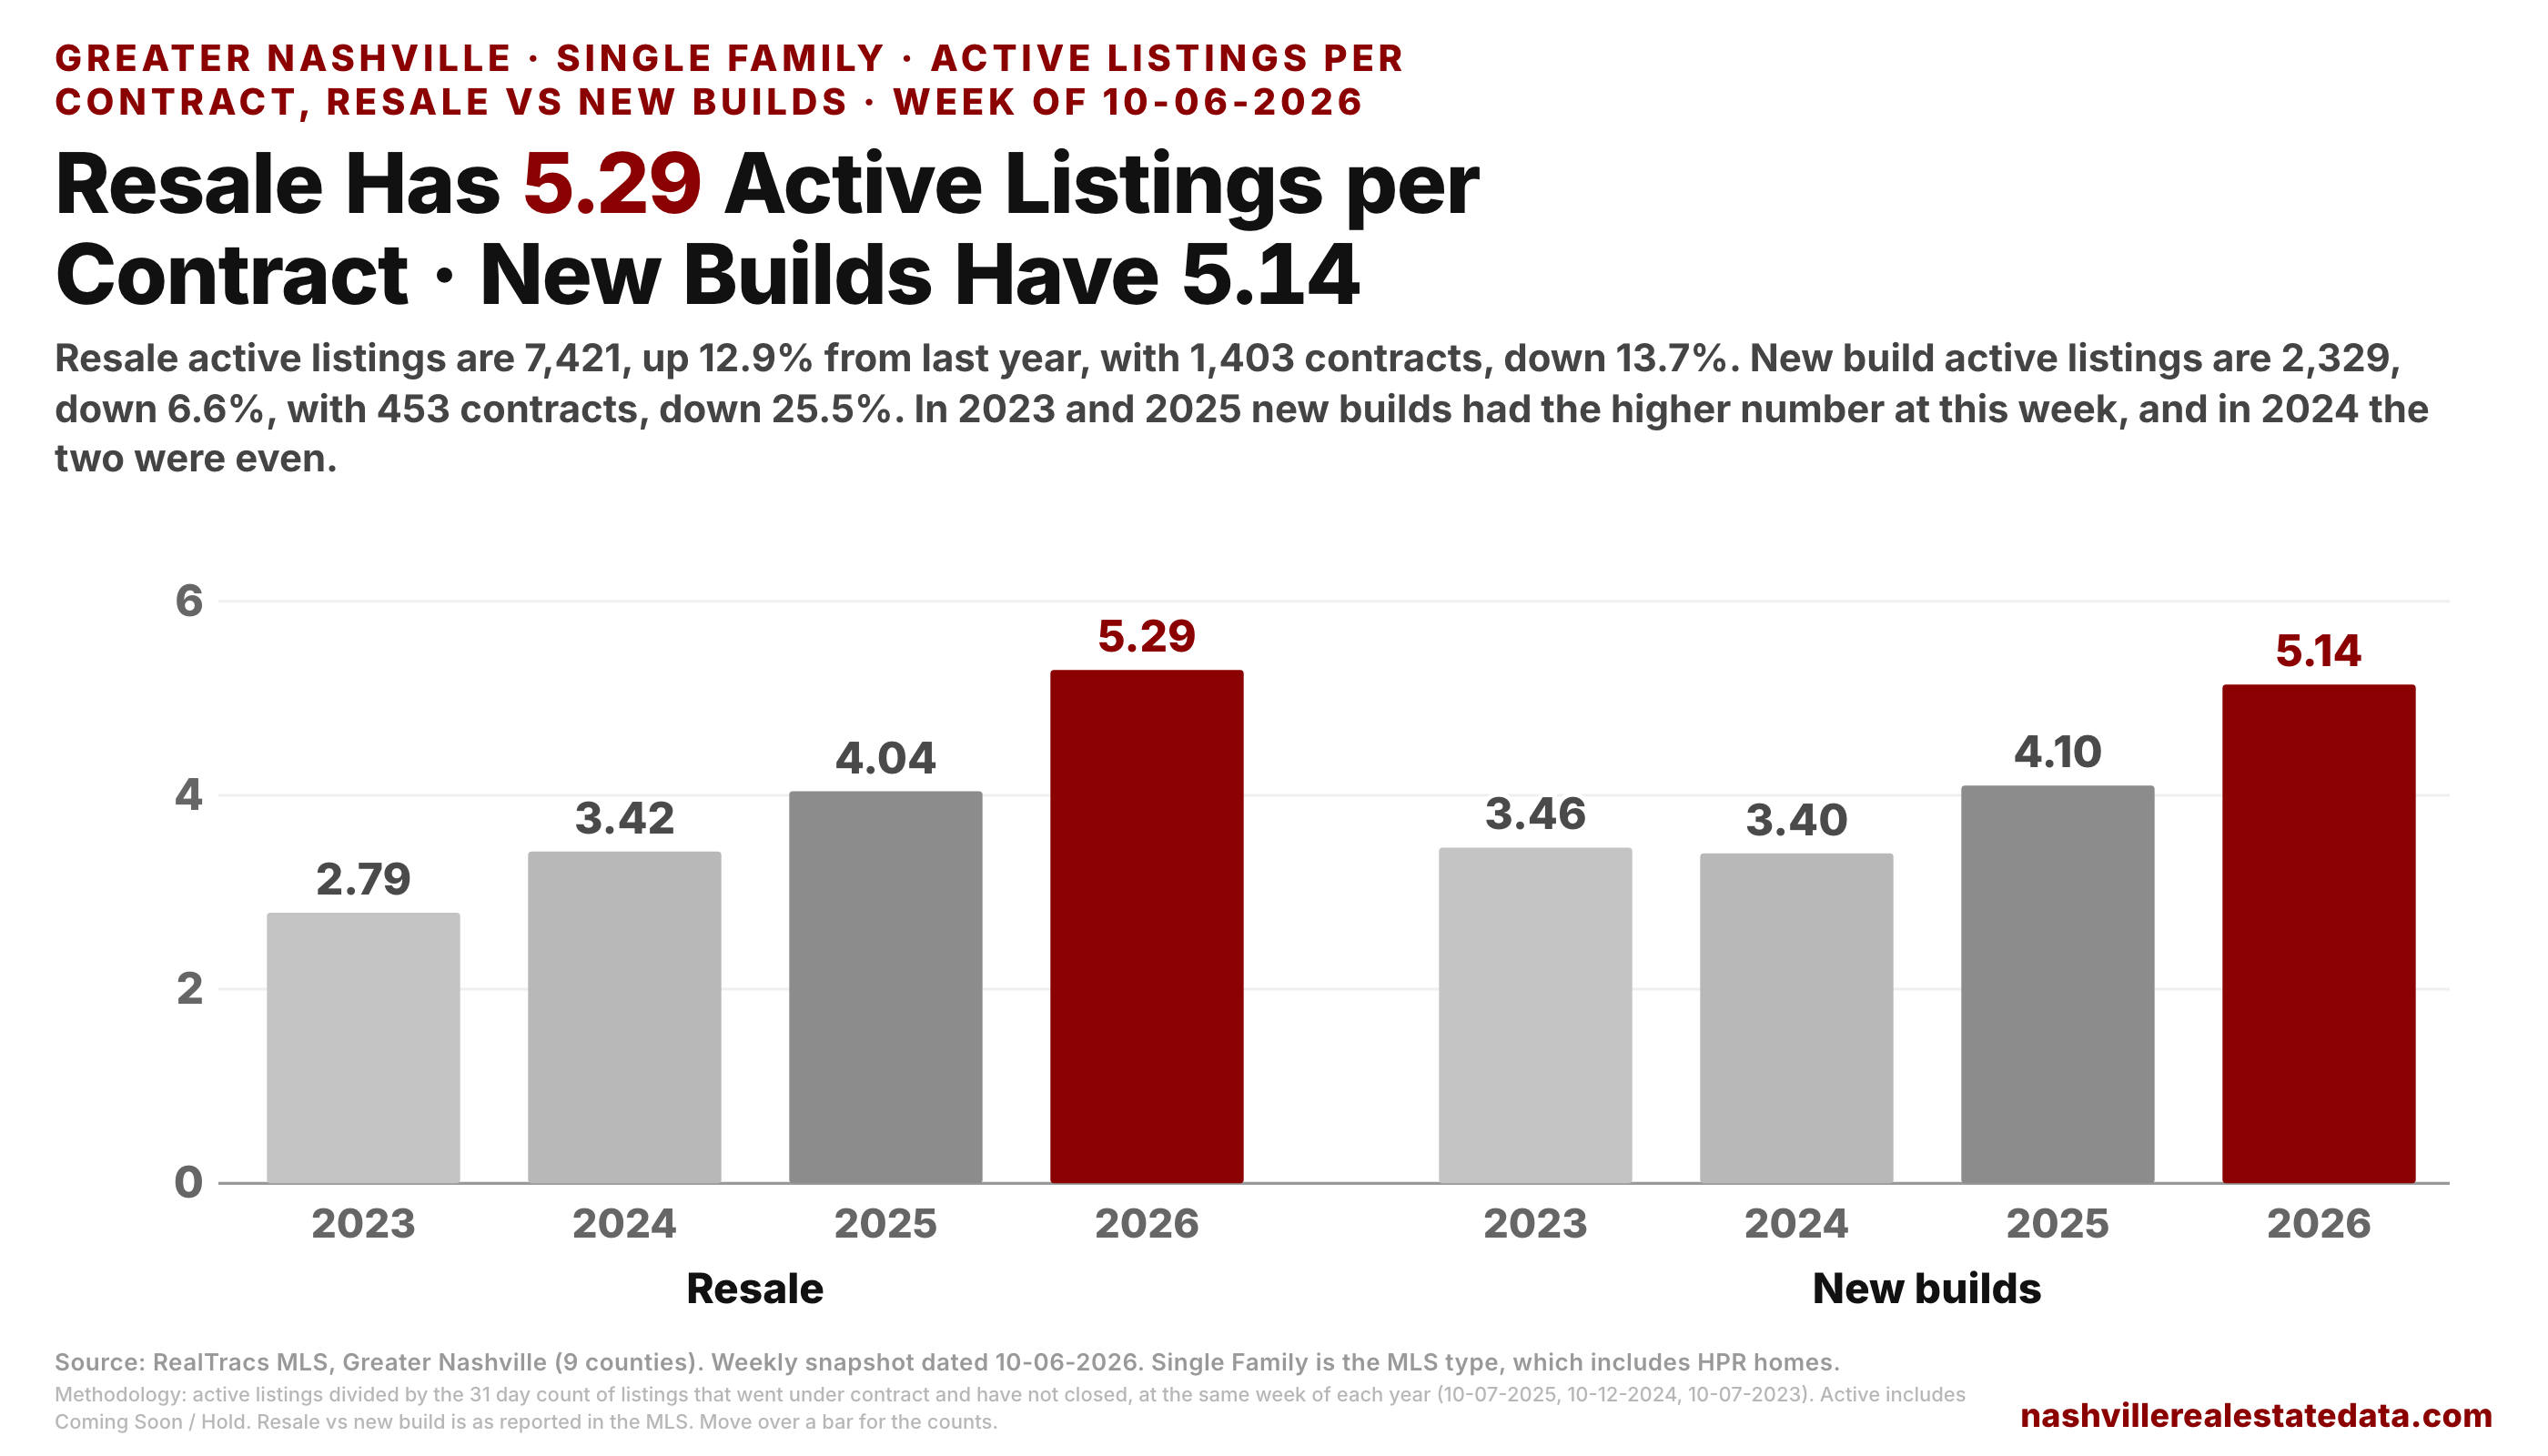
Resale, at 5.29 against 5.14 for new builds. In 2023 and 2025 new builds had the higher number at this week, and in 2024 the two were even, 3.42 against 3.40.
Resale and new builds got there differently. Resale active listings are 7,421, up 12.9% from last year's 6,575, and resale contracts are 1,403, down 13.7% from 1,626. New build active listings are 2,329, down 6.6% from last year's 2,493, and new build contracts are 453, down 25.5% from 608. Builders have fewer listings than last year, and their contracts fell more than their listings did. New build contracts are also 33.4% below 2024 and 28.3% below 2023.
5. Which counties have the most active listings per contract?
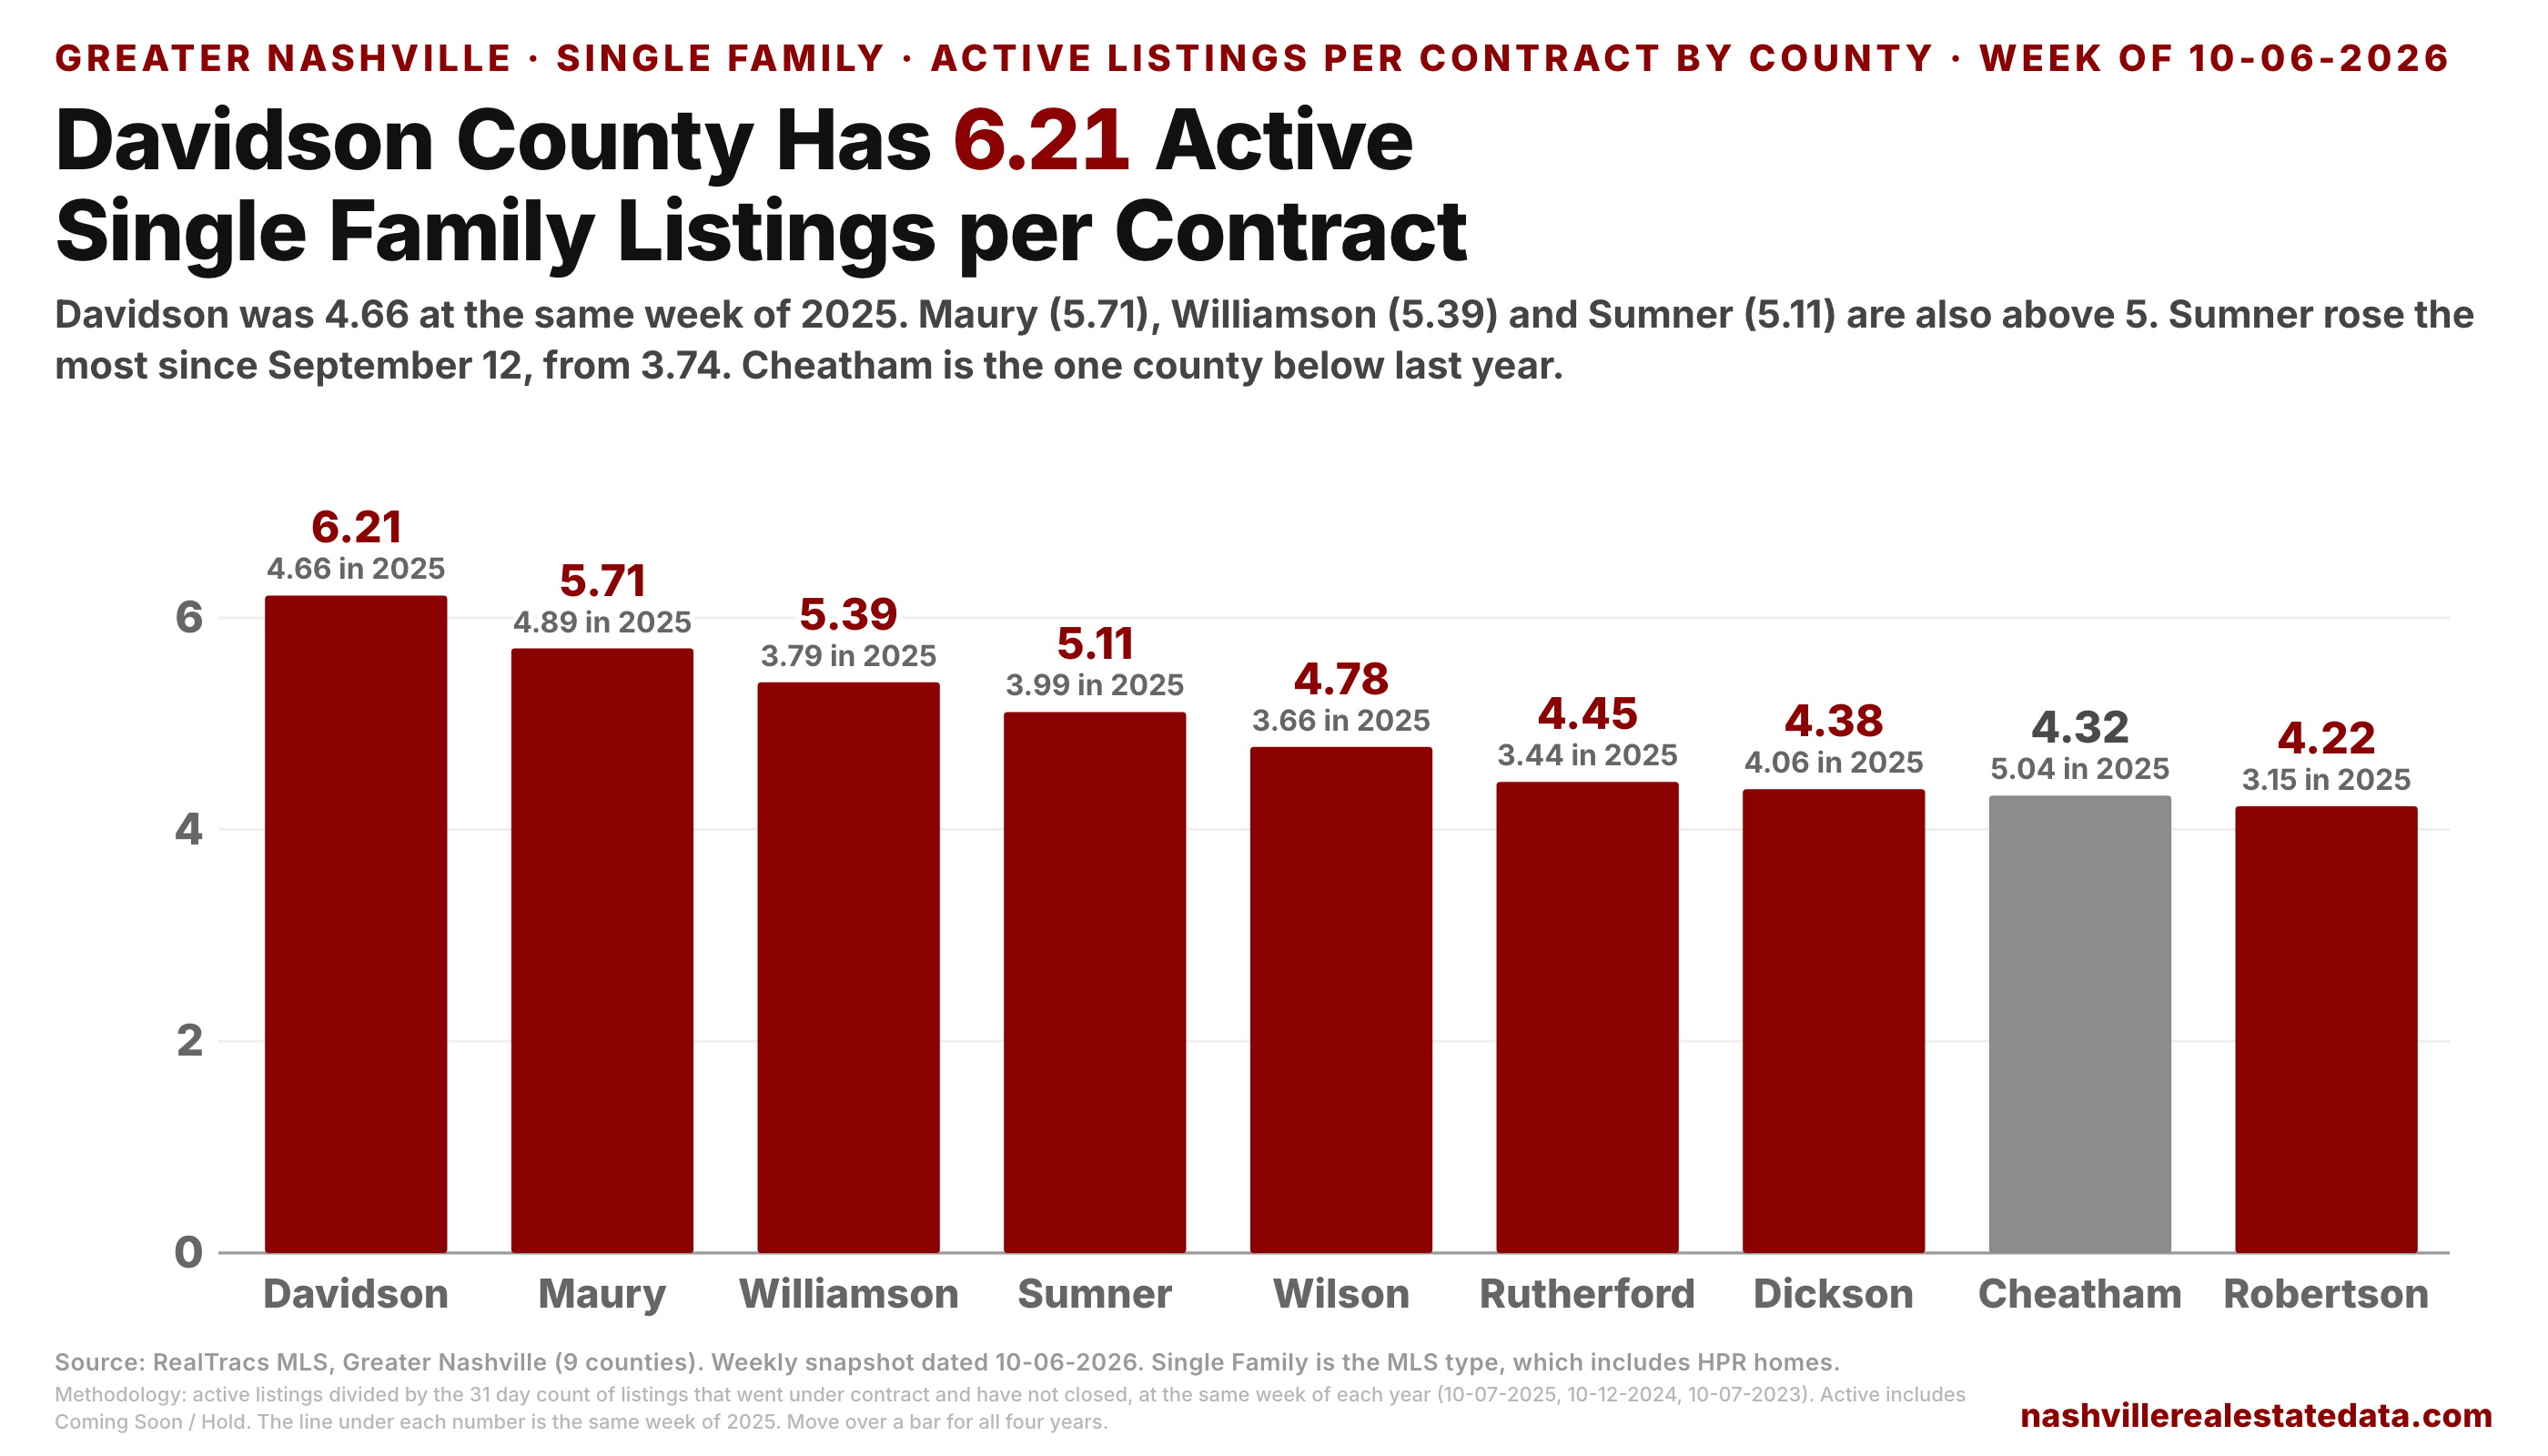
Davidson County, at 6.21, against 4.66 last year. Davidson has 3,142 active Single Family listings and 506 contracts, and its contracts are 21.1% below last year's 641. Maury is at 5.71, Williamson at 5.39 and Sumner at 5.11. Those 4 counties are above 5. At this week last year Cheatham was the one county above 5, at 5.04.
Sumner rose the most since September 12, from 3.74 to 5.11. Its contracts went from 293 to 213 while its active listings went from 1,097 to 1,088. Williamson went from 4.38 to 5.39, with contracts down from 356 to 280.
8 of the 9 counties are above last year. Cheatham is the one county below it, 4.32 against 5.04, on a small count (50 contracts vs 45).
6. Which price bands have the most active listings per contract?
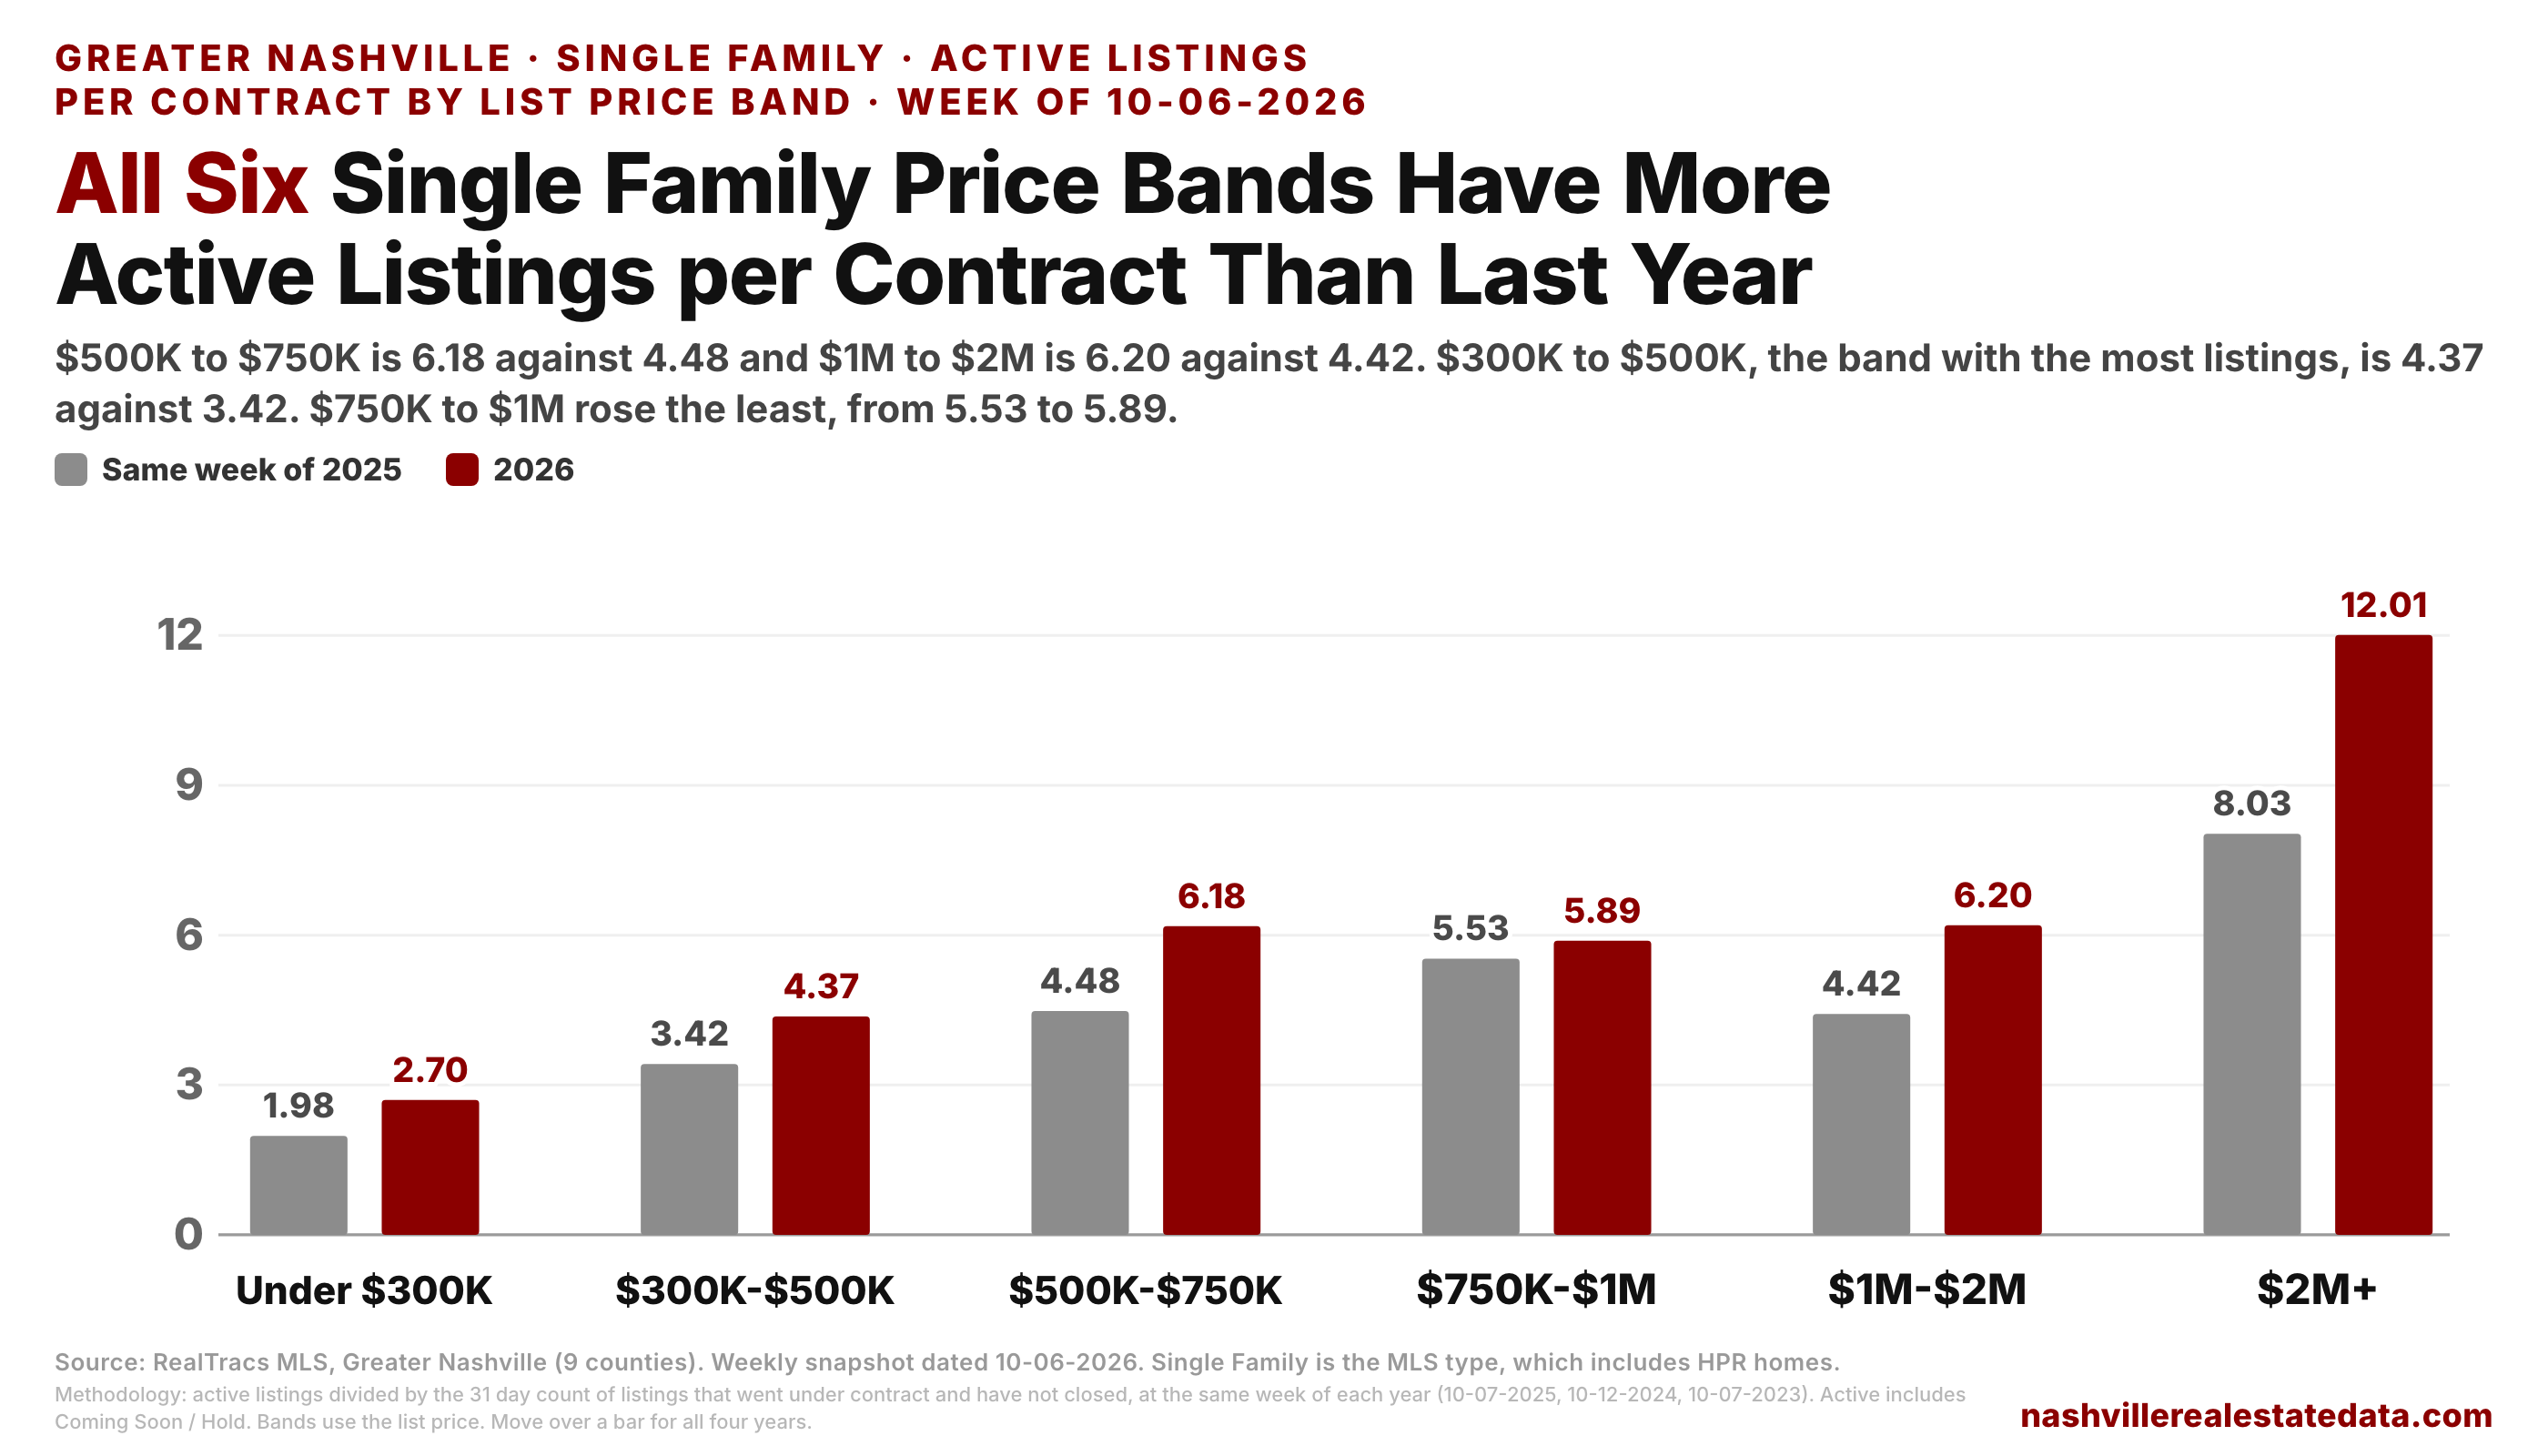
$2M+ is the highest, at 12.01 against 8.03 last year, with 853 active listings and 71 contracts. All six bands are above last year.
$500K to $750K is at 6.18, against 4.48 last year and 4.92 on September 12. Its contracts are 445, down 19.8% from last year's 555, and its active listings are 2,750, up 10.5%. $1M to $2M is at 6.20 against 4.42, with contracts down 18.9% (210 vs 259) and active listings up 13.5%.
$300K to $500K has the most listings and the most contracts of the six bands. It is at 4.37, against 3.42 last year, with 3,181 active listings and 728 contracts, down 17.7% from 885. Under $300K is the lowest at 2.70, against 1.98 last year.
$750K to $1M rose the least, from 5.53 to 5.89. It is the one band with fewer active listings than last year (1,195 vs 1,245), and its contracts are down 9.8% (203 vs 225).
7. What is the number for condos?
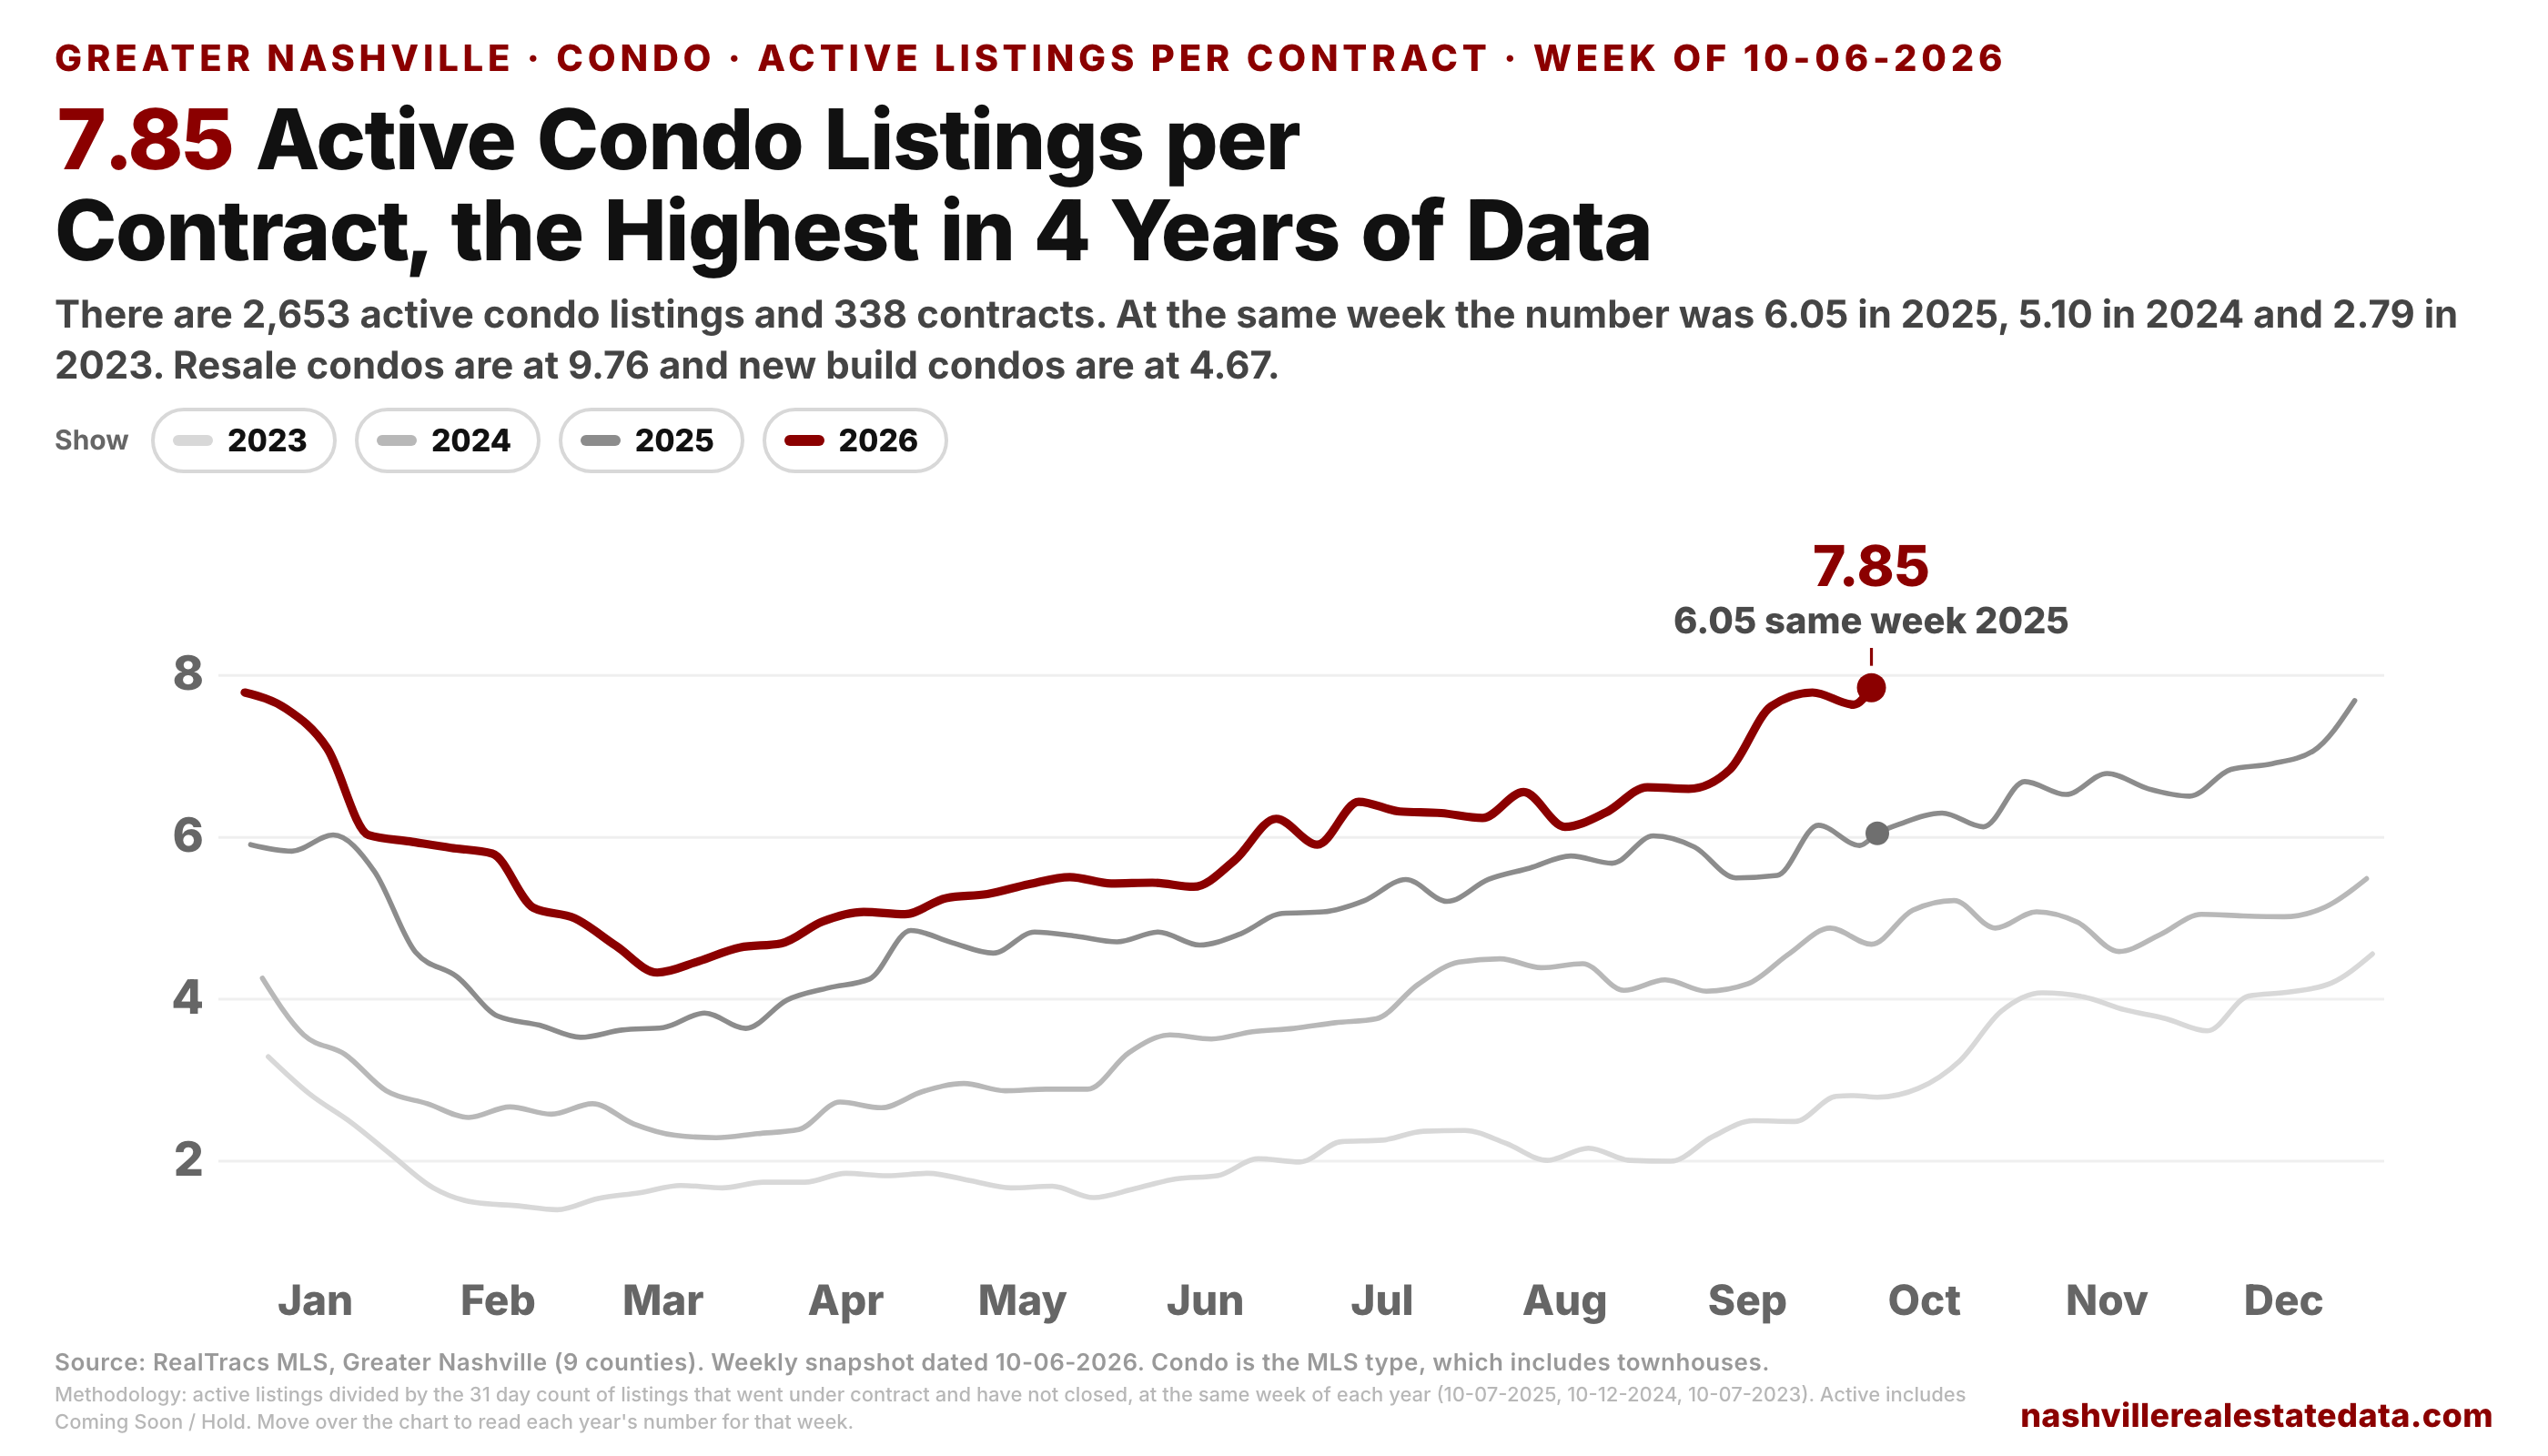
7.85, against 6.05 at the same week of 2025, 5.10 in 2024 and 2.79 in 2023. This number includes townhouses. It is the highest of any week in the 4 years of data. The high before this year was 7.69, on December 27, 2025.
There are 2,653 active condo listings, 14.5% above last year, and 338 contracts, 11.7% below last year's 383. Condo contracts have been below all three prior years at each of the 5 data points since September 12. With the contracts that already closed added in, the total is 411 against 451 last year (-8.9%).
Most of the rise is in resale. Resale condos are at 9.76, against 6.44 last year, with 2,060 active listings and 211 contracts. New build condos are at 4.67, against 5.16 last year. Davidson County has 1,599 active condo listings and 136 contracts, which is 11.76, against 8.04 last year.
Adding it up
- Single Family contracts are 1,856, down 16.9% from last year, the largest decline of any week in 2026, and down 17.4% from 2024.
- There are 5.25 active Single Family listings per contract, against 4.06 last year. It is the highest of any week in the 4 years of data.
- The number rose because contracts fell 16.0% since September 12, more than in any of the three prior years, while active listings fell 1.4%.
- Resale is at 5.29 and new builds are at 5.14. In 2023 and 2025 new builds had the higher number at this week.
- Davidson is at 6.21, and Maury, Williamson and Sumner are also above 5. Only Cheatham was above 5 at this week last year.
- All six Single Family price bands are above last year. $500K to $750K and $1M to $2M are both above 6.
- Condos are at 7.85, against 6.05 last year, and resale condos are at 9.76.
For a seller, there are 5.25 active Single Family listings for every home that went under contract in the last 31 days, and 41.3% of the active Single Family listings have a price cut. For a buyer, there are 9,750 Single Family listings to pick from, 682 more than last year, with 378 fewer contracts than last year.
What to watch: in each of the three prior years the Single Family number rose from this week to the end of October, by 0.36 in 2023, 0.11 in 2024 and 0.17 in 2025, and it kept rising into December. I expect the number to be above 5.25 on October 31. With today's active listings the count has to be about 1,950 contracts for the number to be back under 5, and the count was last above 1,950 on September 26. If the mortgage rate falls back under 7.25% and the number is under 5 at the end of October, the rise came from the rate. For condos, I expect the number to stay above 7.5 through October.
Data through the week of 10-06-2026, Greater Nashville (9 counties: Davidson, Williamson, Rutherford, Wilson, Sumner, Maury, Dickson, Cheatham, Robertson). Active listings per contract is active listings divided by the 31 day count of listings that went under contract and have not closed, at the same week each year (10-07-2025, 10-12-2024 and 10-07-2023). Active includes Coming Soon / Hold. Single Family is the MLS type, which includes HPR-Attached homes. Condo is the MLS type, which includes townhouses. Price bands use the list price. Resale vs new build is as reported in the MLS. The already closed contracts come from the daily MLS data on the same days. A price cut is an active listing with a list price below its original list price. Mortgage rates are the Mortgage News Daily 30 year fixed rate, data through 10-05-2026. Source: RealTracs MLS; Mortgage News Daily.