2,231 Single Family homes and condos went under contract in Greater Nashville in the last 31 days, against 2,576 at the same week of 2025 (-13.4%), 2,667 in 2024 (-16.3%) and 2,452 in 2023 (-9.0%). The declines vs 2025 and vs 2024 are the largest of any week in 2026, and the count is the lowest since January 31. Over the last 5 weeks the 30 year mortgage rate went from 6.75% to 7.57%, with a high of 7.60% on September 30, the highest since November 2023.
The September 22 post found contracts under $300K rising while rates rose, and said the next 4 weeks would be the first contracts at the higher rate. 12 charts below cover the weekly count, mortgage rates, how fast the count fell vs the prior years, the counties, the price bands, the property types, resale vs new builds, active listings per contract, price cuts, the contract price per square foot, and closings.
1. How low is the contract count?
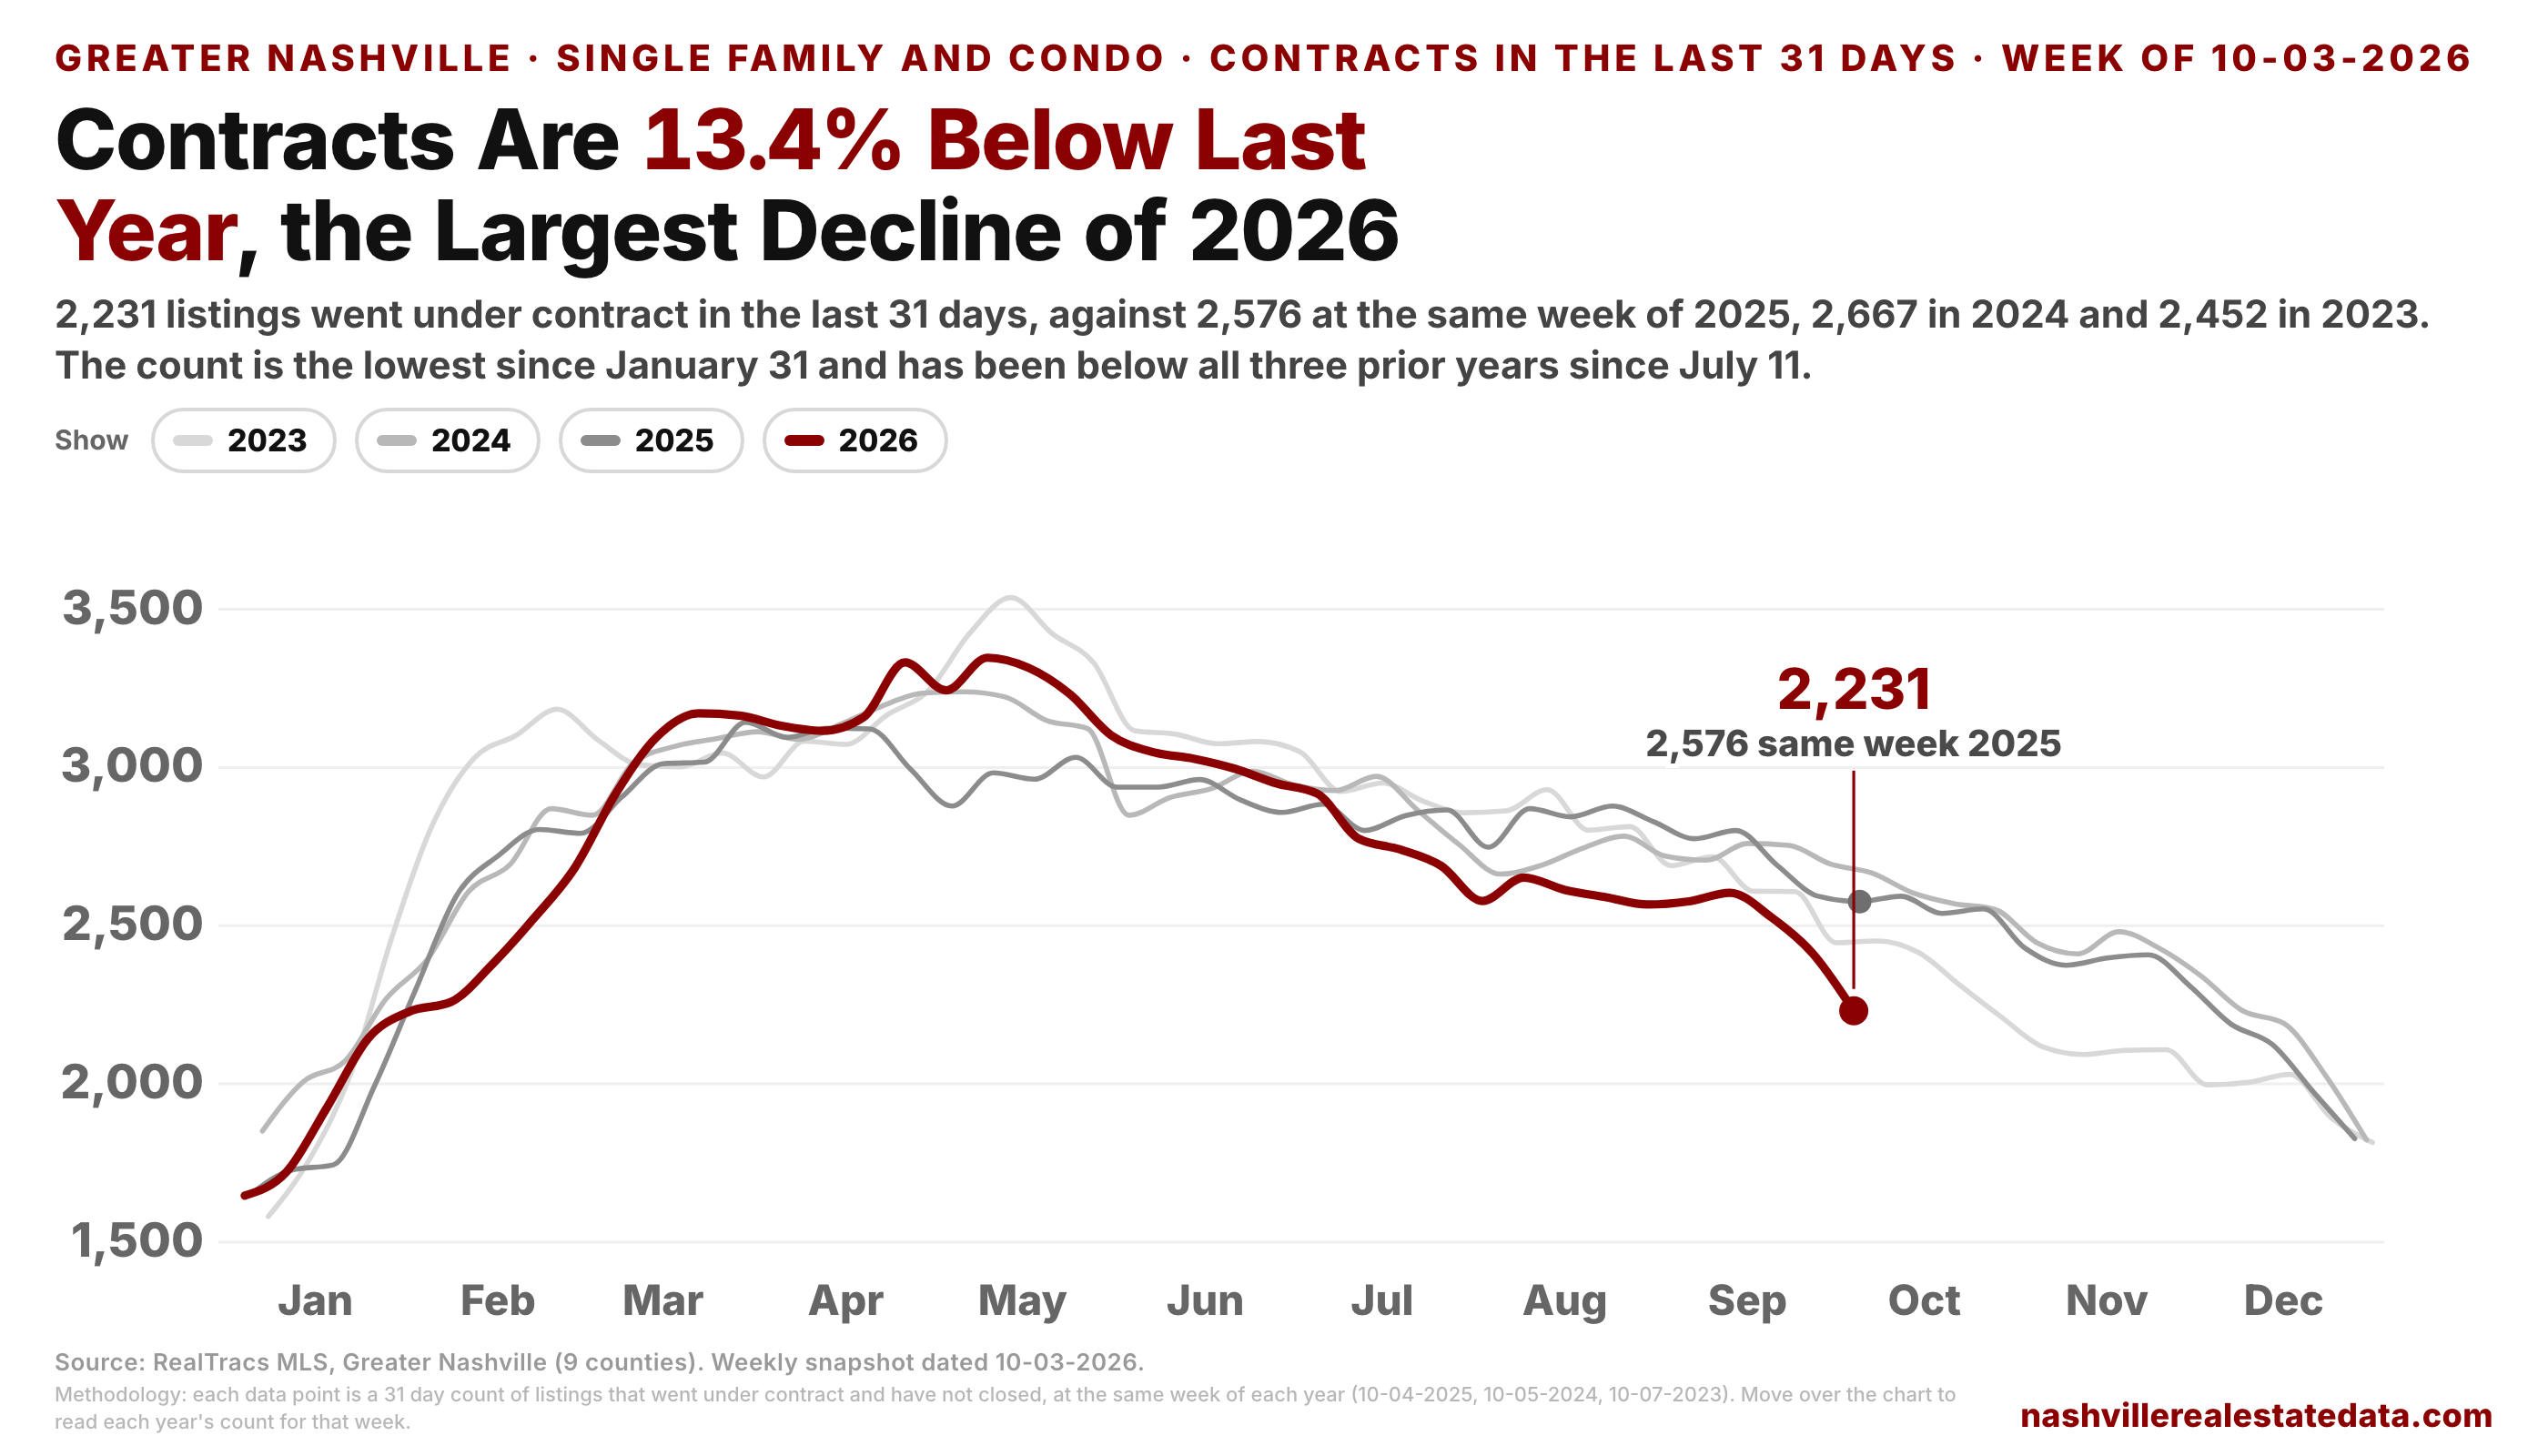
The 2026 count was 2,577 on September 5. The 4 weekly data points since are 2,604, 2,527, 2,413 and now 2,231. The last one is a drop of 182 in a week, the largest drop from one data point to the next in 2026. The count has been below all three prior years at each of the 13 data points since July 11. The gap vs 2025 is 345 contracts and the gap vs 2024 is 436, and both are the largest of the year.
2. What did mortgage rates do?
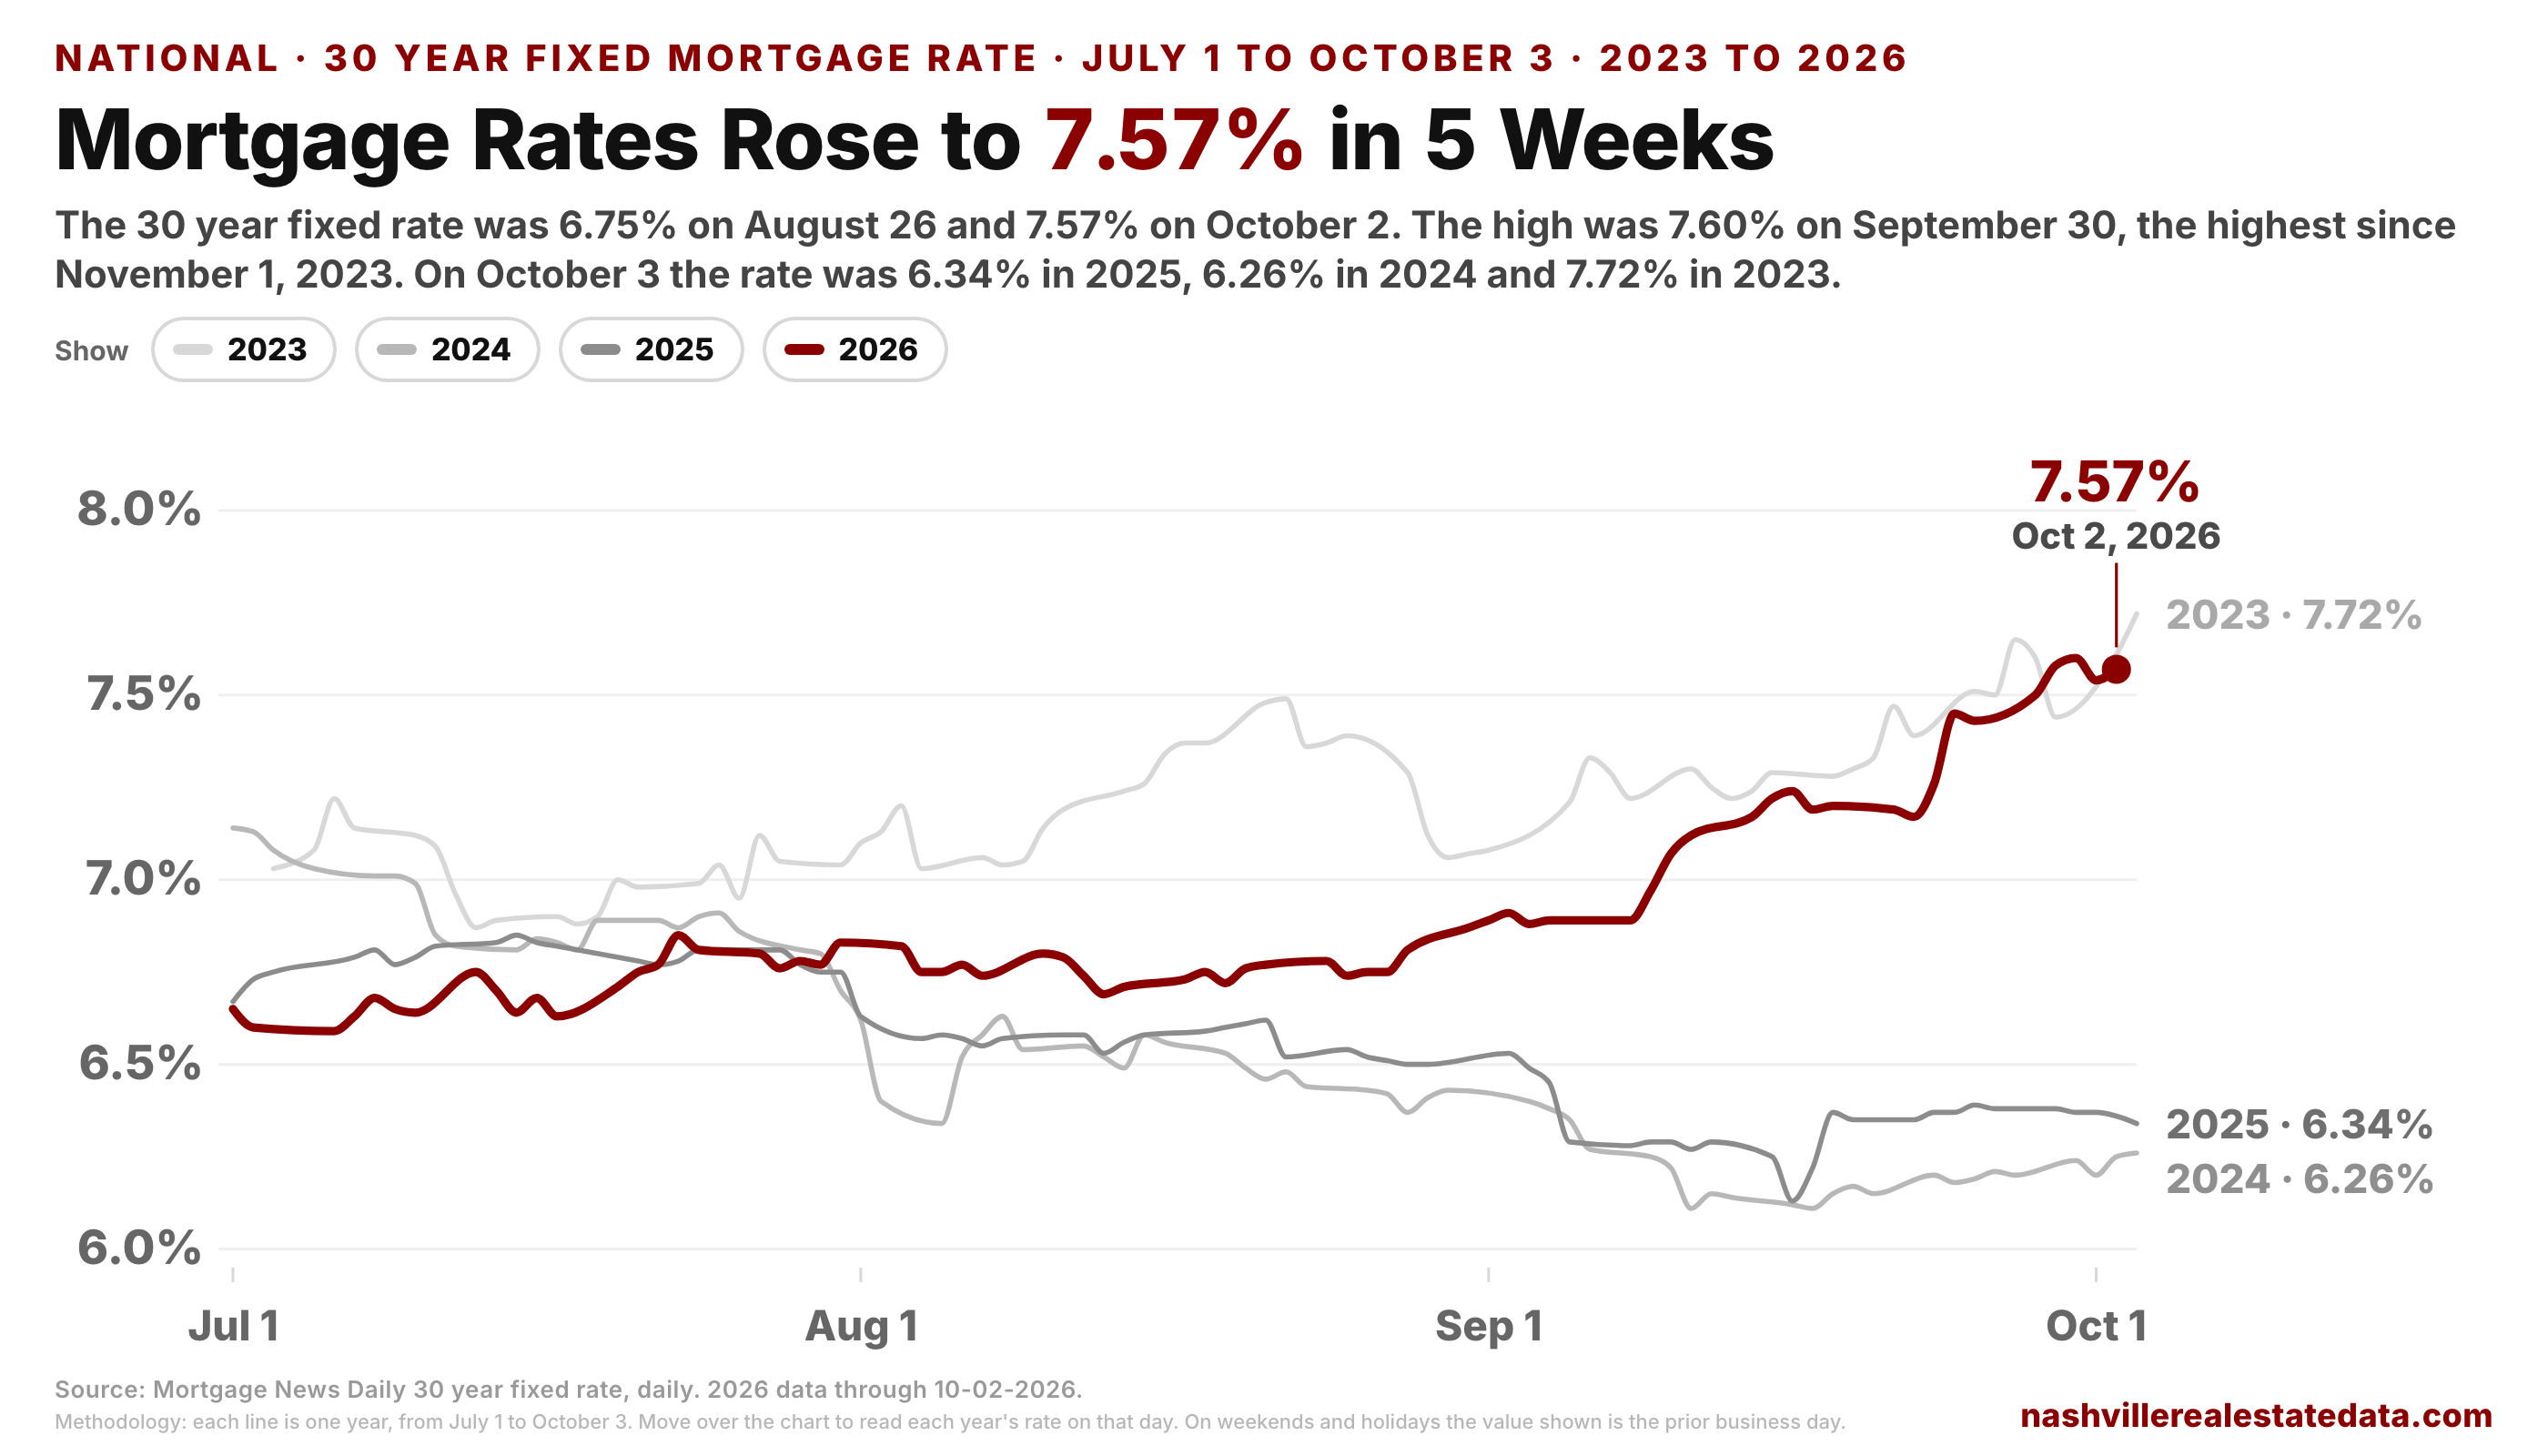
The Mortgage News Daily 30 year rate was 6.75% on August 26 and 7.57% on October 2. The high was 7.60% on September 30, the highest since November 1, 2023. On October 3 of 2025 the rate was 6.34%, and in 2024 it was 6.26%. On a $400K loan, the principal and interest payment at 7.57% is about $222 a month more than at 6.75%.
2023 is the year with the same rate. It was 7.72% on October 3, 2023, and contracts this week are 9.0% below that year with 69.7% more active listings (12,319 vs 7,261). In 2023 the rate kept rising to 8.03% on October 19, and the contract count fell from 2,452 to 2,118 by November 4.
3. Did 2026 fall faster than the prior years?
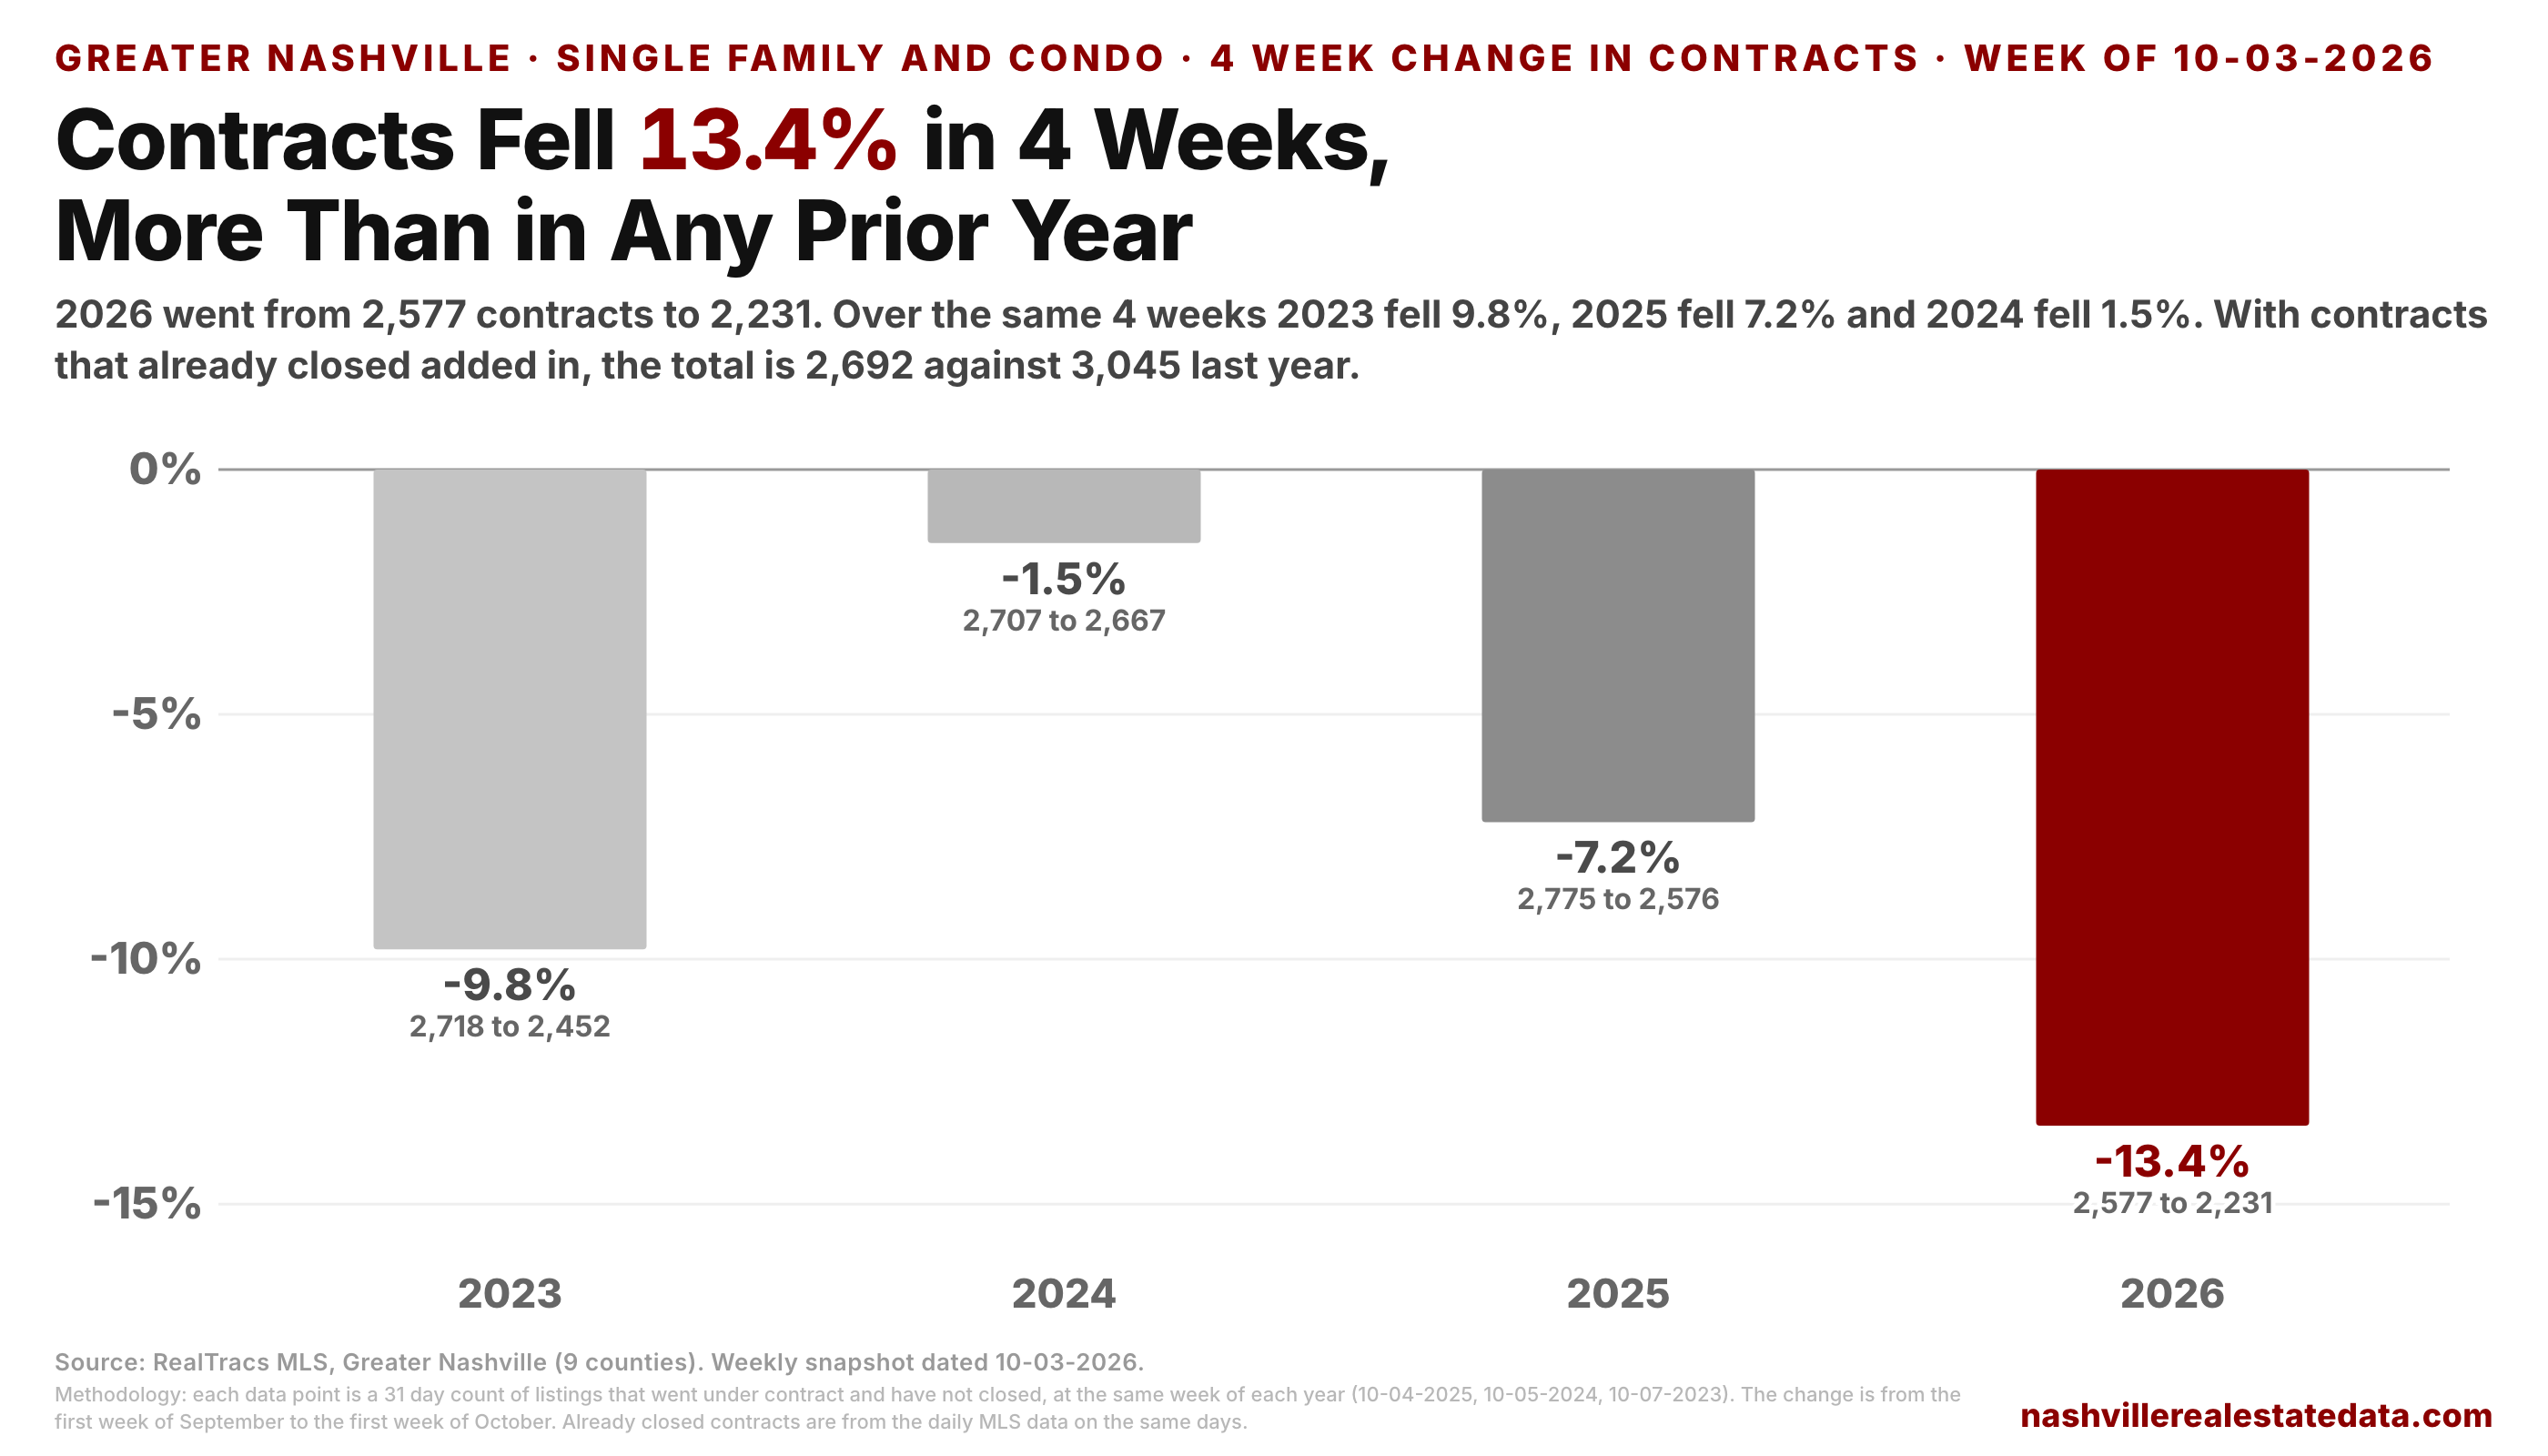
Yes. 2026 lost 346 contracts over the 4 weeks, a decline of 13.4%. Over the same 4 weeks 2023 fell 9.8%, 2025 fell 7.2% and 2024 fell 1.5%. Contract volume falls every September, and this year it fell more than in any of the three prior years. Four weeks ago 2026 was 7.1% below 2025. The gap went from 198 contracts to 345 because 2026 fell by 346 while 2025 fell by 199.
The weekly count only includes contracts that have not closed yet. With the contracts from the last 31 days that already closed added in, the total is 2,692 this week, against 3,045 at the same week of 2025 (-11.6%), 3,055 in 2024 (-11.9%) and 2,813 in 2023 (-4.3%). The decline is still there with closed contracts included. Contracts from the last 14 days are 1,237, against 1,418 last year (-12.8%), 1,408 in 2024 and 1,248 in 2023.
4. Which counties fell the most?
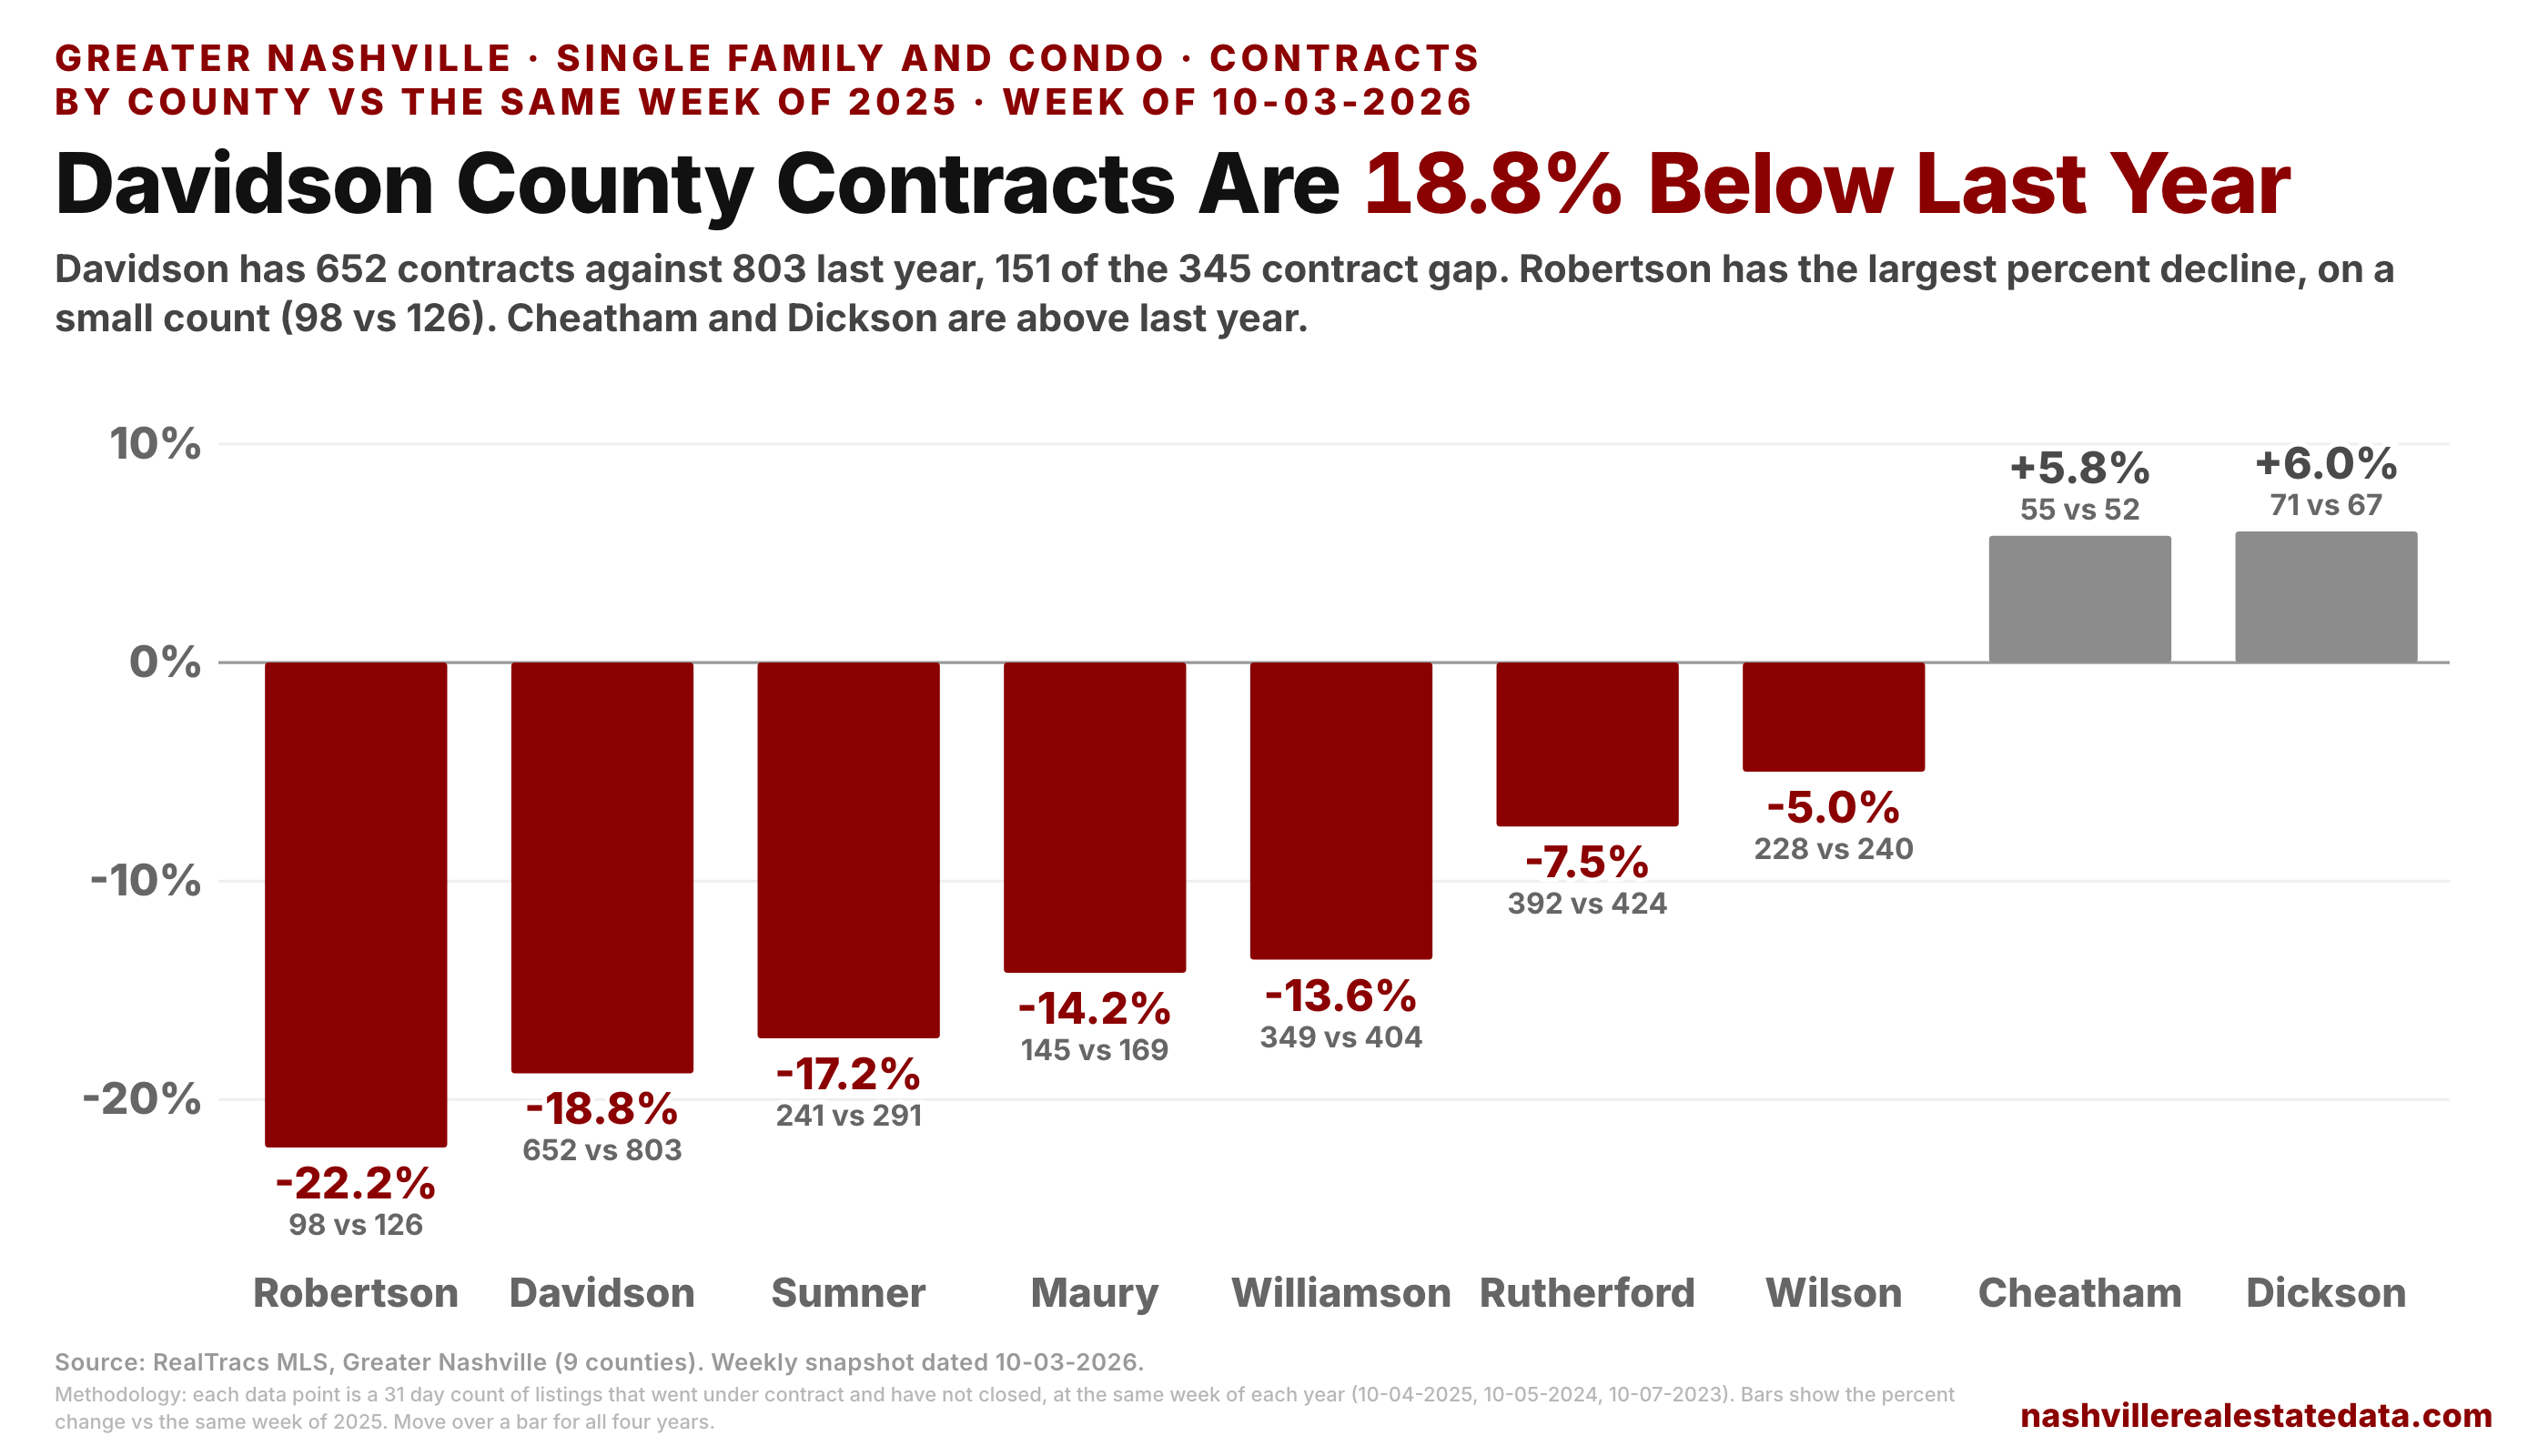
Davidson County has 652 contracts against 803 last year (-18.8%), 851 in 2024 (-23.4%) and 782 in 2023 (-16.6%). Four weeks ago Davidson was at 799, 5.2% below last year. Davidson is 151 of the 345 contract gap vs 2025.
Robertson County has the largest percent decline, -22.2%, on a small count (98 vs 126). Sumner (241 vs 291) is 17.2% below last year, Maury (145 vs 169) is 14.2% below and Williamson (349 vs 404) is 13.6% below. Four weeks ago Sumner was 1.5% above last year and Maury was 8.1% above. Rutherford is 7.5% below last year (392 vs 424), and its count rose over the 4 weeks, from 367. Wilson is 5.0% below (228 vs 240). Dickson (71 vs 67) and Cheatham (55 vs 52) are above last year.
5. Which price bands fell?
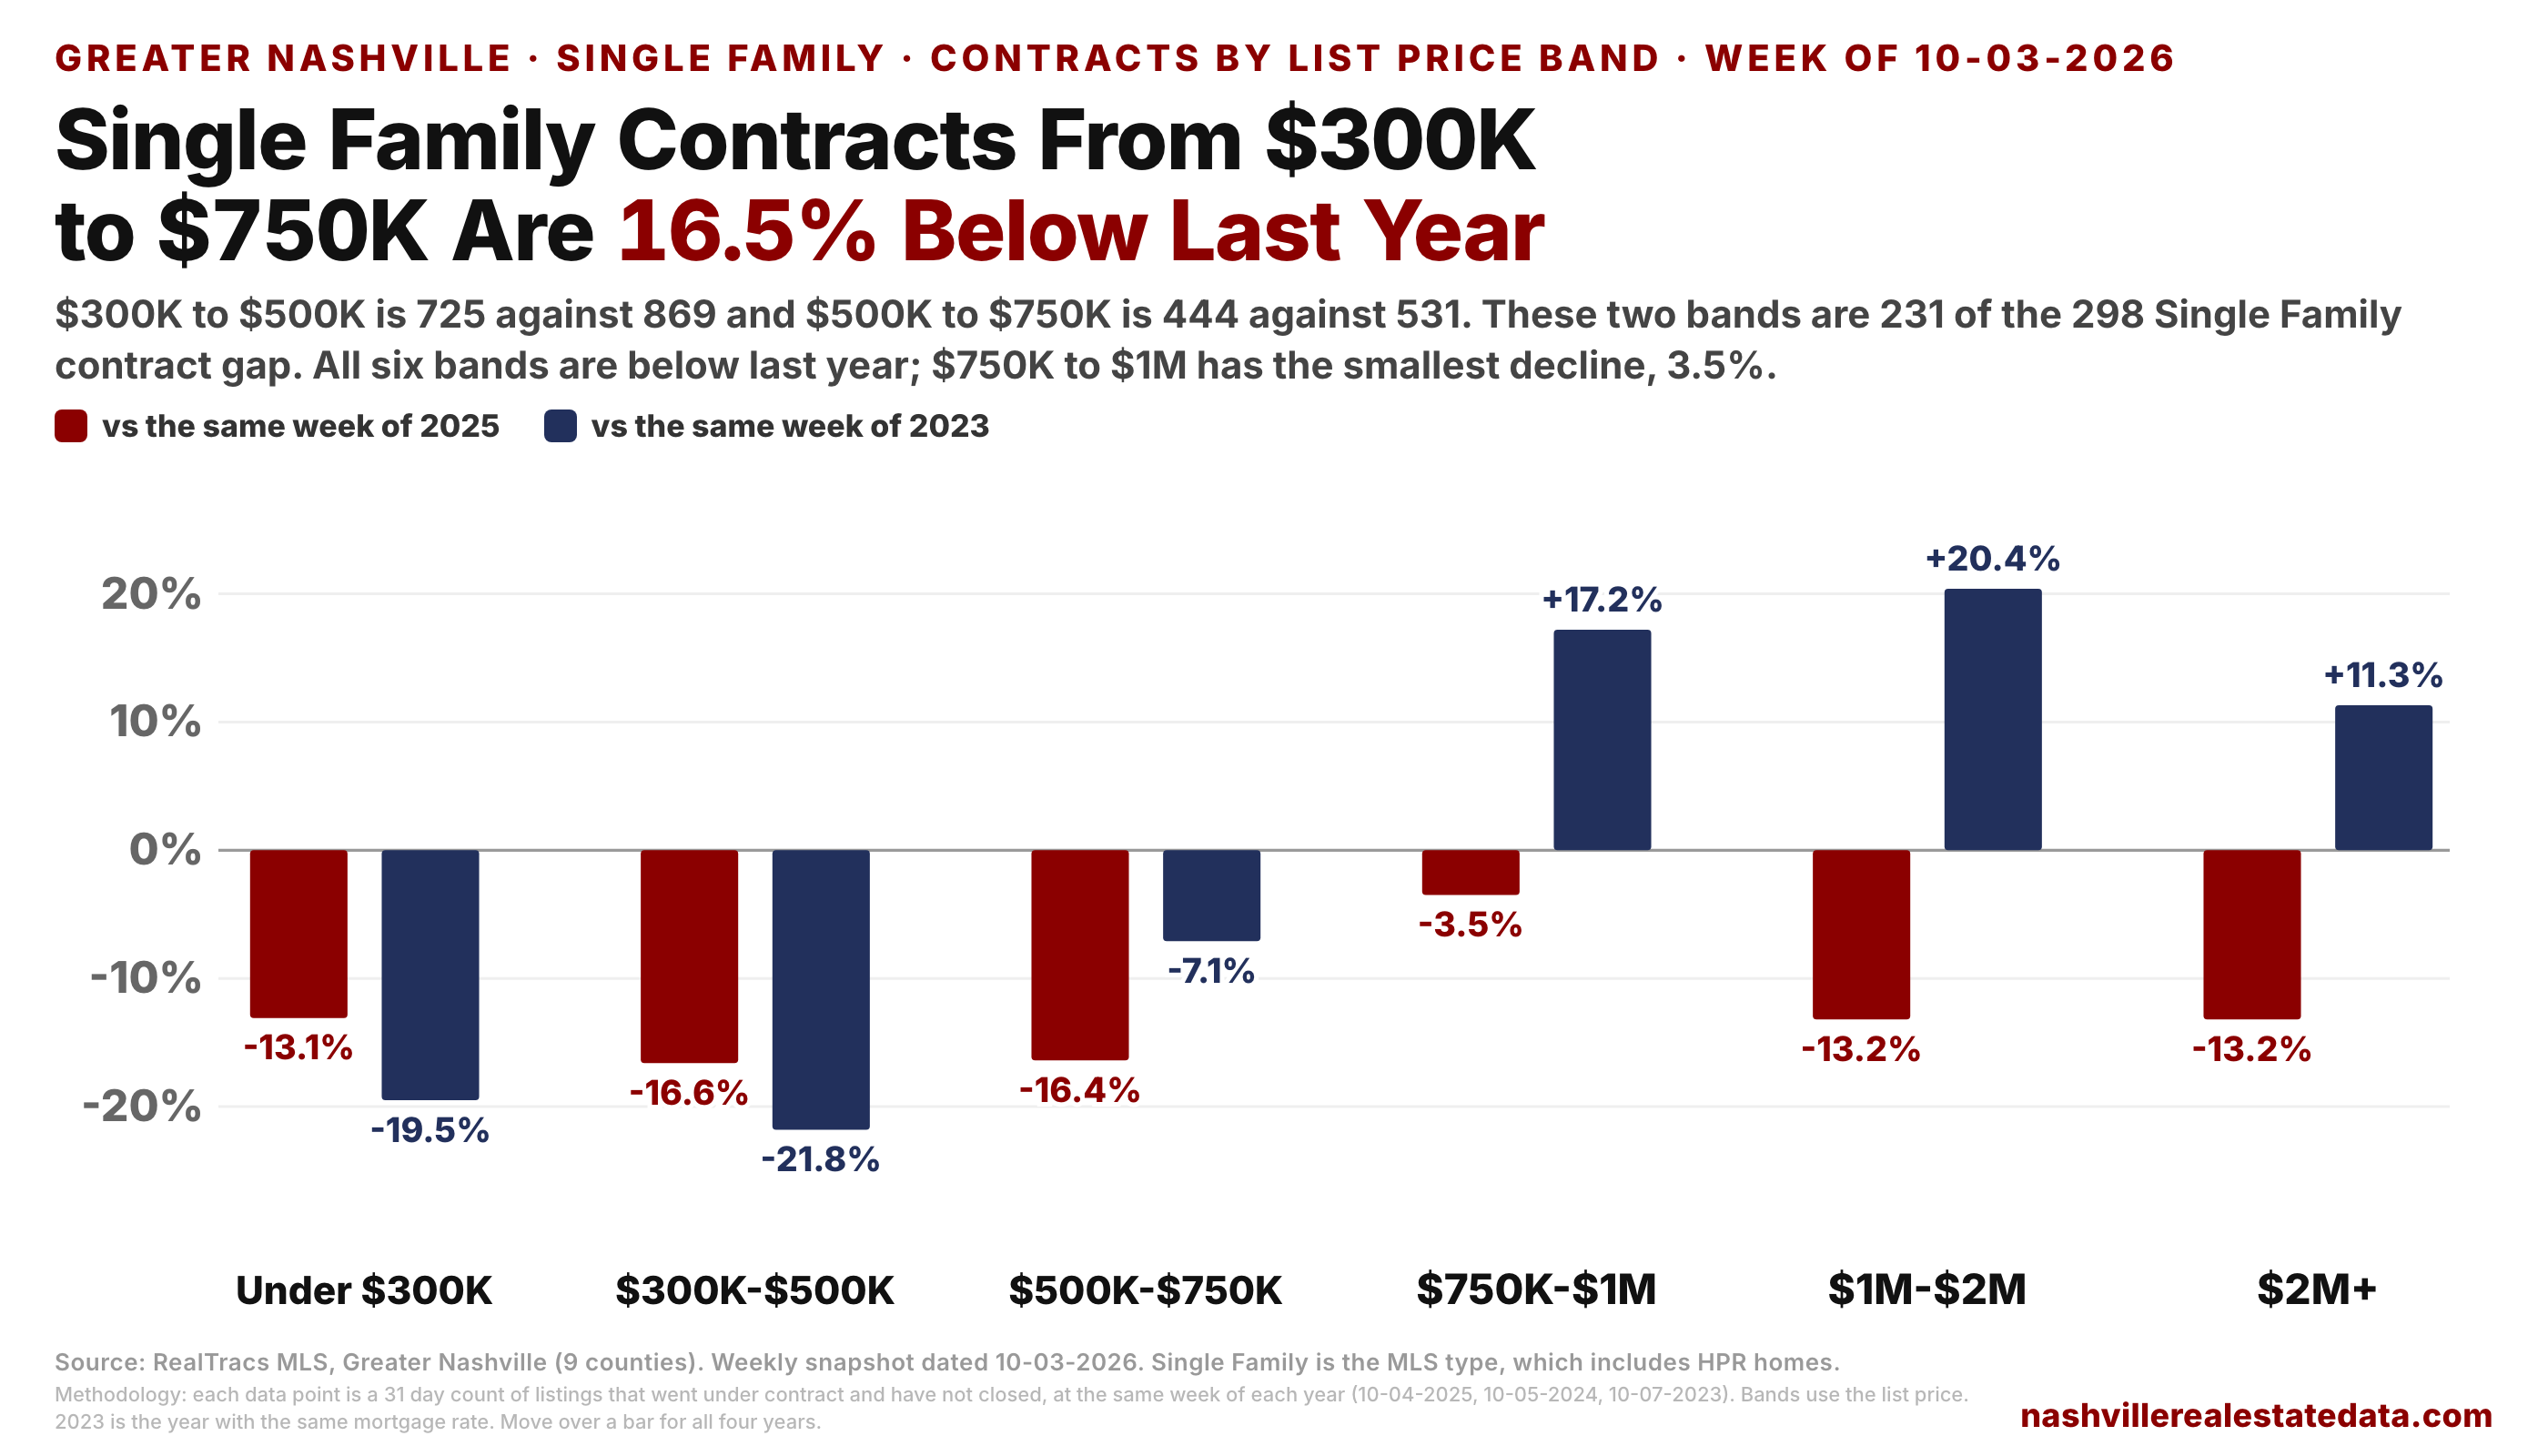
Most of the decline is between $300K and $750K. Single Family contracts from $300K to $500K are 725 against 869 last year (-16.6%), 1,007 in 2024 (-28.0%) and 927 in 2023 (-21.8%). $500K to $750K is 444 against 531 last year (-16.4%). These two bands are 231 of the 298 Single Family contract gap vs 2025.
All six bands are below last year. $750K to $1M fell the least, 218 against 226 (-3.5%). $1M to $2M (224 vs 258) and $2M+ (79 vs 91) are both 13.2% below last year, and both are still above 2023.
Under $300K is 153, against 176 last year (-13.1%). The September 22 post had this band at 180 and said a count under 160 would mean the rate rise was showing up with a lag. It is under 160 11 days later.
6. Which property types fell?
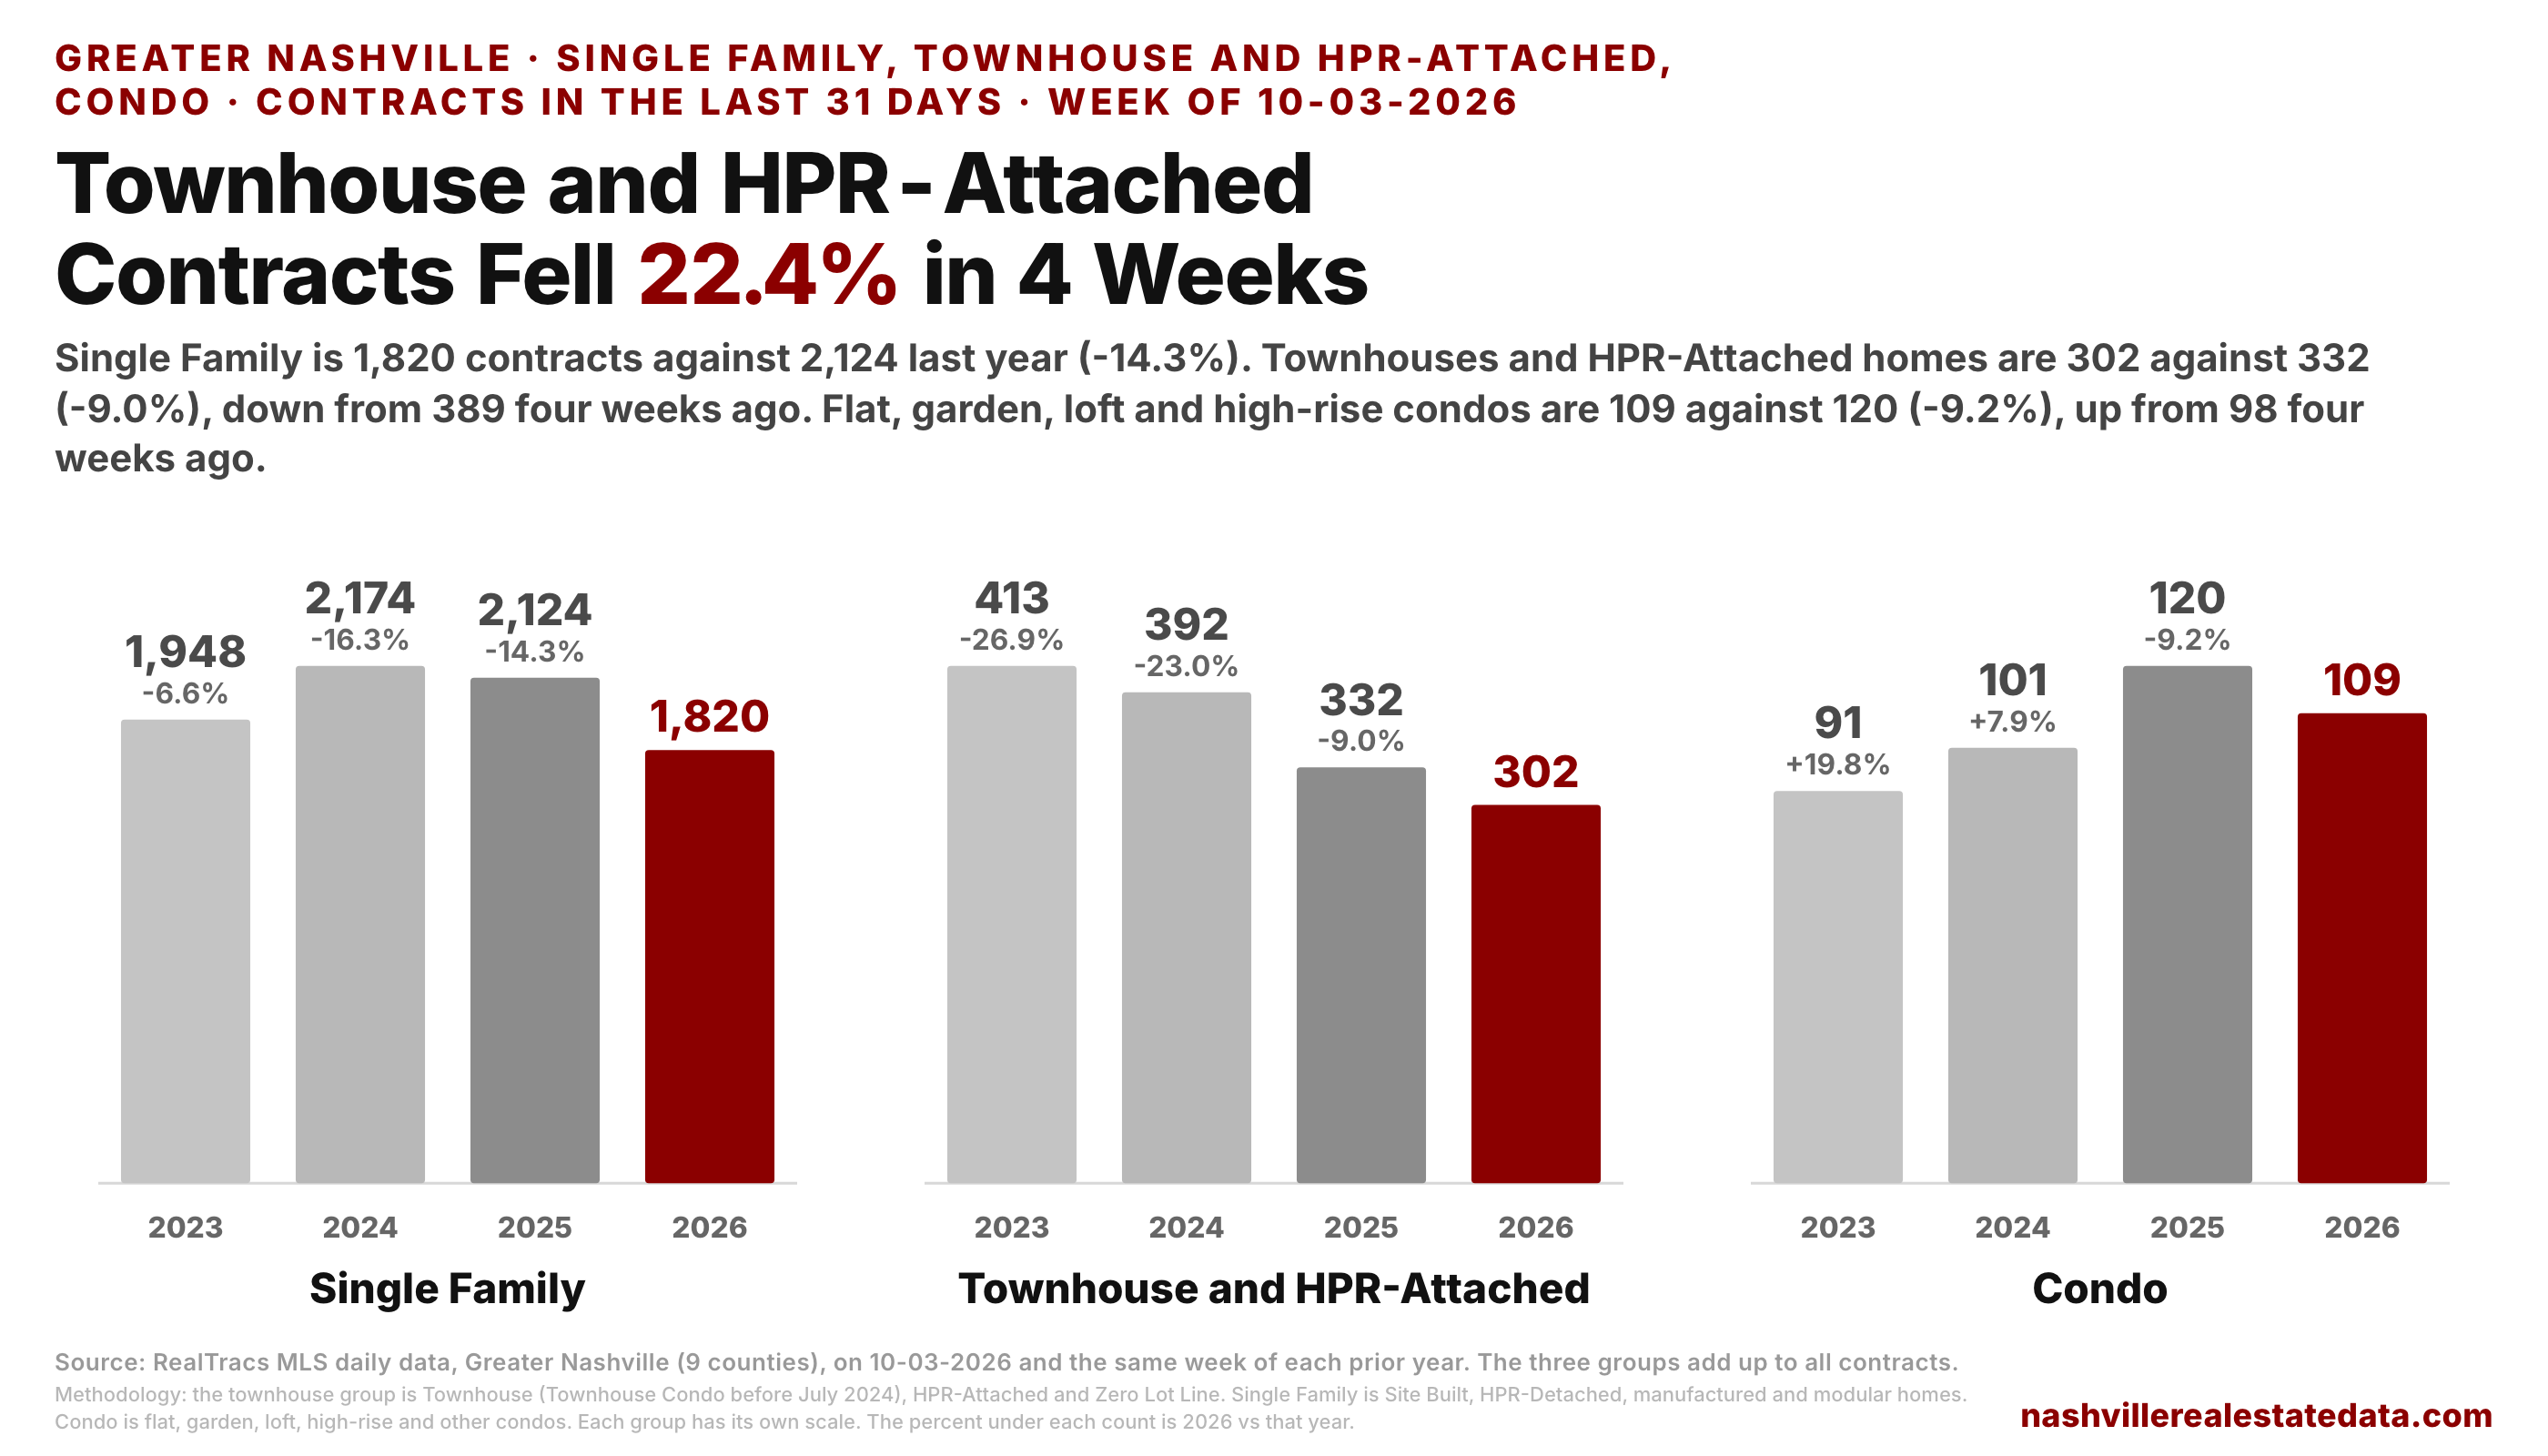
All three are below last year. Single Family homes are 1,820 contracts against 2,124 last year (-14.3%), 2,174 in 2024 (-16.3%) and 1,948 in 2023 (-6.6%). Single Family is 304 of the 345 contract gap vs 2025.
Townhouses and HPR-Attached homes are 302 against 332 last year (-9.0%), 392 in 2024 (-23.0%) and 413 in 2023 (-26.9%). This type fell the most in the last month: it was 389 four weeks ago, a drop of 22.4%, against 12.9% for Single Family. Townhouses are 237 of the 302 (273 last year) and HPR-Attached homes are 43 (36 last year).
Condos (flat, garden, loft and high-rise) are 109 against 120 last year (-9.2%), and are above 2024 (101) and 2023 (91). Condos are the one type that rose over the 4 weeks, from 98.
Condos have the most active listings per contract of the three: 10.38, against 7.92 last year. Townhouses and HPR-Attached homes are at 6.43 (5.64 last year) and Single Family is at 5.08 (4.03 last year).
7. Is the decline in resale or in new builds?
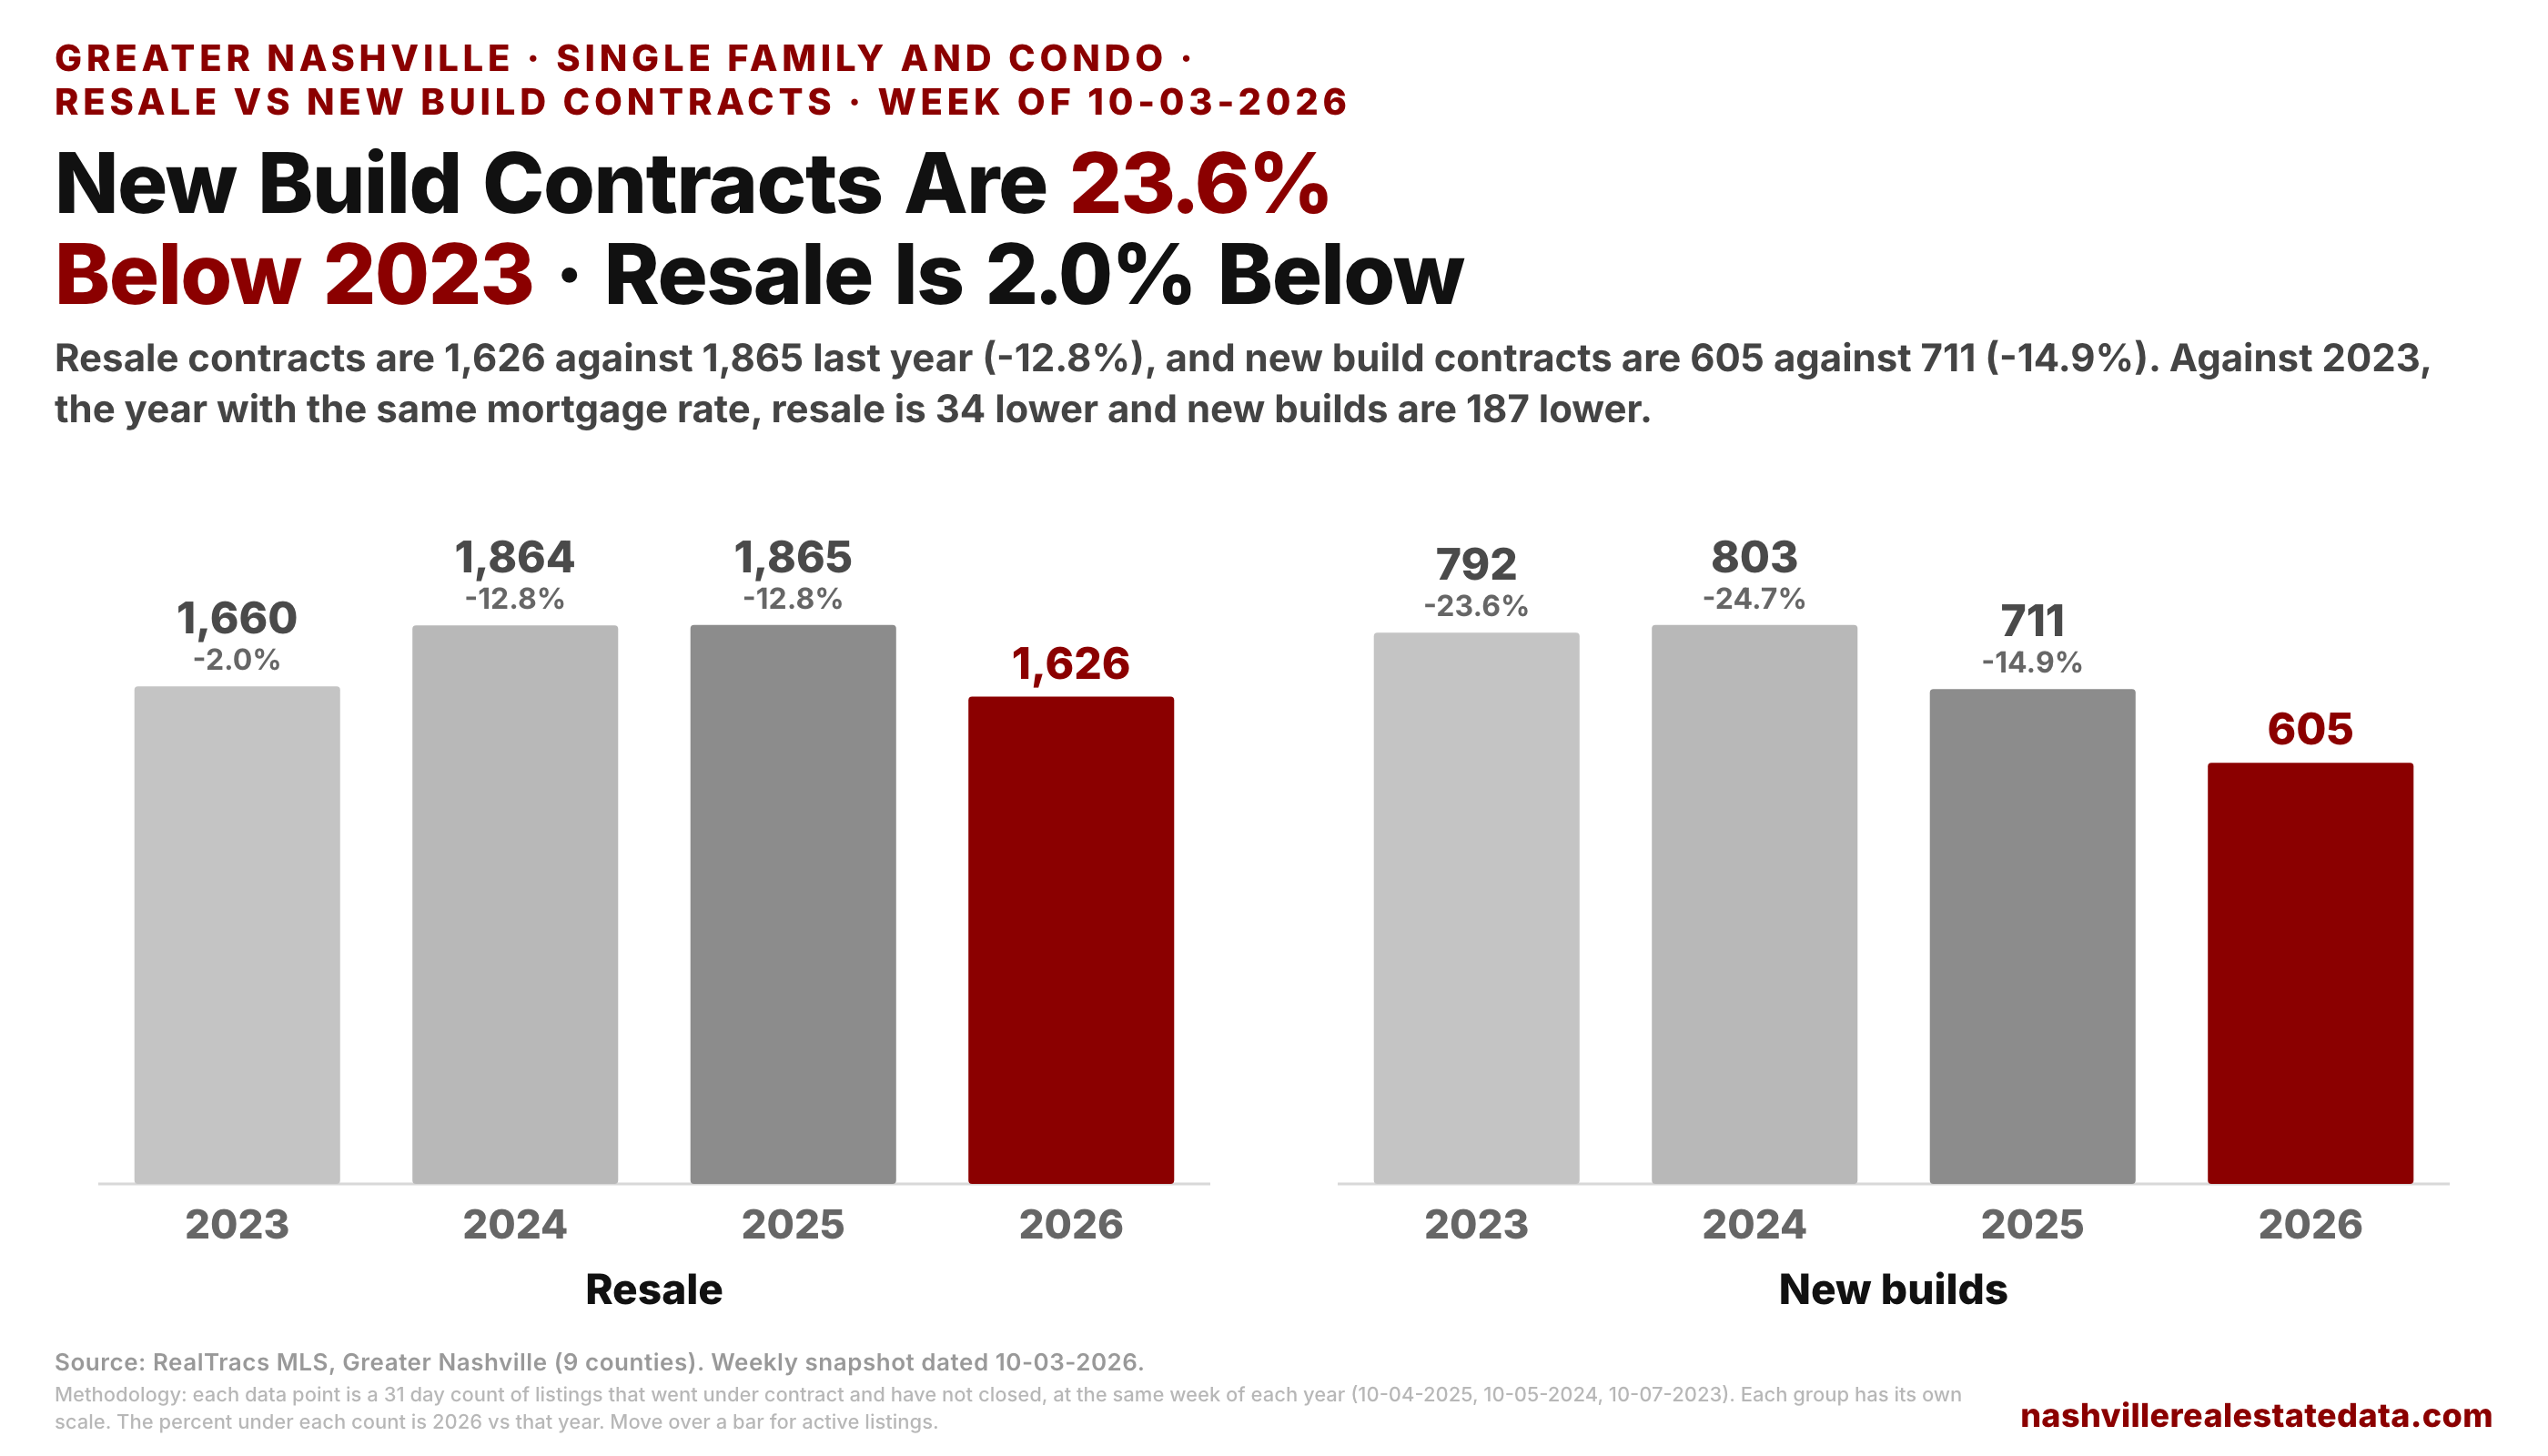
Both vs last year. Resale contracts are 1,626 against 1,865 last year (-12.8%), and new build contracts are 605 against 711 (-14.9%). Resale is 239 of the 345 contract gap vs 2025 and new builds are 106.
Against 2023, the year with the same mortgage rate, most of the decline is new builds. Resale contracts are 2.0% below 2023 (1,626 vs 1,660), and new build contracts are 23.6% below (605 vs 792). New builds are 187 of the 221 contract gap vs 2023.
Resale listings rose while new build listings fell. Resale active listings are 9,515, up 13.9% from last year's 8,357. New build active listings are 2,804, down 7.7% from 3,038.
8. How many active listings are there per contract?
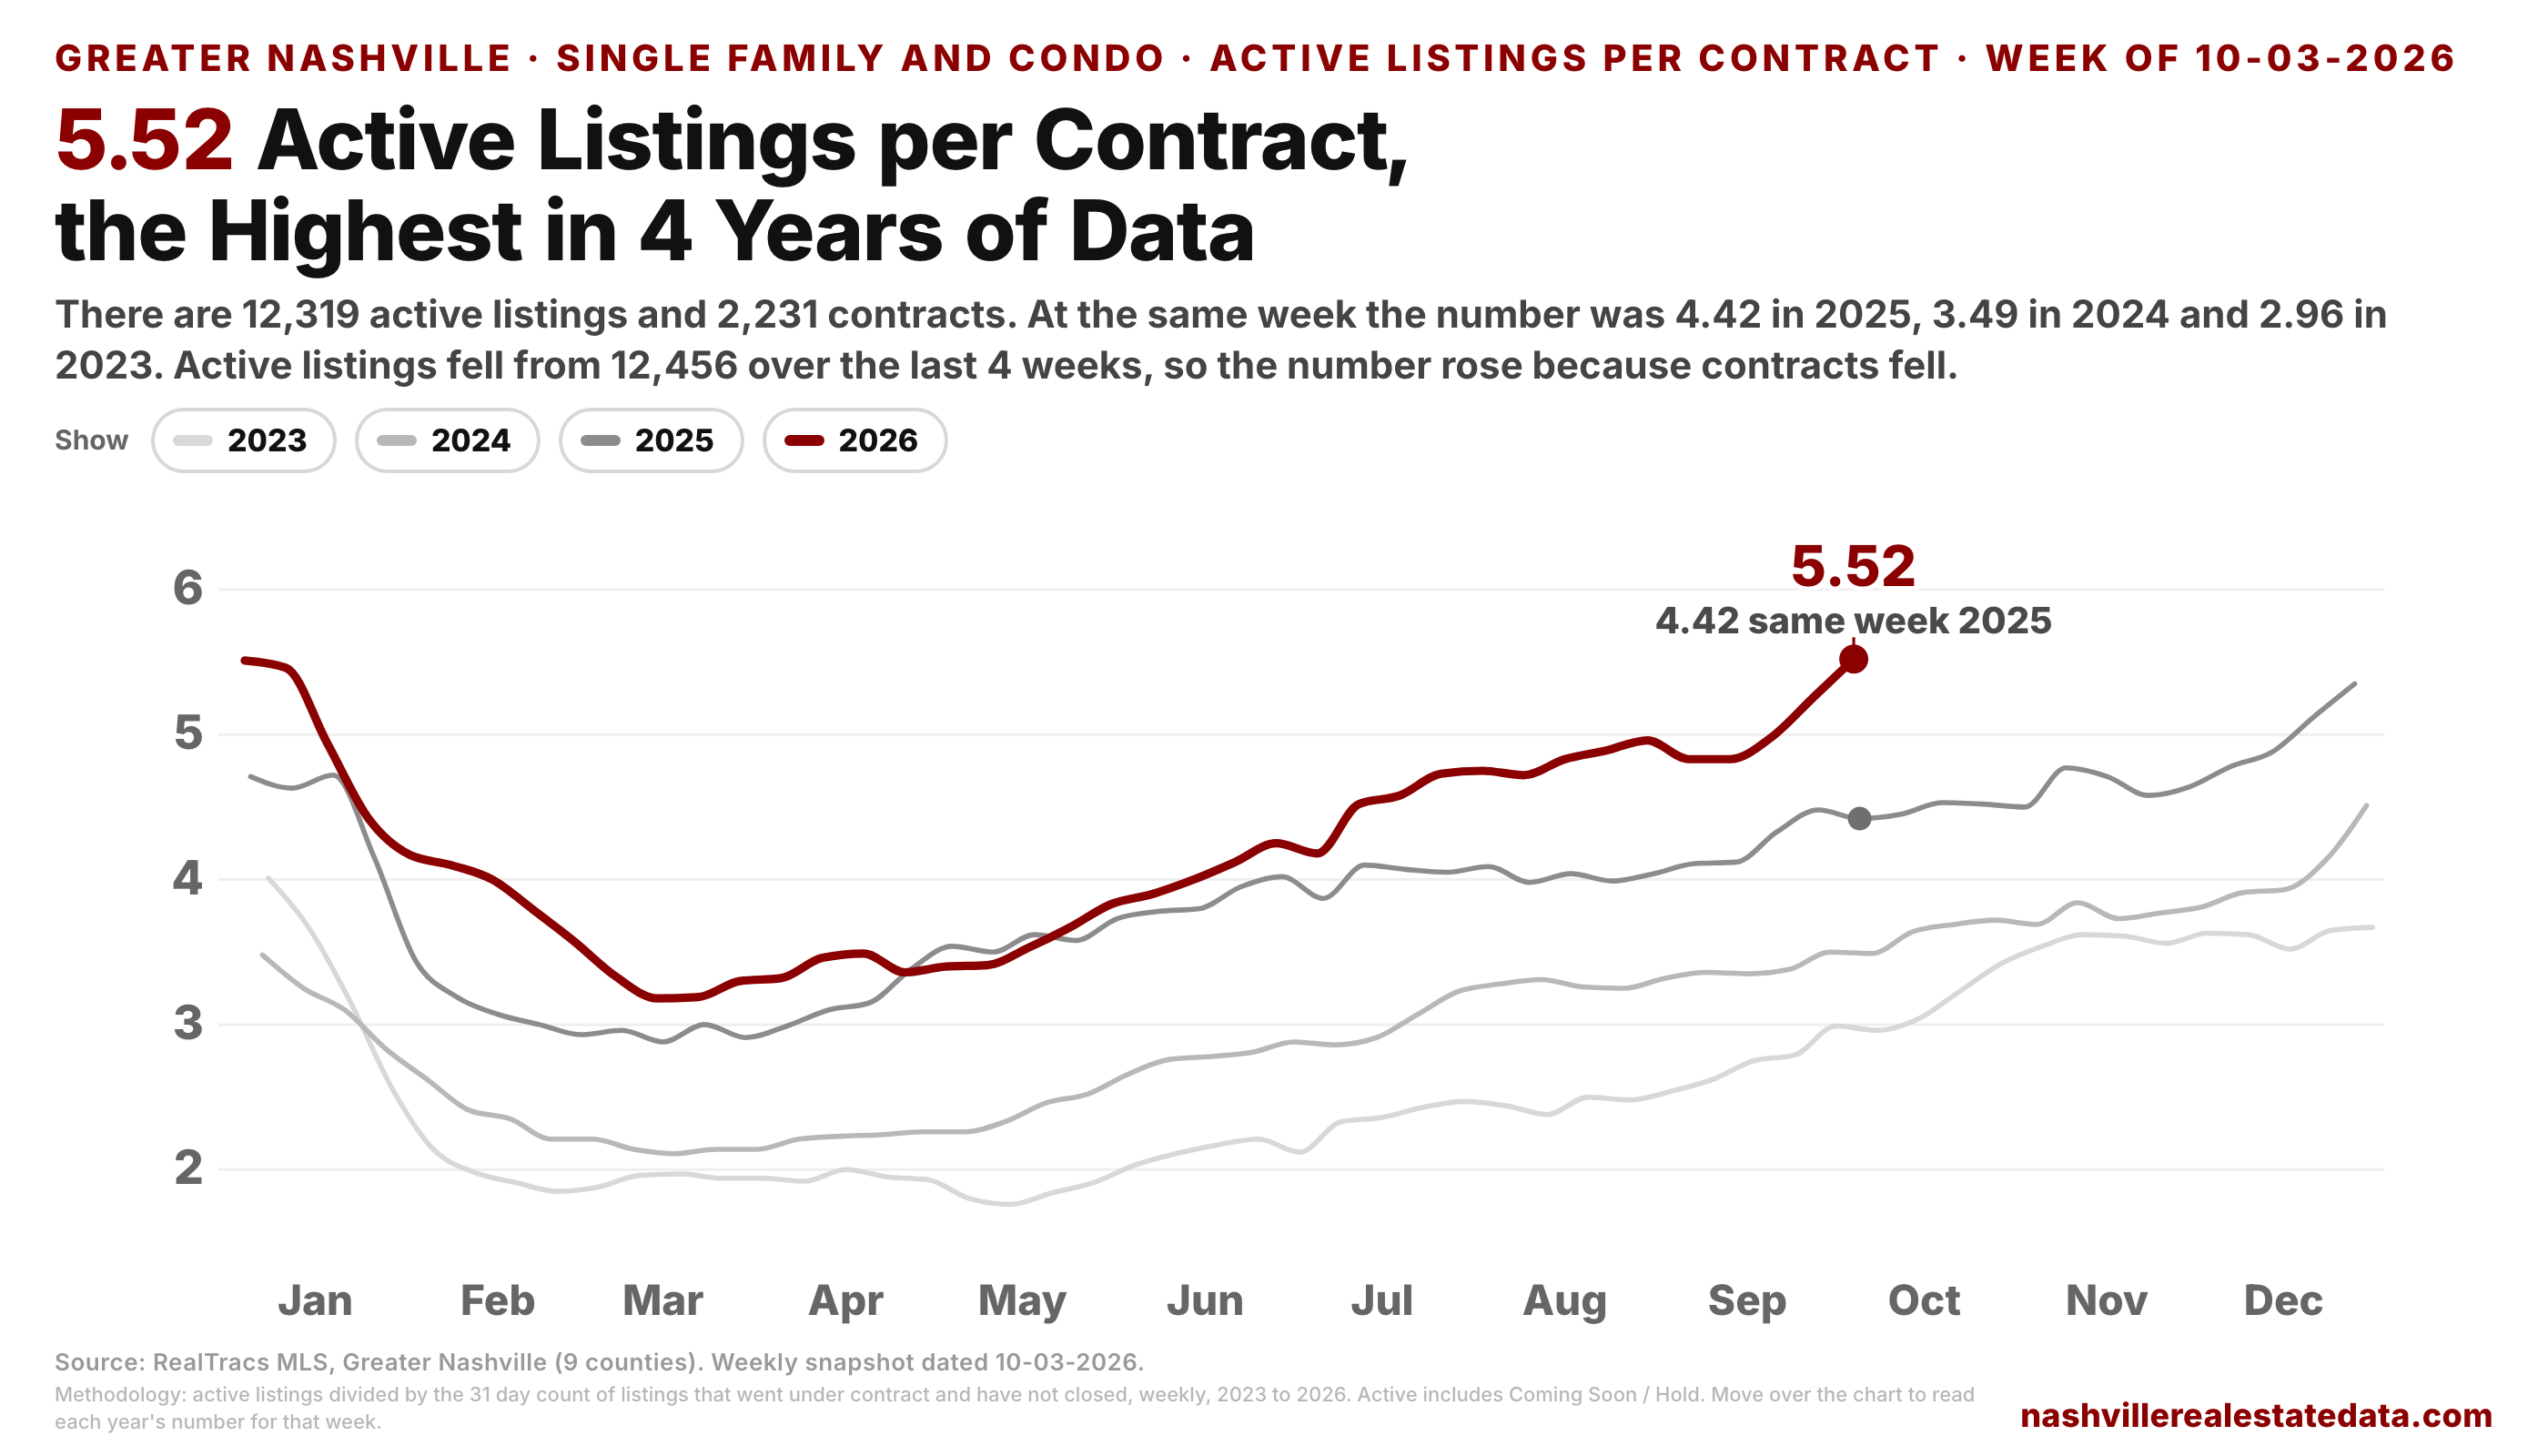
There are 12,319 active listings and 2,231 contracts, or 5.52 active listings per contract. At the same week the number was 4.42 in 2025, 3.49 in 2024 and 2.96 in 2023. 5.52 is the highest of any week in the 4 years of data.
The number rose because contracts fell. Active listings went from 12,456 to 12,319 over the 4 weeks, and they are still 8.1% above last year.
9. How many listings have a price cut?
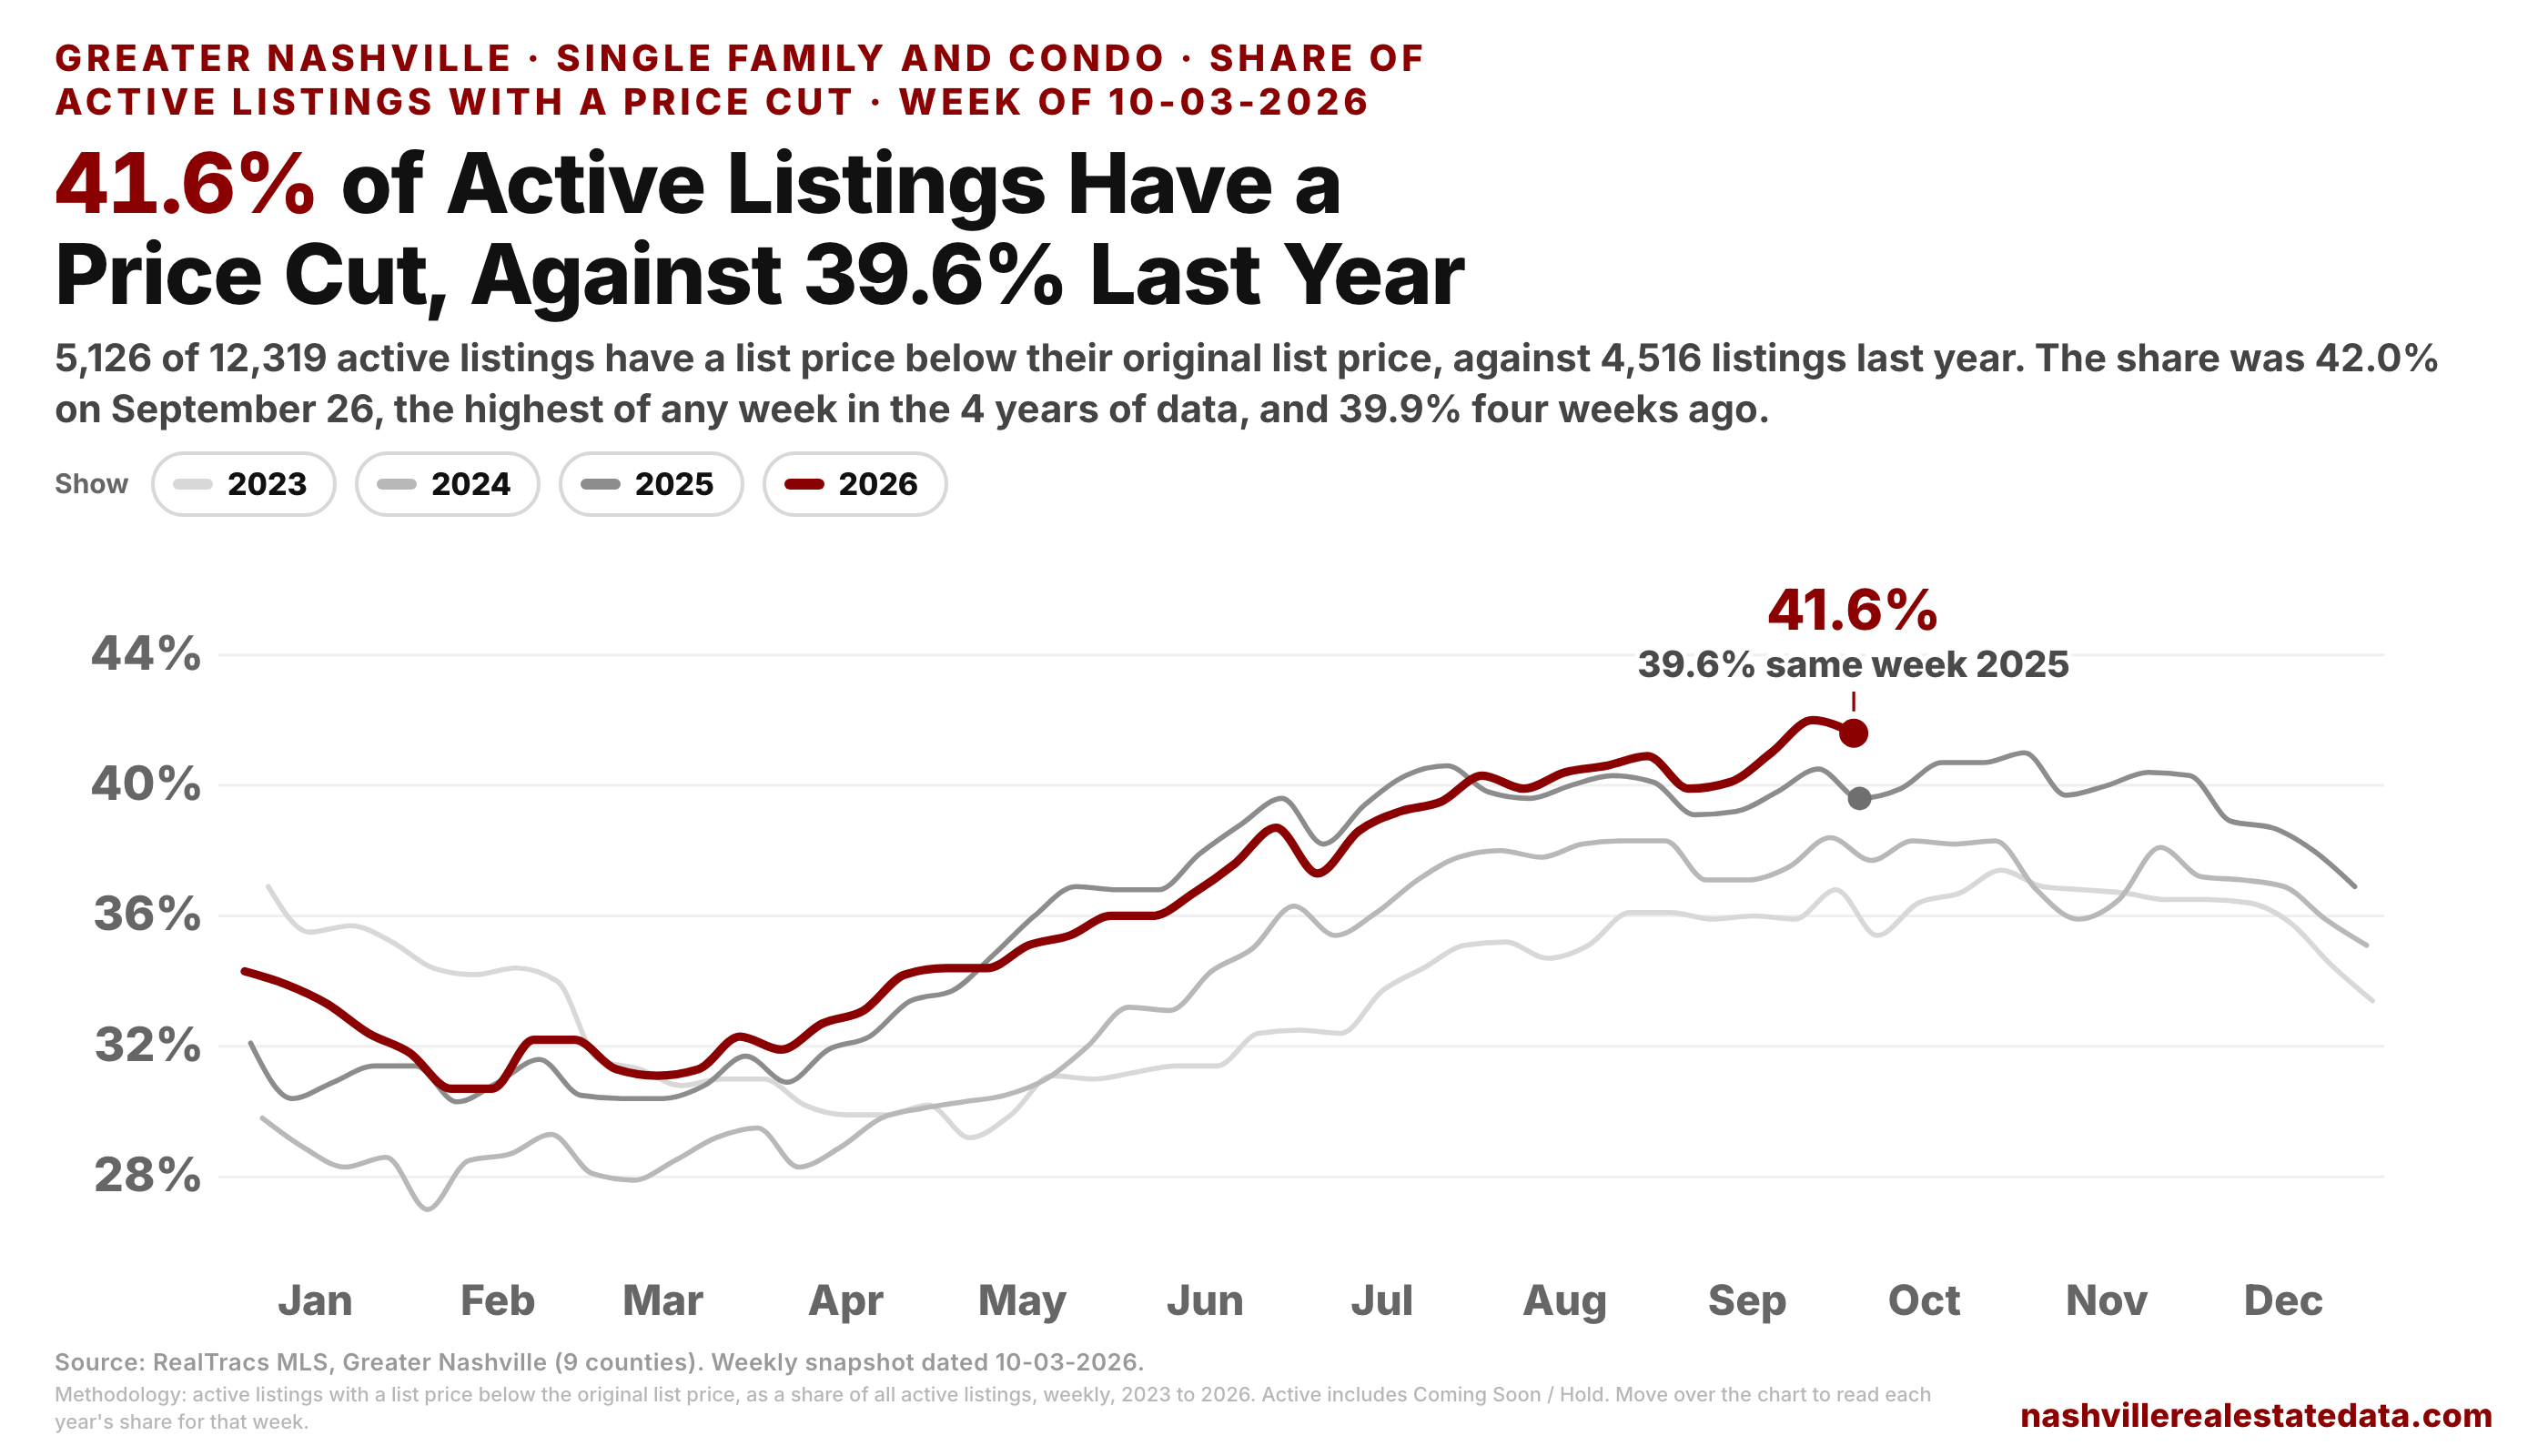
41.6% of active listings have a list price below their original list price, against 39.6% at the same week of 2025, 37.7% in 2024 and 35.4% in 2023. That is 5,126 listings, against 4,516 last year (+13.5%). The share was 42.0% on September 26, the highest of any week in the 4 years of data, and it was 39.9% four weeks ago.
Resale listings are at 47.3% (46.6% last year) and new build listings are at 22.3% (20.4% last year). Of the six Single Family price bands, $300K to $500K rose the most: 47.1% of its listings have a price cut, against 41.3% last year (1,484 listings vs 1,239). That is the band with the largest contract decline. $750K to $1M, the band where contracts fell the least, went from 40.3% to 36.5%.
By county, Sumner is at 46.6% against 39.3% last year, Rutherford is at 42.2% against 38.8%, and Davidson is at 42.9% against 41.3%.
10. Did the contract price per square foot fall?
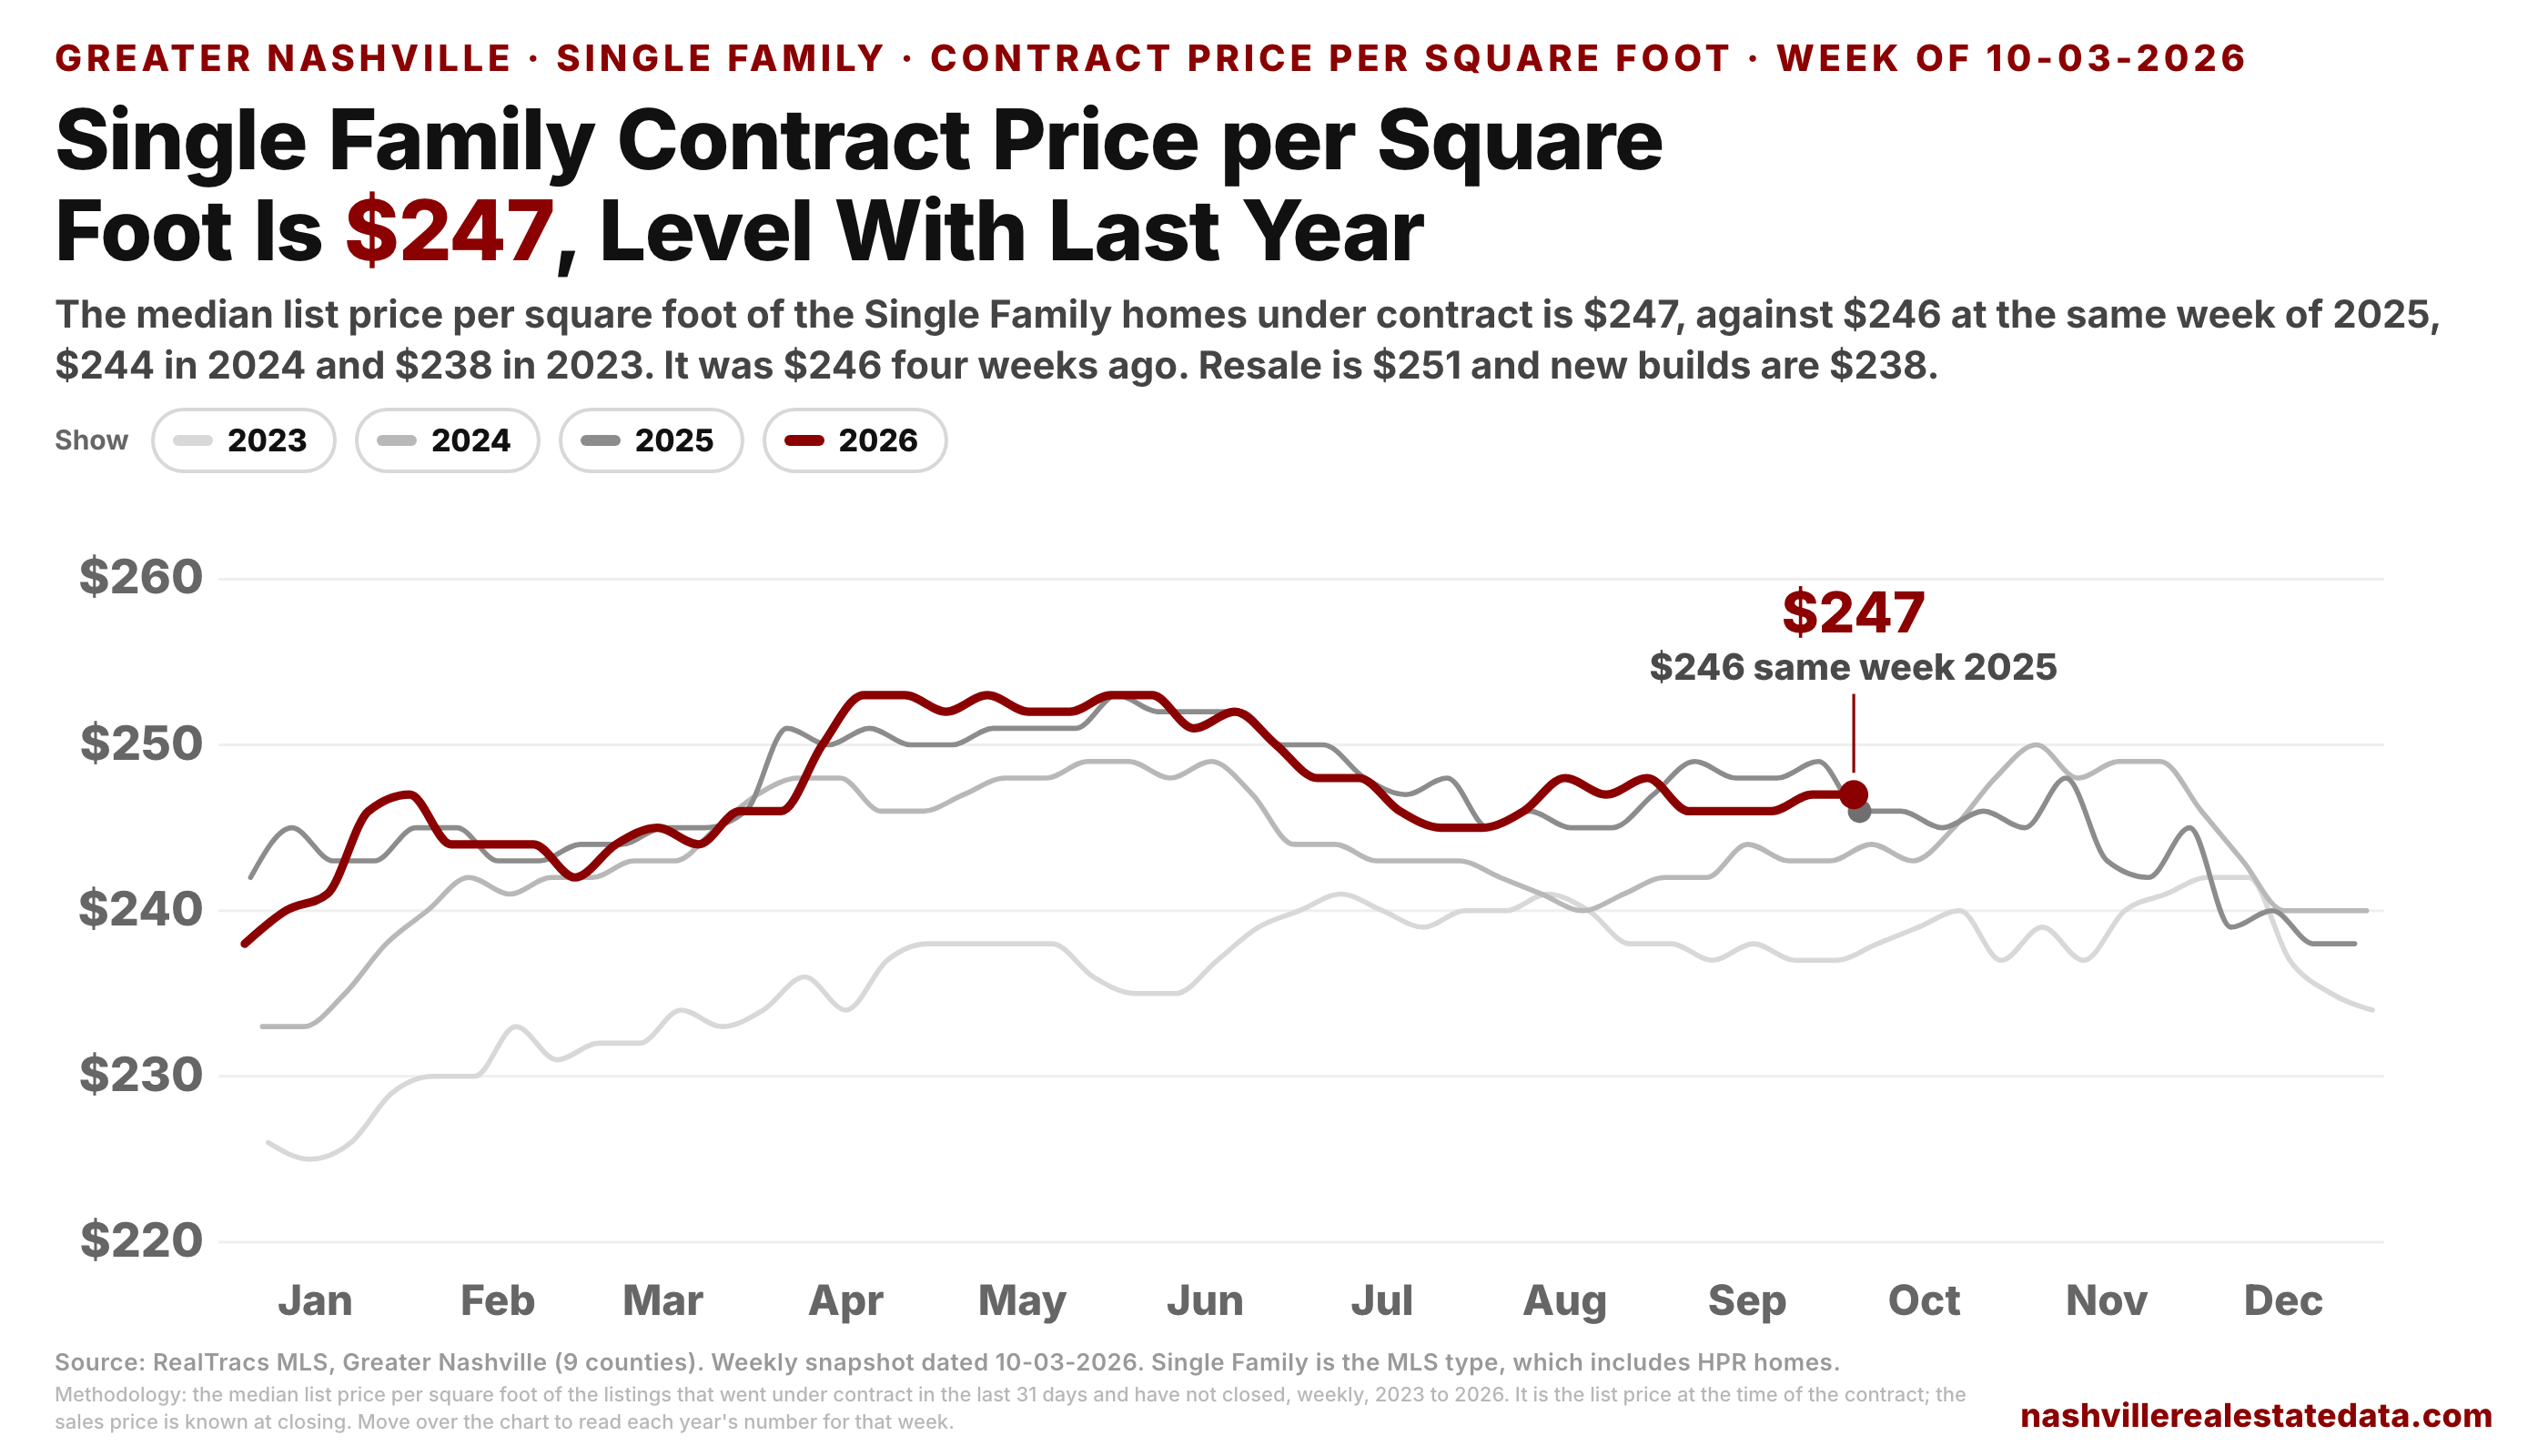
For Single Family, no. The median list price per square foot of the Single Family homes under contract is $247, against $246 at the same week of 2025, $244 in 2024 and $238 in 2023. It was $246 four weeks ago. Resale is $251, the same as last year, and new builds are $238 against $236. The median list price of the Single Family homes under contract is $520K, against $515K last year. Contracts are 13.4% lower and more listings have a price cut, and the Single Family homes that do go under contract are at the same price per square foot as last year.
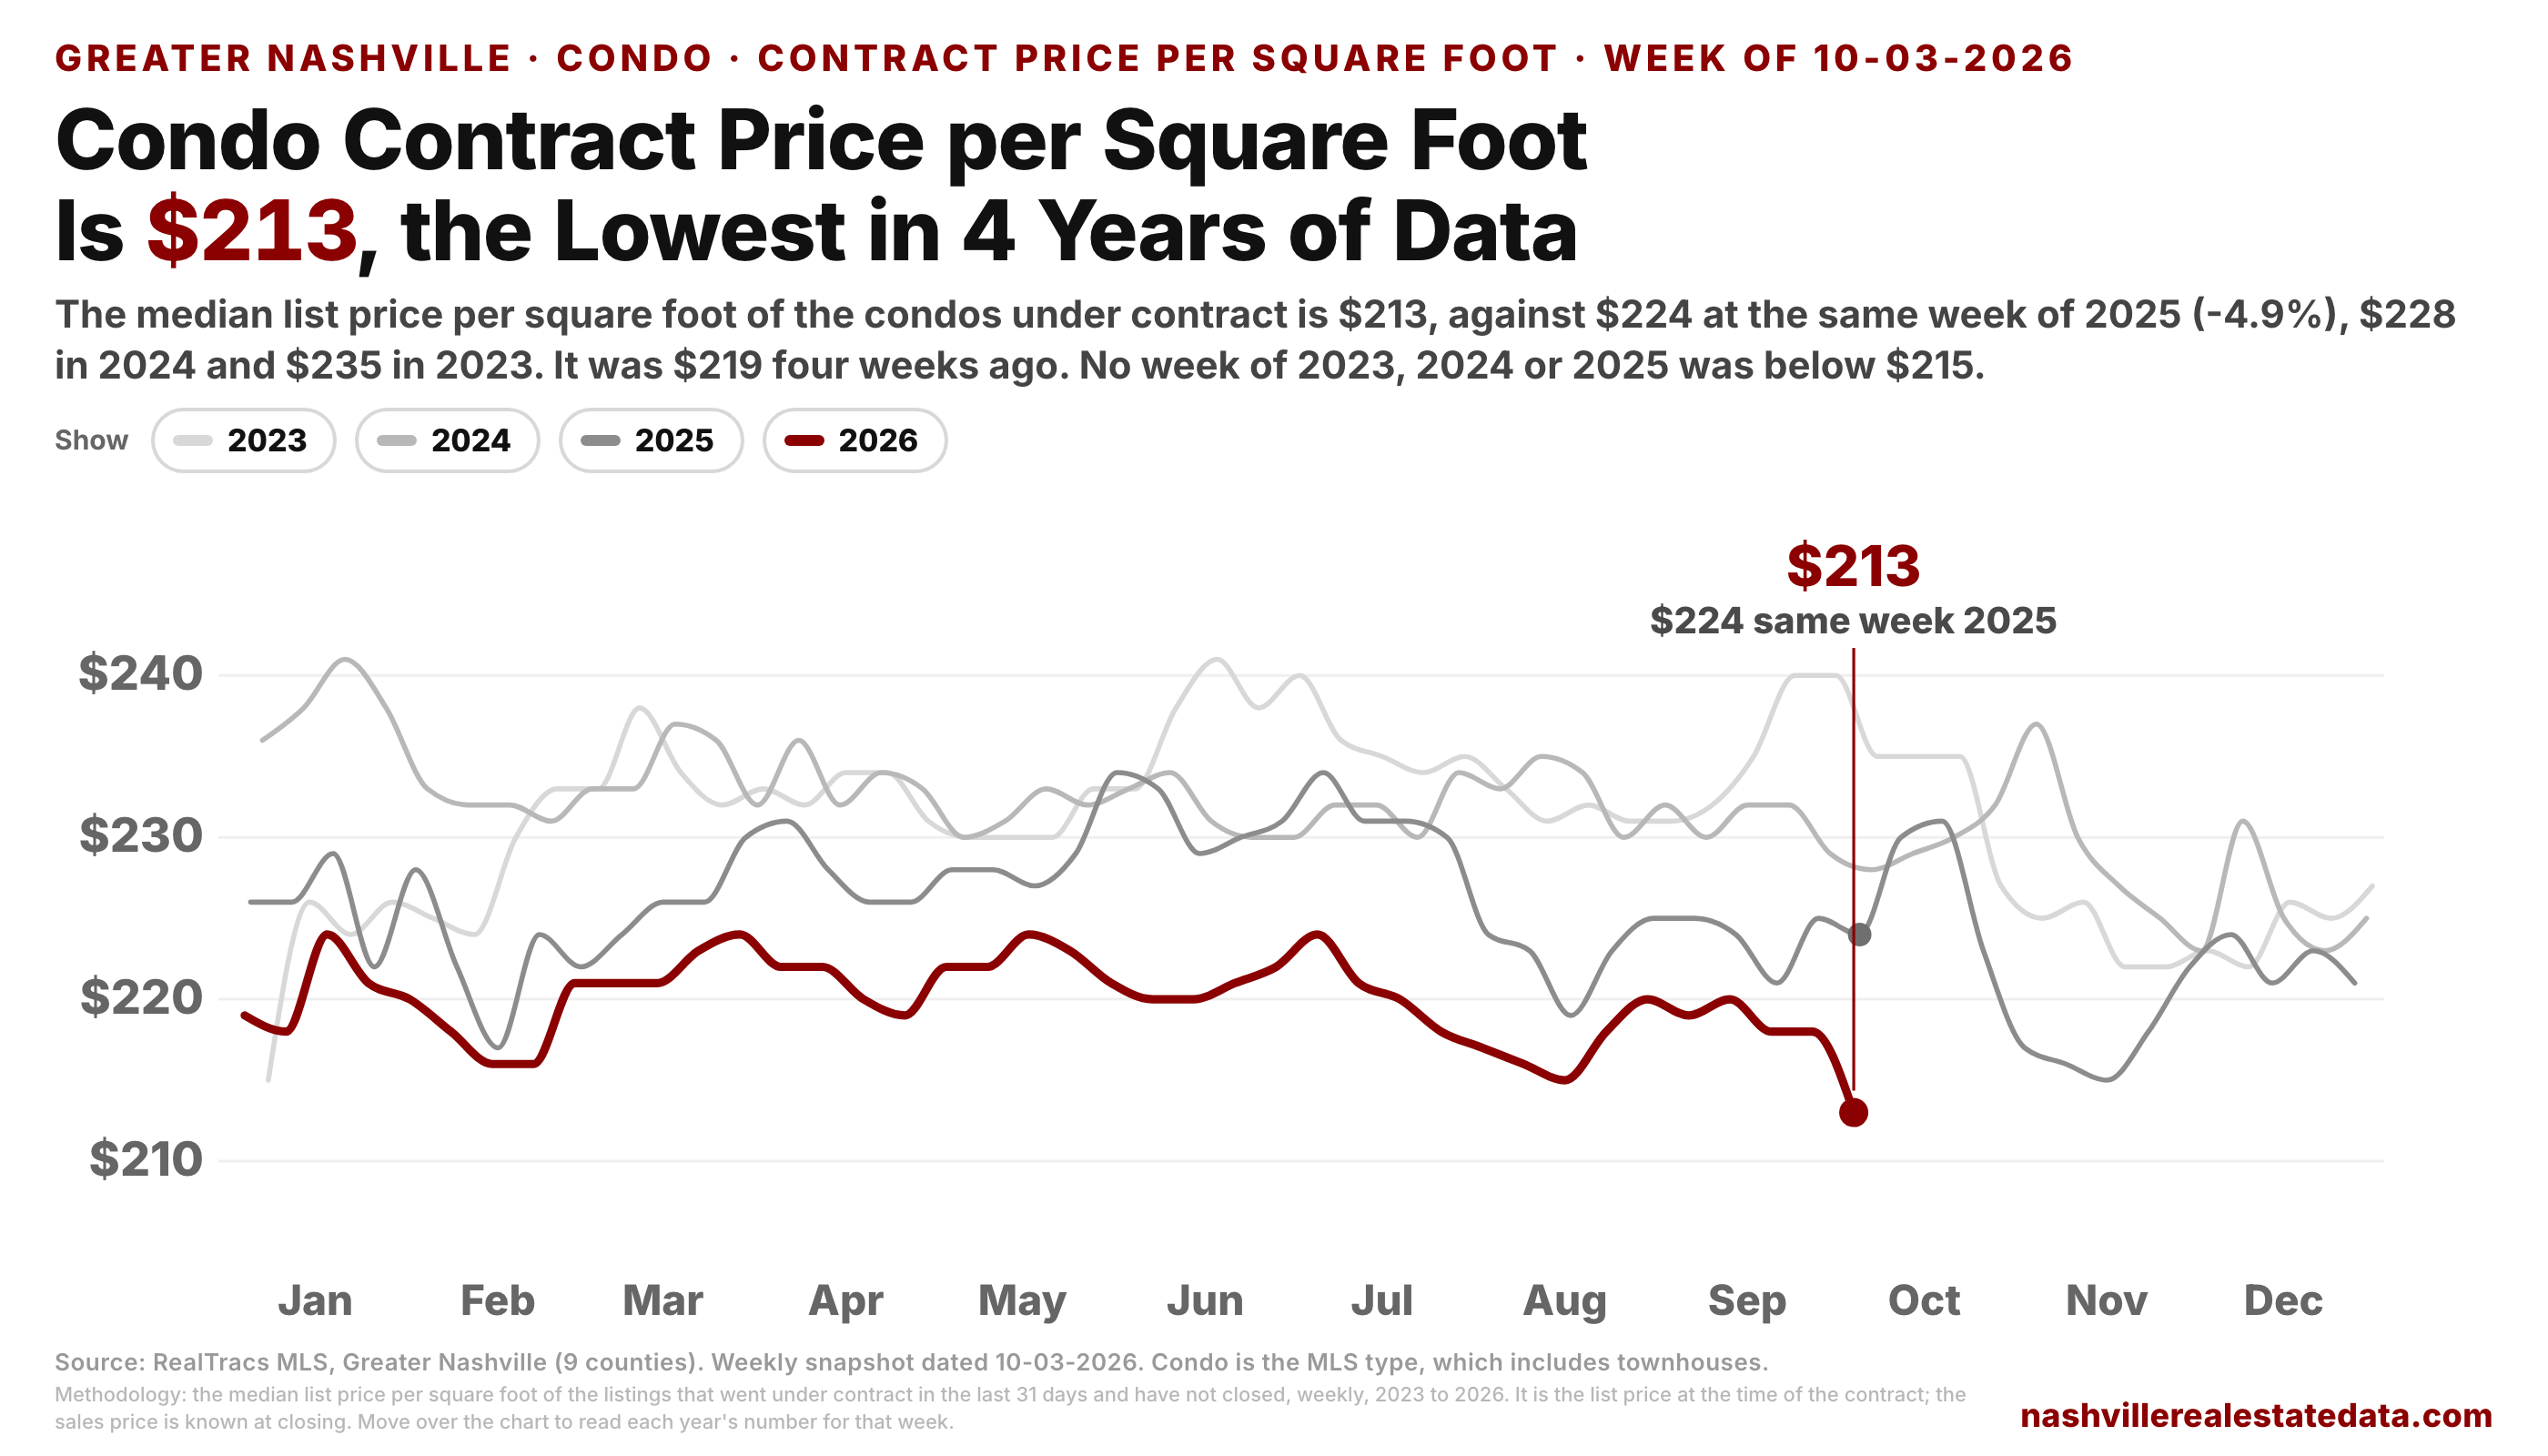
For condos, yes. The condo number, which includes townhouses, is $213, against $224 last year (-4.9%), $228 in 2024 and $235 in 2023. It was $219 four weeks ago. $213 is the lowest of any week in the 4 years of data. No week of 2023, 2024 or 2025 was below $215.
These are list prices at the time of the contract. The sales price is known at closing.
11. Have closings fallen yet?
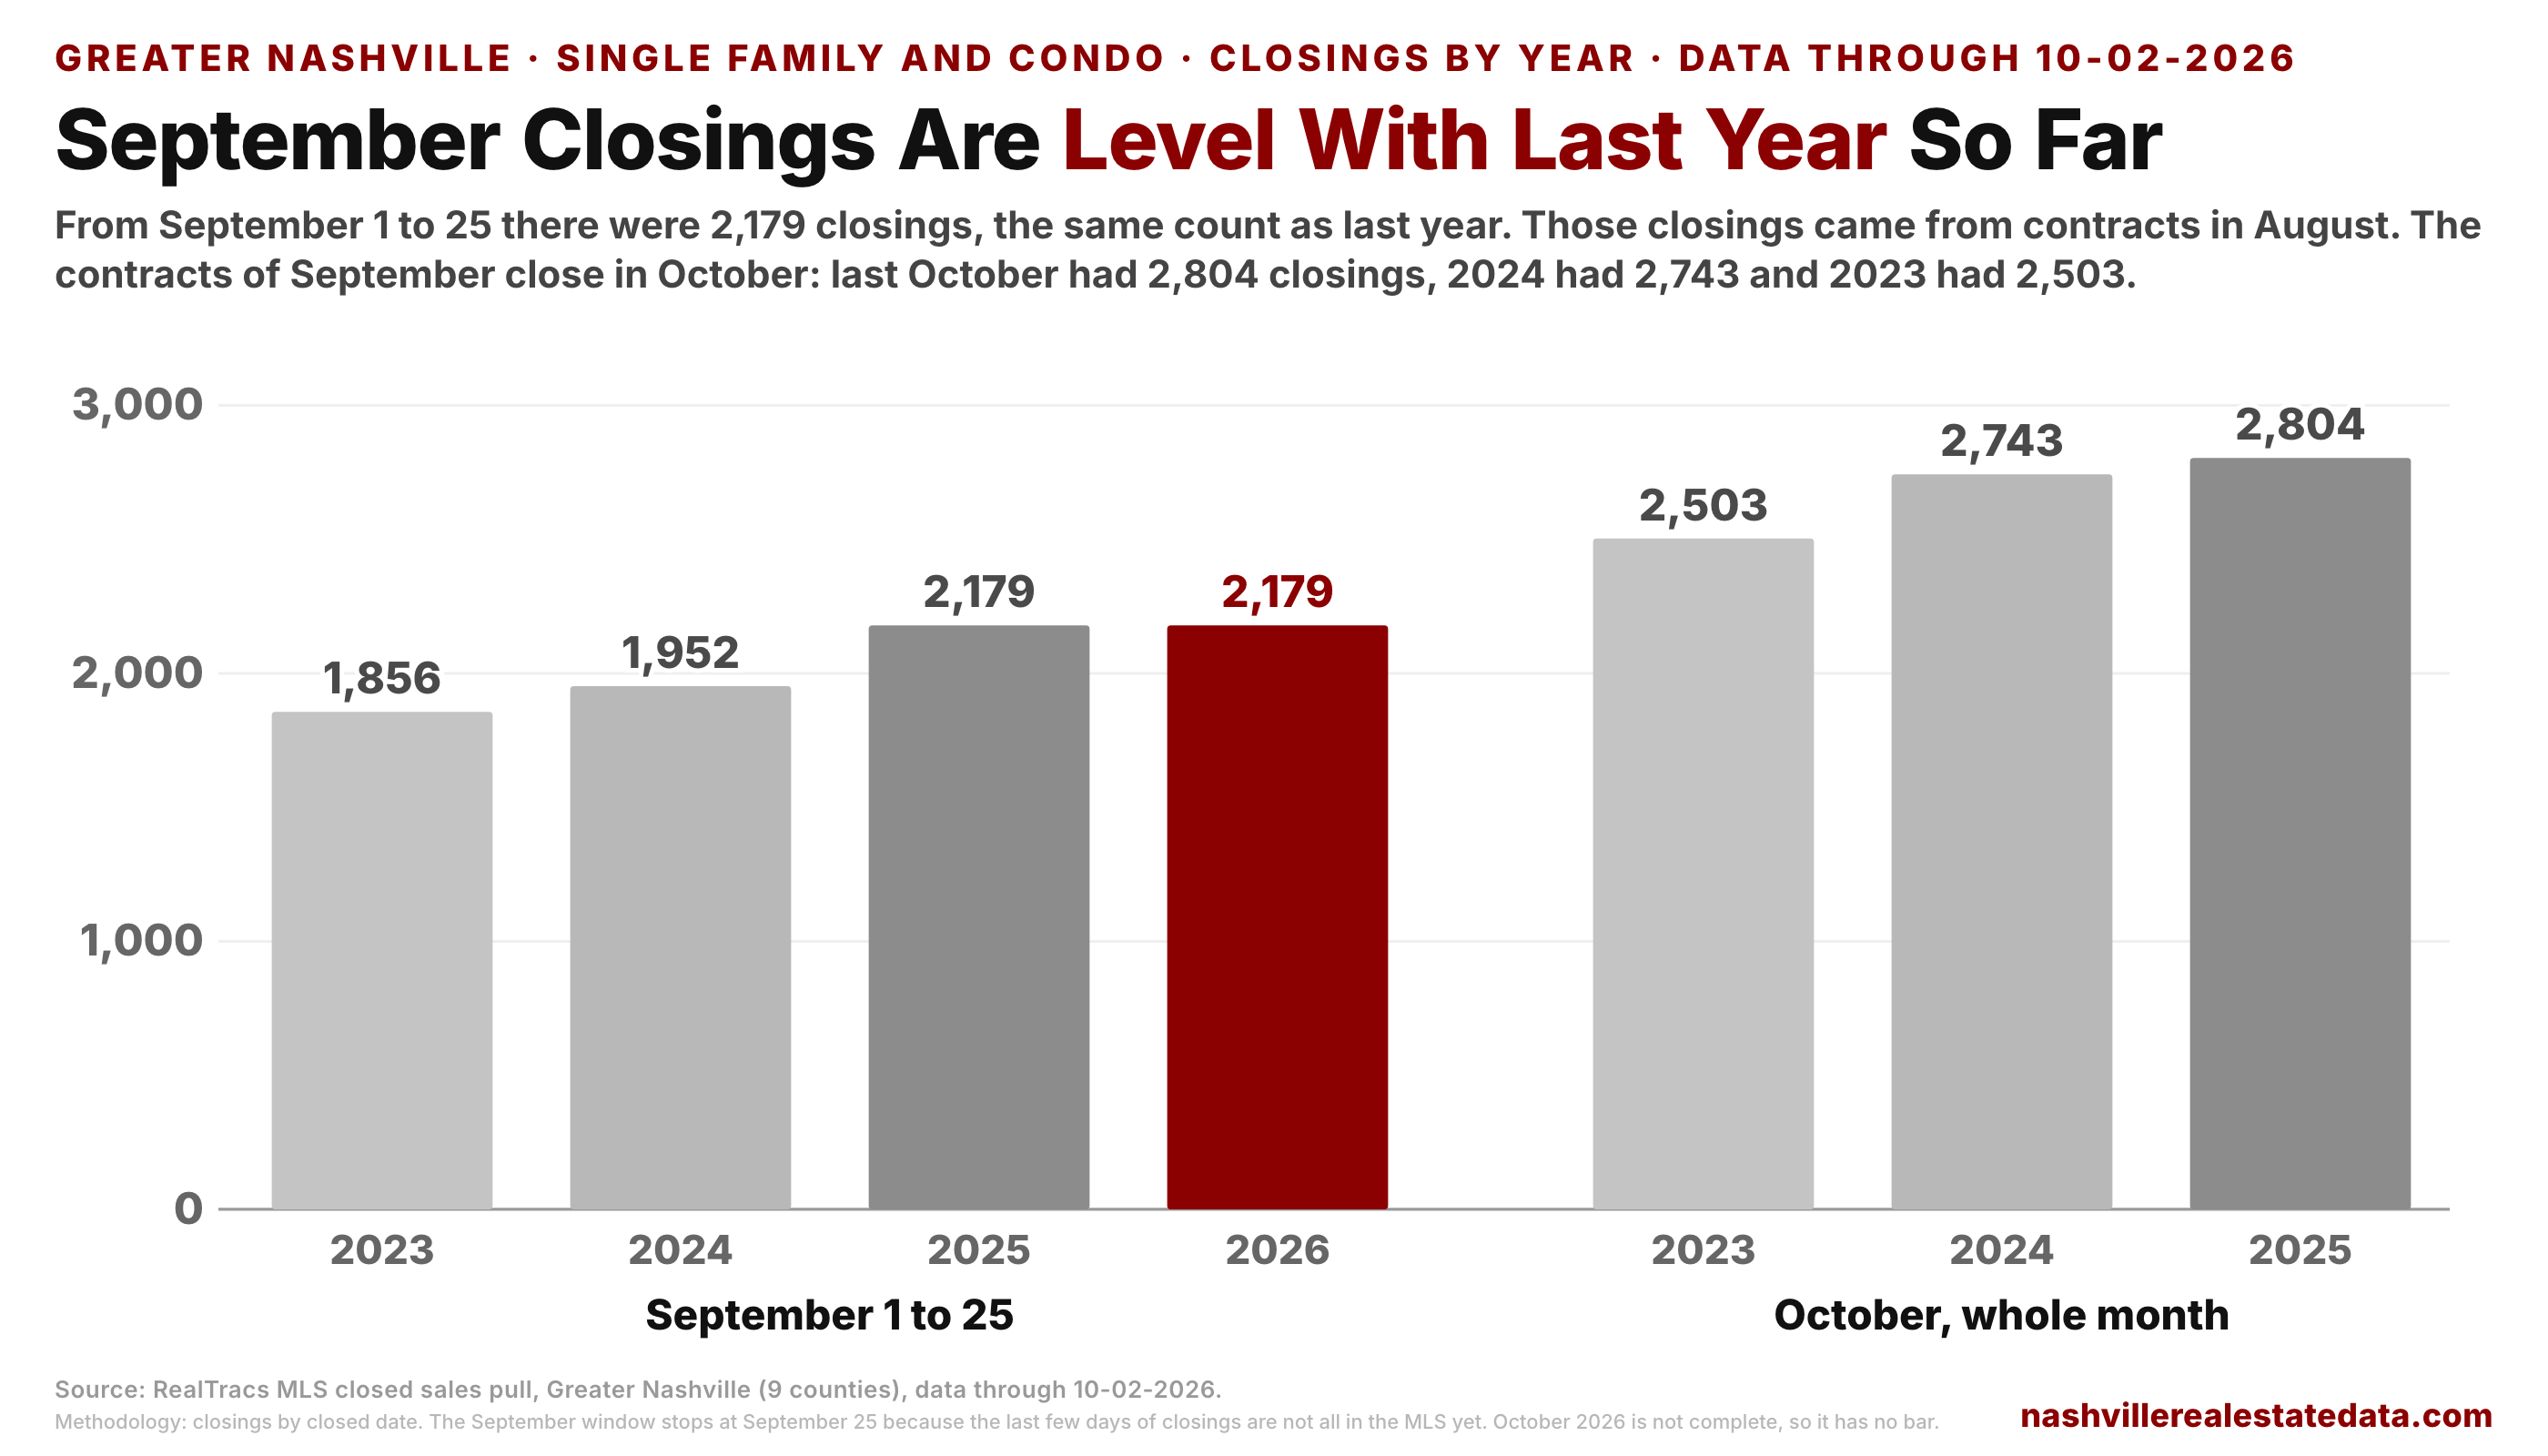
Not yet. From September 1 to 25 there were 2,179 closings, the same count as last year and above 1,952 in 2024 and 1,856 in 2023. The window is cut off at September 25 because the last few days of closings are not all in the MLS yet. Those closings came from contracts in August, before most of the rate rise.
The contracts of September close in October. Last October had 2,804 closings, 2024 had 2,743 and 2023 had 2,503, the lowest October in the closed sales data, which starts in 2020.
Adding it up
- Contracts are 2,231, down 13.4% from last year and 16.3% from 2024, the largest declines of any week in 2026, and the lowest count since January 31.
- The 30 year mortgage rate went from 6.75% to 7.57% in 5 weeks. Contracts are 9.0% below 2023, the year with the same rate, with 69.7% more active listings.
- 2026 lost 13.4% of its contracts in 4 weeks, more than 2023 (9.8%), 2025 (7.2%) or 2024 (1.5%). With contracts that already closed added in, the total is 11.6% below last year.
- Davidson is 18.8% below last year and is 151 of the 345 contract gap. Sumner and Maury went from above last year to 14% to 17% below in 4 weeks.
- Single Family contracts from $300K to $750K are 231 of the 298 Single Family gap. Under $300K fell back to 153.
- Single Family is 14.3% below last year. Townhouses and HPR-Attached homes fell 22.4% in 4 weeks, the most of the three property types, while condos rose.
- Resale contracts are 2.0% below 2023 and new build contracts are 23.6% below it. There are 5.52 active listings per contract, the highest of any week in the 4 years of data.
- 41.6% of active listings have a price cut, against 39.6% last year. The Single Family contract price per square foot is $247, level with last year, and the condo number is $213, the lowest in the 4 years of data.
What to watch: I expect October closings to come in below last October's 2,804. If they are under 2,600, closings are down more than 7% from last October. For contracts, the data point to watch is October 31. In 2023 the rate went to 8% and the count was 2,212 on October 28. If the rate stays near 7.5% and the 2026 count is still below the 2023 line at the end of October, demand is lower than in 2023 at a lower rate. If the rate falls back under 7.25% and the count goes back above 2,400, the September drop came from the rate.
Data through the week of 10-03-2026, Greater Nashville (9 counties: Davidson, Williamson, Rutherford, Wilson, Sumner, Maury, Dickson, Cheatham, Robertson). Each weekly data point is a 31 day count of listings that went under contract and have not closed, at the same week each year (10-04-2025, 10-05-2024 and 10-07-2023). The already closed contracts in chart 3 and the three property types in chart 6 come from the daily MLS data on the same days. In chart 6, Single Family is the MLS Single Family type without its attached homes; the townhouse type is townhouses plus HPR-Attached and the other attached Single Family homes; condo is flat, garden, loft, high-rise and other condos. In chart 5, Single Family is the MLS type, which includes HPR-Attached homes. Price bands use the list price. A price cut is an active listing with a list price below its original list price. The contract price per square foot is the median list price per square foot of the listings under contract; in charts 10 and 11 Single Family and condo are the MLS types, and condo includes townhouses. Closings are from the closed sales pull with data through 10-02-2026. Mortgage rates are the Mortgage News Daily 30 year fixed rate, data through 10-02-2026. Source: RealTracs MLS; Mortgage News Daily.