154 houses listed under $300K are under contract this week, against 198 at the same week of 2025, 196 in 2024 and 202 in 2023. That is -22.2%, -21.4% and -23.8%, the third straight reading below all three prior years and the longest such run of 2026. Two readings ago, on August 8, the band was still 6.4% above last year.
The metro-wide contract decline that began in mid-July has been widest in the market's cheaper half. This post covers the cheapest band: how the gap opened, what mortgage rates did, where the band sits against the others, the supply side, the condo side, and whether closings have followed.
1. How far did contracts on houses under $300K fall?
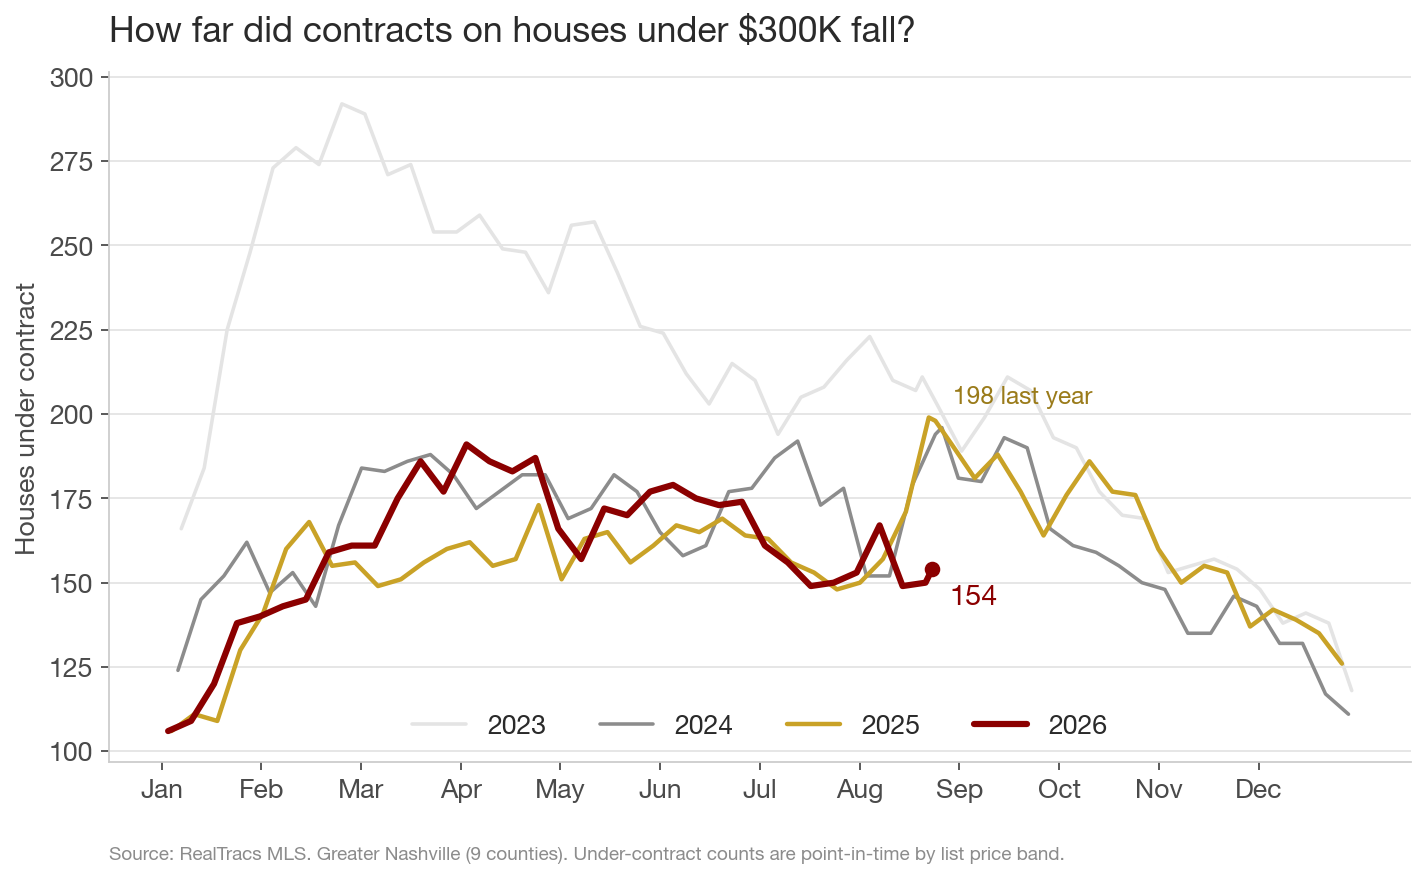
The 2026 count itself has barely moved: it has stayed between 149 and 167 since mid-July. What changed is the other side of the comparison. Over the same weeks, 2025 rose from 153 to 198 and 2024 rose from 173 to 196, while 2023 held above 200 all summer. The last two Augusts brought a late-summer rise in entry-level buying, and this August has not.
2. How fast did the gap open?
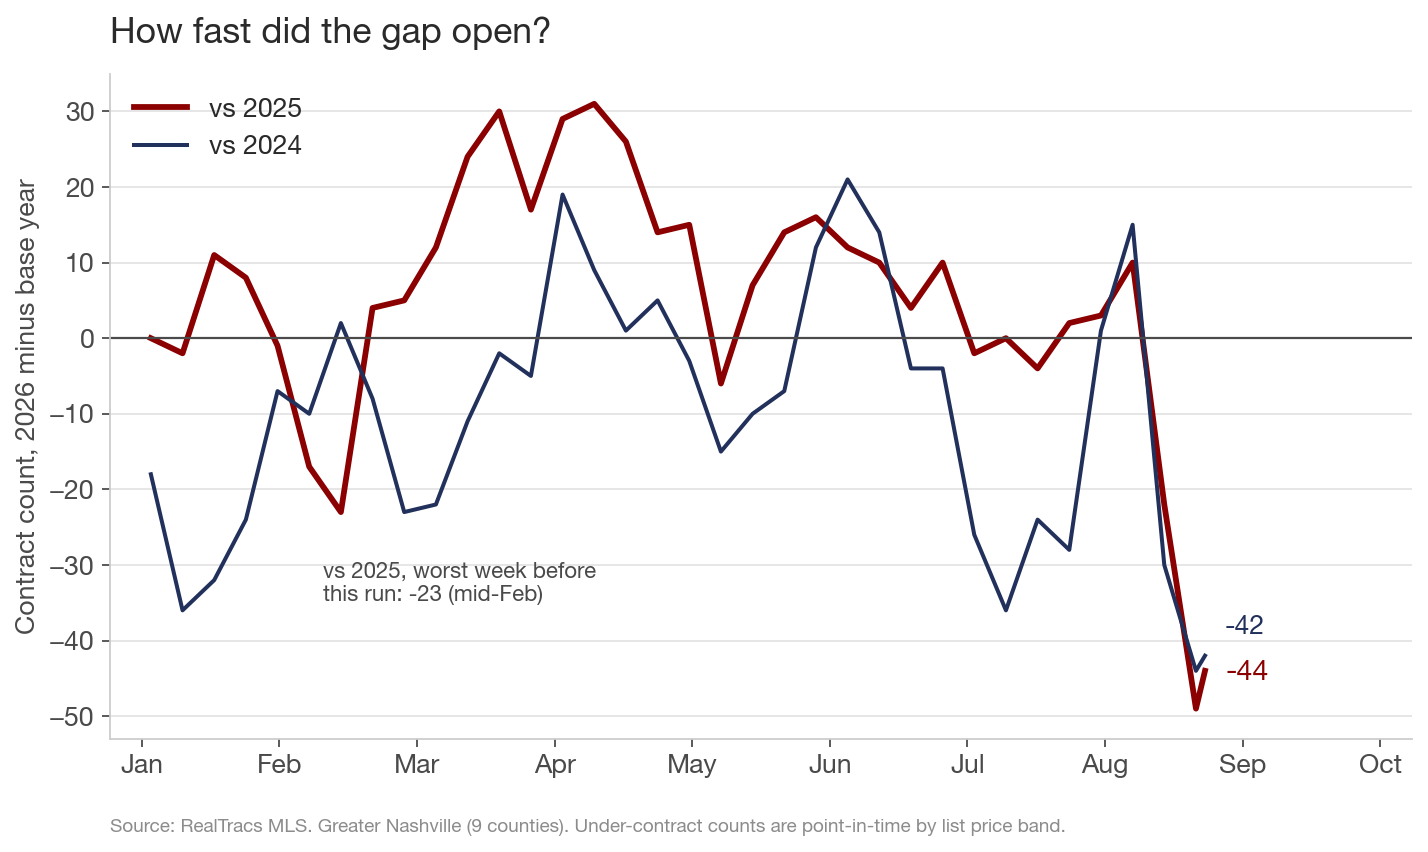
In two weeks. The August 8 reading was +10 contracts against 2025; the August 22 reading was -49, and this week is -44. Before this run, the deepest weekly shortfall of 2026 against last year was -23, in mid-February. Against 2024 the current gaps (-44, -42) are also the deepest of the year, past January's -36.
3. What are mortgage rates doing differently this August?
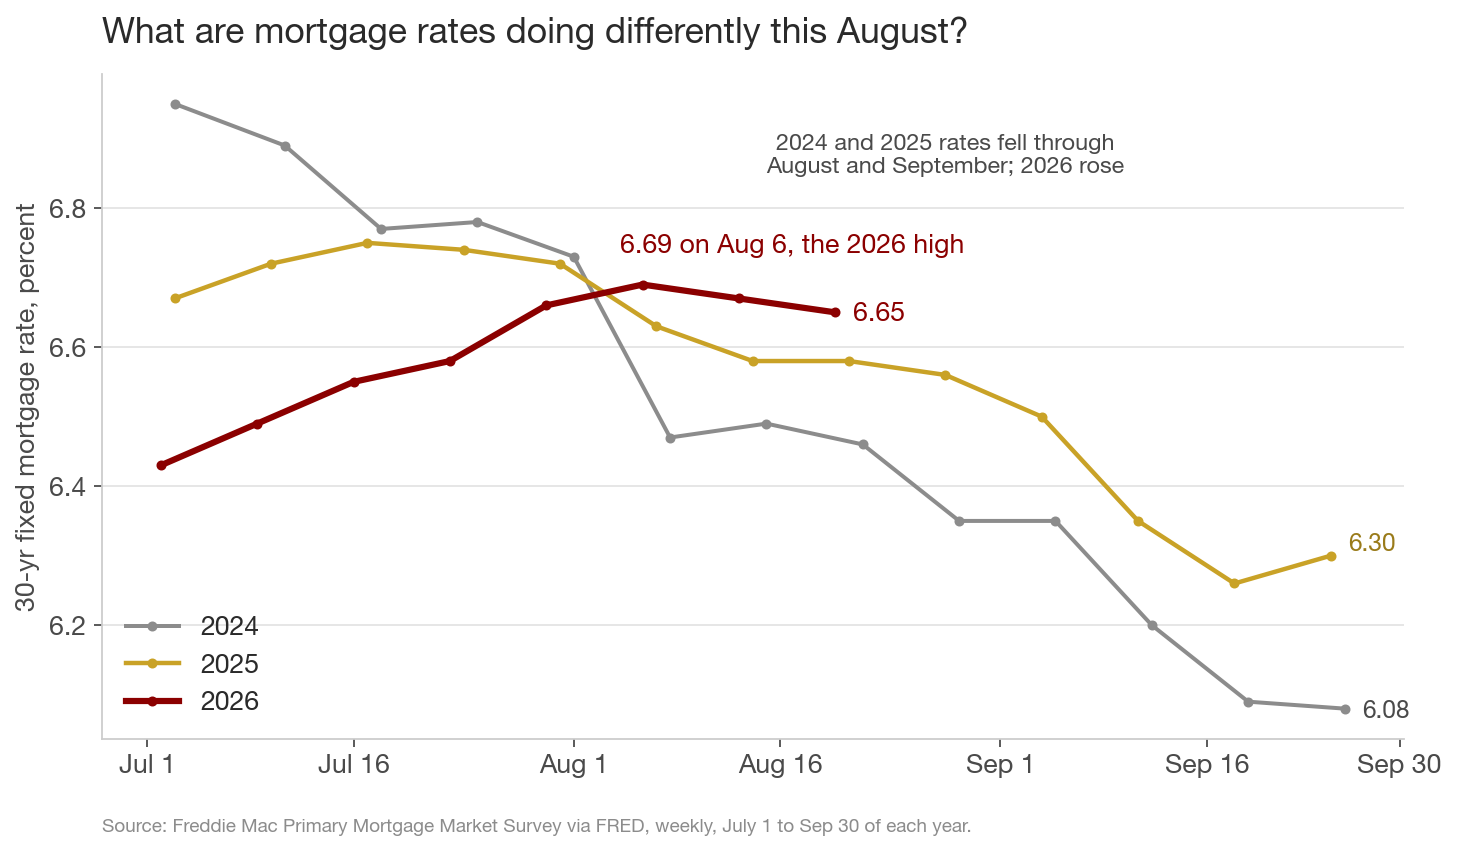
Rising instead of falling. In August 2024 the 30-year rate dropped from 6.73% to 6.35%, on its way to 6.08% by late September. In August 2025 it eased from 6.72% to 6.56%, reaching 6.26% by mid-September. This year the rate went from 6.43% in early July to 6.69% on August 6, the highest reading of 2026 and the highest in just over a year, and sits at 6.65% now. On a $300K purchase with 10% down, the July-to-August rate rise added about $46 a month in principal and interest. Buyers at this price point have the least room to absorb that, and the two prior Augusts show the same band responding quickly when rates moved the other way.
4. Is the weakness spread evenly across house price bands?
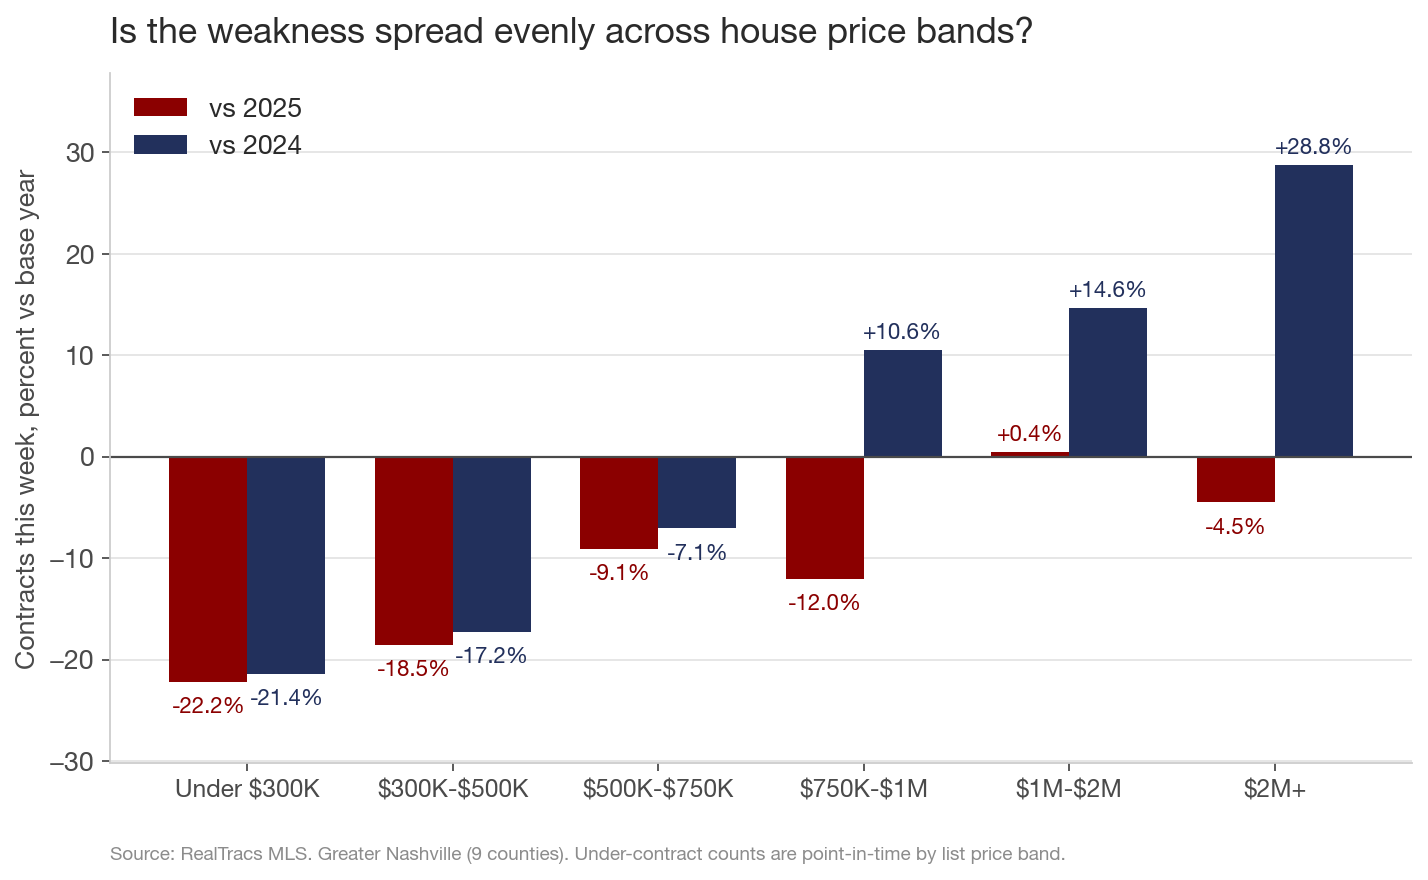
No. This week's under-$300K reading is the weakest of the six house price bands against 2025, 2024 and 2023 (on 4-week averages the two bands under $500K are the two weakest, at -14.5% and -15.9% vs 2025). The split by price is clean against 2024: every band under $750K is down, and every band from $750K up is higher, with $2M+ up 28.8%. In June the under-$300K band was still one of the growth bands, up 7.2% on last year.
5. Are there fewer houses under $300K to buy?
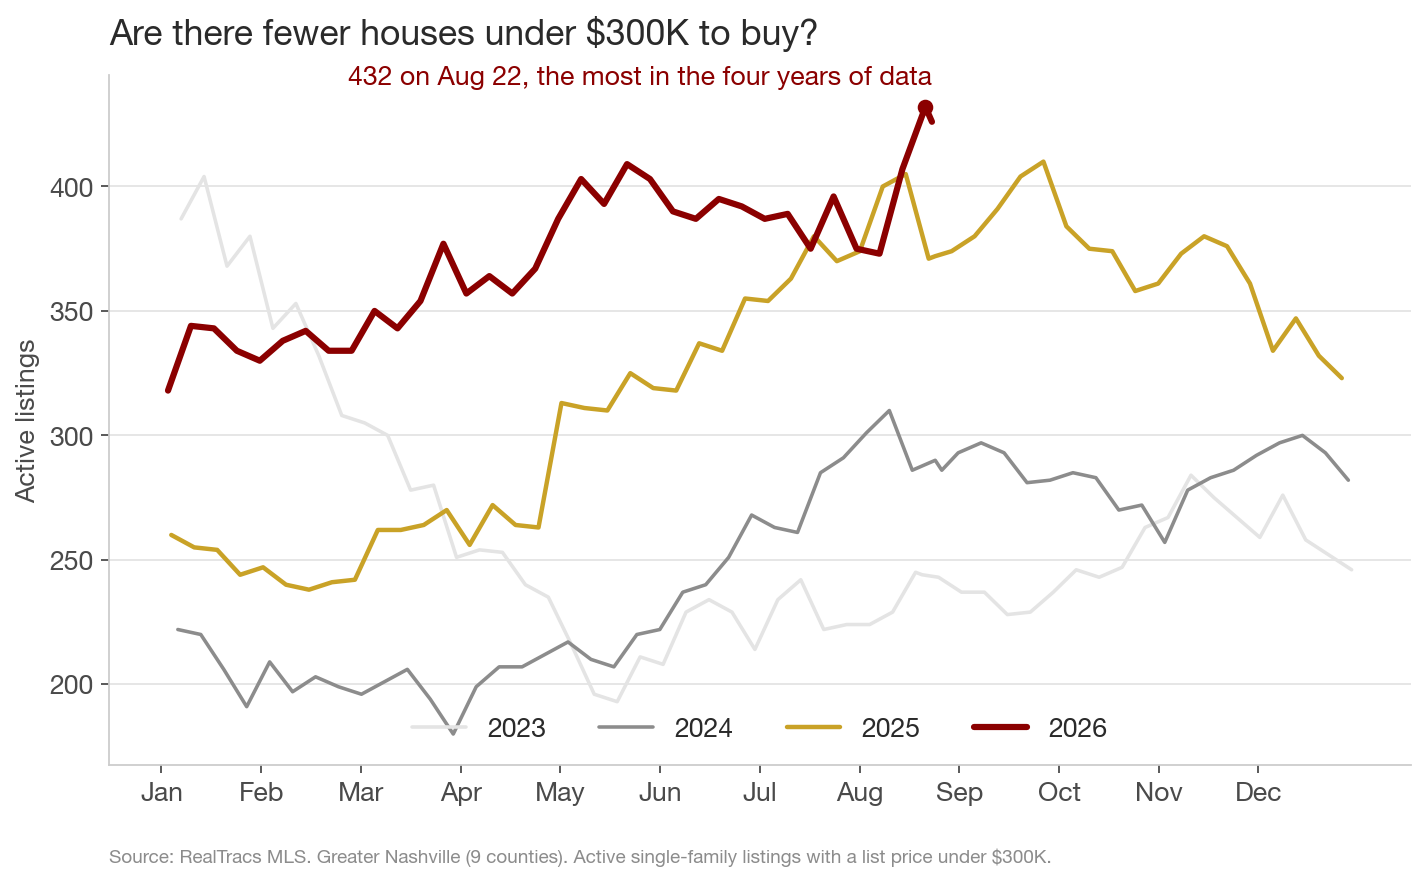
No, there are more than at any point in four years. Active listings in the band hit 432 on August 22 (the prior years' highest weeks were 404, 310 and 410) and stand at 426 now, up 75% from 243 at this week in 2023. The band's supply ratio is 2.8 actives per contract, still the lowest of the six house bands but up from 1.9 a year ago and 1.2 in 2023. 48.6% of the band's listings have a price cut, the highest share of any house band. So the contract drop is not a shortage of listings: the houses are there, and half of them are cutting price.
Davidson County accounts for the largest share of the drop: 35 contracts against 57 last year (-39%), which is half the metro gap on its own, while its under-$300K actives rose from 101 to 139.
6. Are entry-level buyers choosing condos instead?
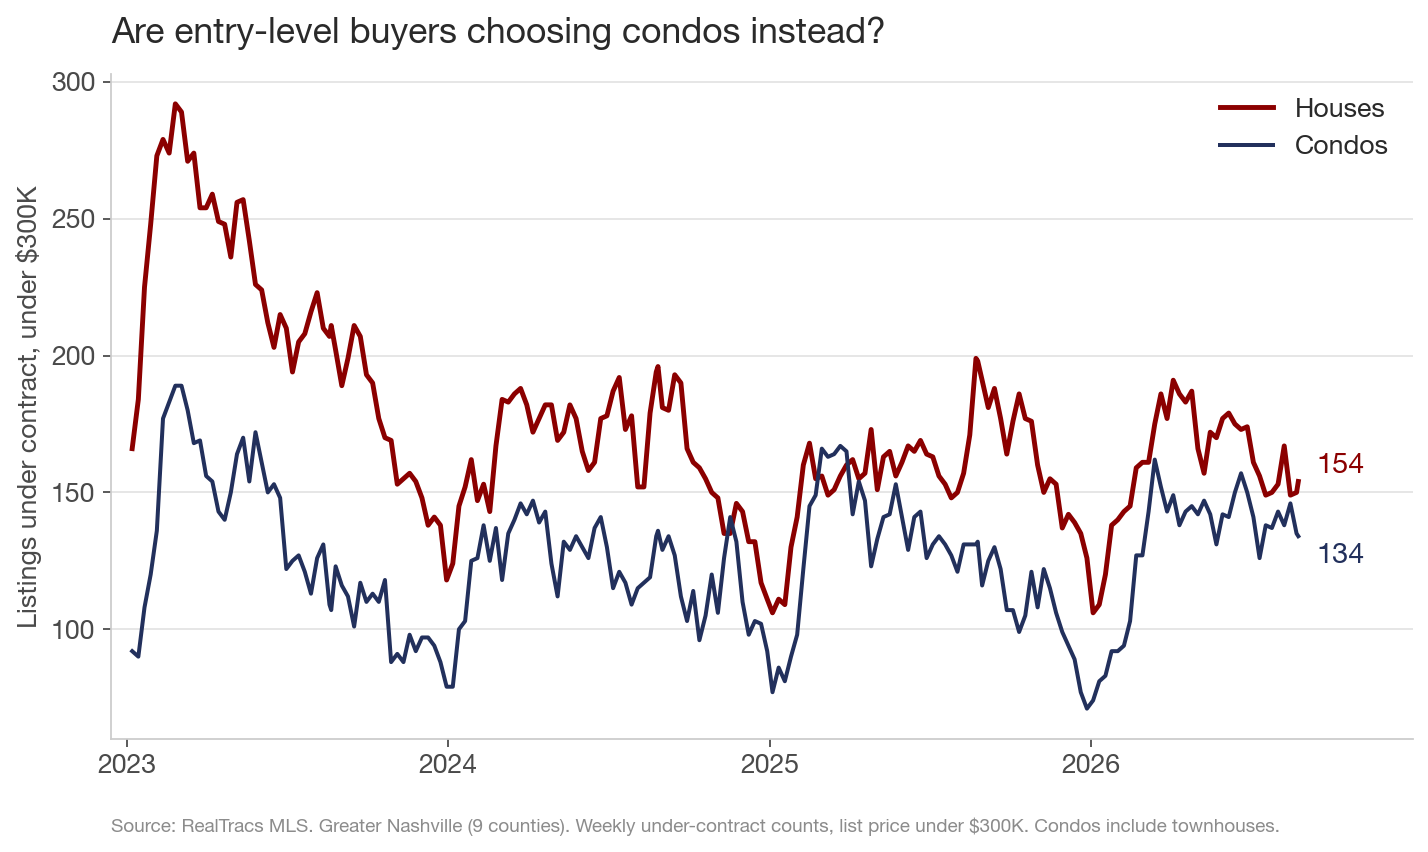
The condo side of the band did not drop. 134 condos under $300K are under contract, one ahead of last year's 132, so the entire entry-level decline is on the house side. The supply mix points the same way: 753 active condo listings under $300K against 426 houses, with the condo count up 34% on last year. A buyer shopping below $300K now sees nearly two condos for every house, and almost as many condos as houses are going under contract there.
7. Have closings under $300K followed?
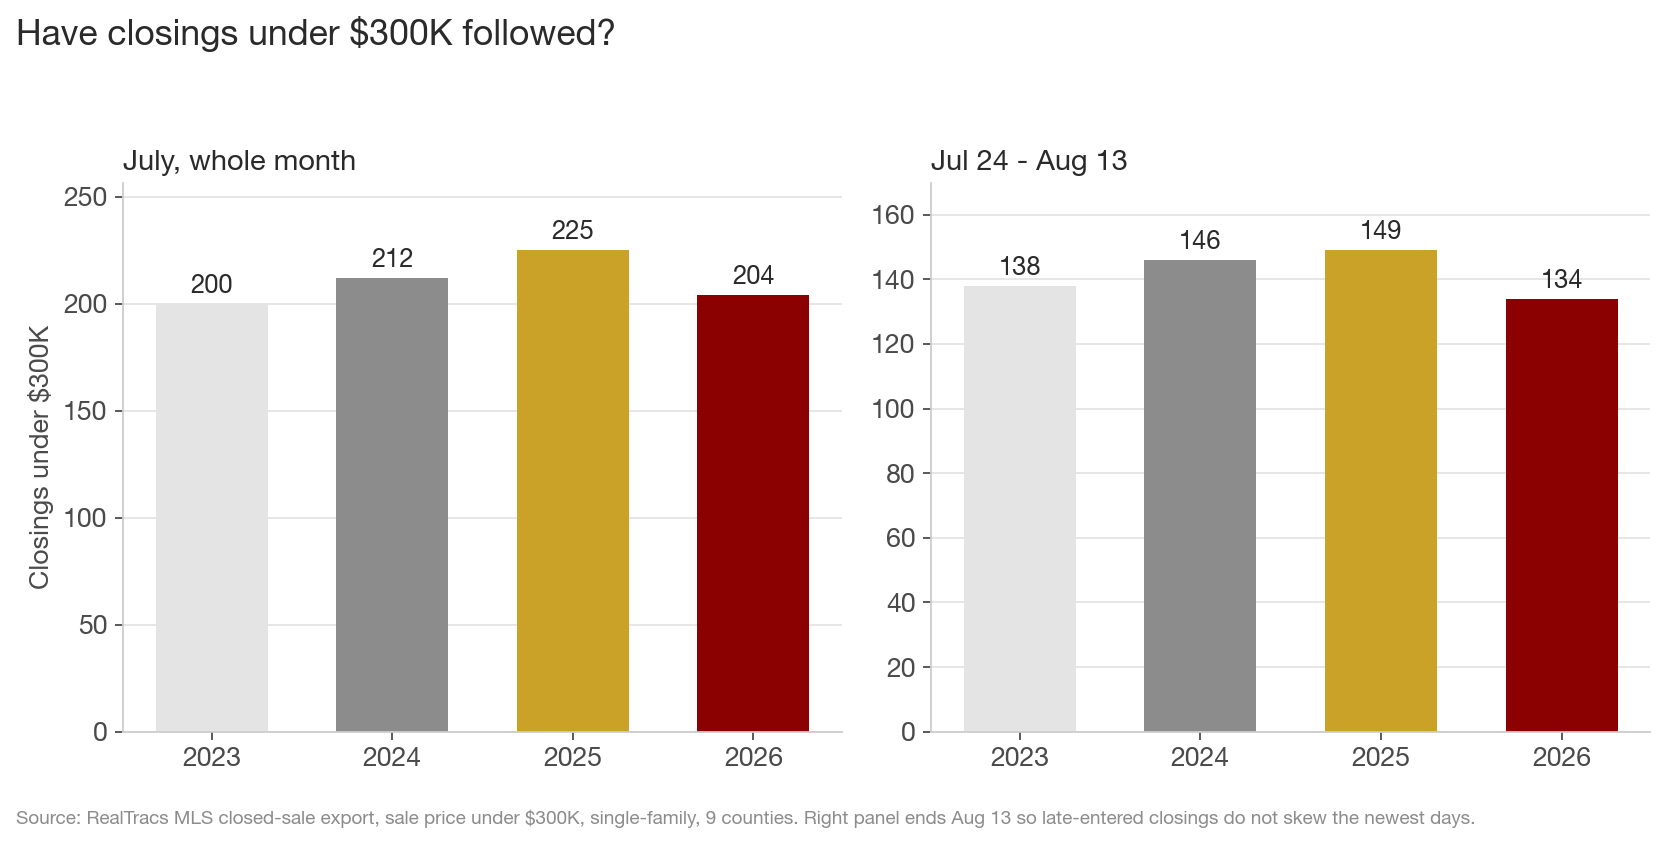
Yes, and faster than the bigger bands. July closings in the band were 204, down 9.3% from last July's 225. The July 24 to August 13 window, which stops early so late-entered closings do not distort the newest days, is 134, below all three prior years. For comparison, the $300K-$500K band's July closings were still level with last year. June was the band's last strong month, up 11% on 2025.
What this adds up to
- Contracts on houses under $300K are 154, down -22.2% vs 2025, -21.4% vs 2024 and -23.8% vs 2023, the weakest of the six house price bands on this week's reading.
- The gap opened in two weeks, and most of the move is the base: the last two Augusts brought a rate-driven rise in entry-level buying (rates fell through both), and this August rates rose to 6.69%, the 2026 high, instead.
- Against 2024, every band under $750K is down and every band above is up.
- There is no listing shortage: sub-$300K actives hit a four-year high of 432, and 48.6% of them have a price cut.
- Condos under $300K held level, so the decline is specific to houses, and closings in the band are already below all three prior years in the lag-safe window.
What to watch: September. In each of the last two years the 30-year rate fell through September (to 6.08% in 2024, 6.26% in 2025) and the band's contracts ran near 200 into the fall. If rates fall again and the count climbs back toward 190-200 by early October, the drop was a response to rates. If rates hold near 6.65%, or the count stays near 150 even as rates fall, September closings should come in below last September's 193, and the band's weakness is more than one month of rate moves.
Data through week ending 08-24-2026, Greater Nashville (Davidson, Williamson, Rutherford, Wilson, Sumner, Maury, Dickson, Cheatham, Robertson). Weekly counts are point-in-time under-contract and active counts by list price band at the same weekday-matched week each year. Closing counts are from the closed-sale export by sale price. Mortgage rates are the Freddie Mac Primary Mortgage Market Survey via FRED. Source: RealTracs MLS.