441 homes closed in Rutherford County in the last 31 days, against 507 at the same week of 2025 (-13.0%), 483 in 2024 and 584 in 2023. This is the 4th consecutive week below all three prior years. Rutherford has the largest decline of the 9 counties vs last year, and it is 66 of the metro's 114-closing decline. The whole month of August closed 458 homes in the county, the lowest August in the 7 years of closed sales data.
The July 31 post found Rutherford contracts at 390, below all three prior years, and said closings should fall below 2025 by the middle of October. They fell below it on August 22. 6 charts below cover the weekly count, the whole month of August, the contracts that moved first, the other 8 counties, where the decline is by builders vs resale and by price, and the supply behind it.
1. How far below last year are Rutherford closings?
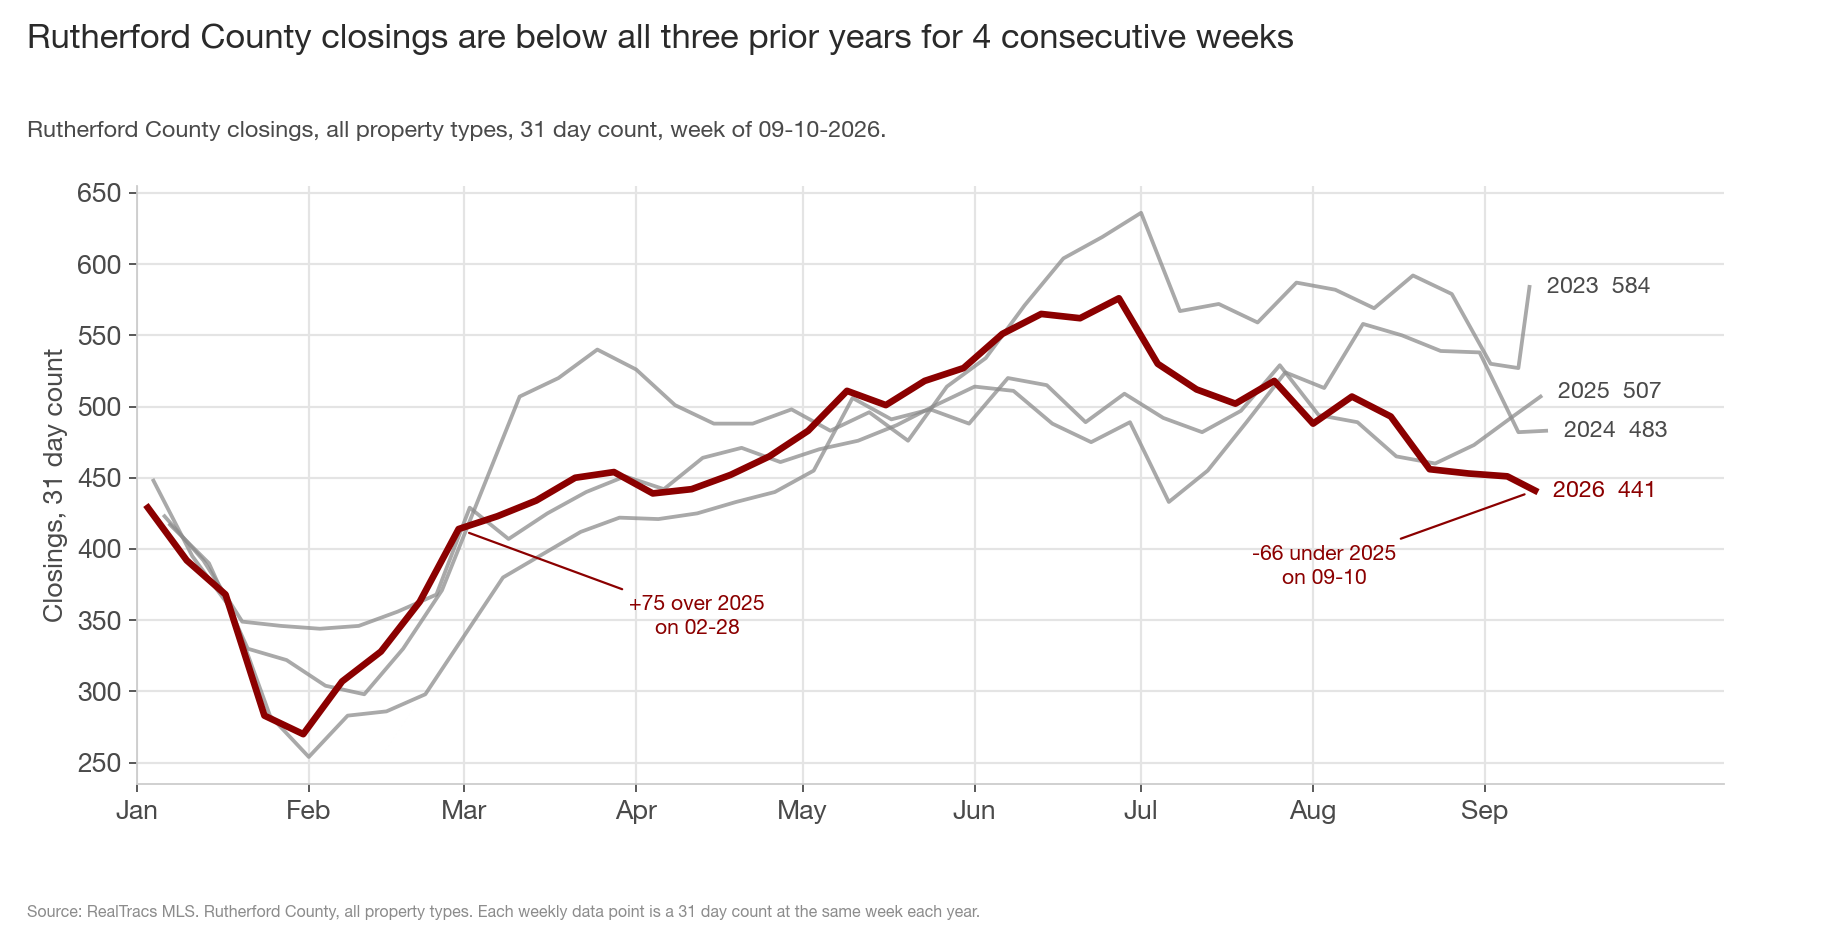
Rutherford closed 441 homes over the last 31 days. The same week of 2025 had 507, 2024 had 483 and 2023 had 584, so this week is 13.0% below last year, 8.7% below 2024 and 24.5% below 2023. On August 15 the county was still 28 closings ahead of last year (+6.0%). The 4 weeks since have all been below all three prior years, and this week's gap of 66 is the largest of 2026. Closings were also below all three prior years for 2 weeks in late July, then back above 2025 for 2 weeks, before the current run. The largest lead over 2025 this year was 75, on February 28.
Two things moved at once. Rutherford's own count fell 52 closings from August 15 to now, while the same 4 weeks of 2025 rose 42. Last September was a strong month for the county, so part of the gap is the comparison. The count is still below 2024 and 2023 at this week, so the decline is not only the comparison to 2025.
2. Did the whole month of August fall below 2025?
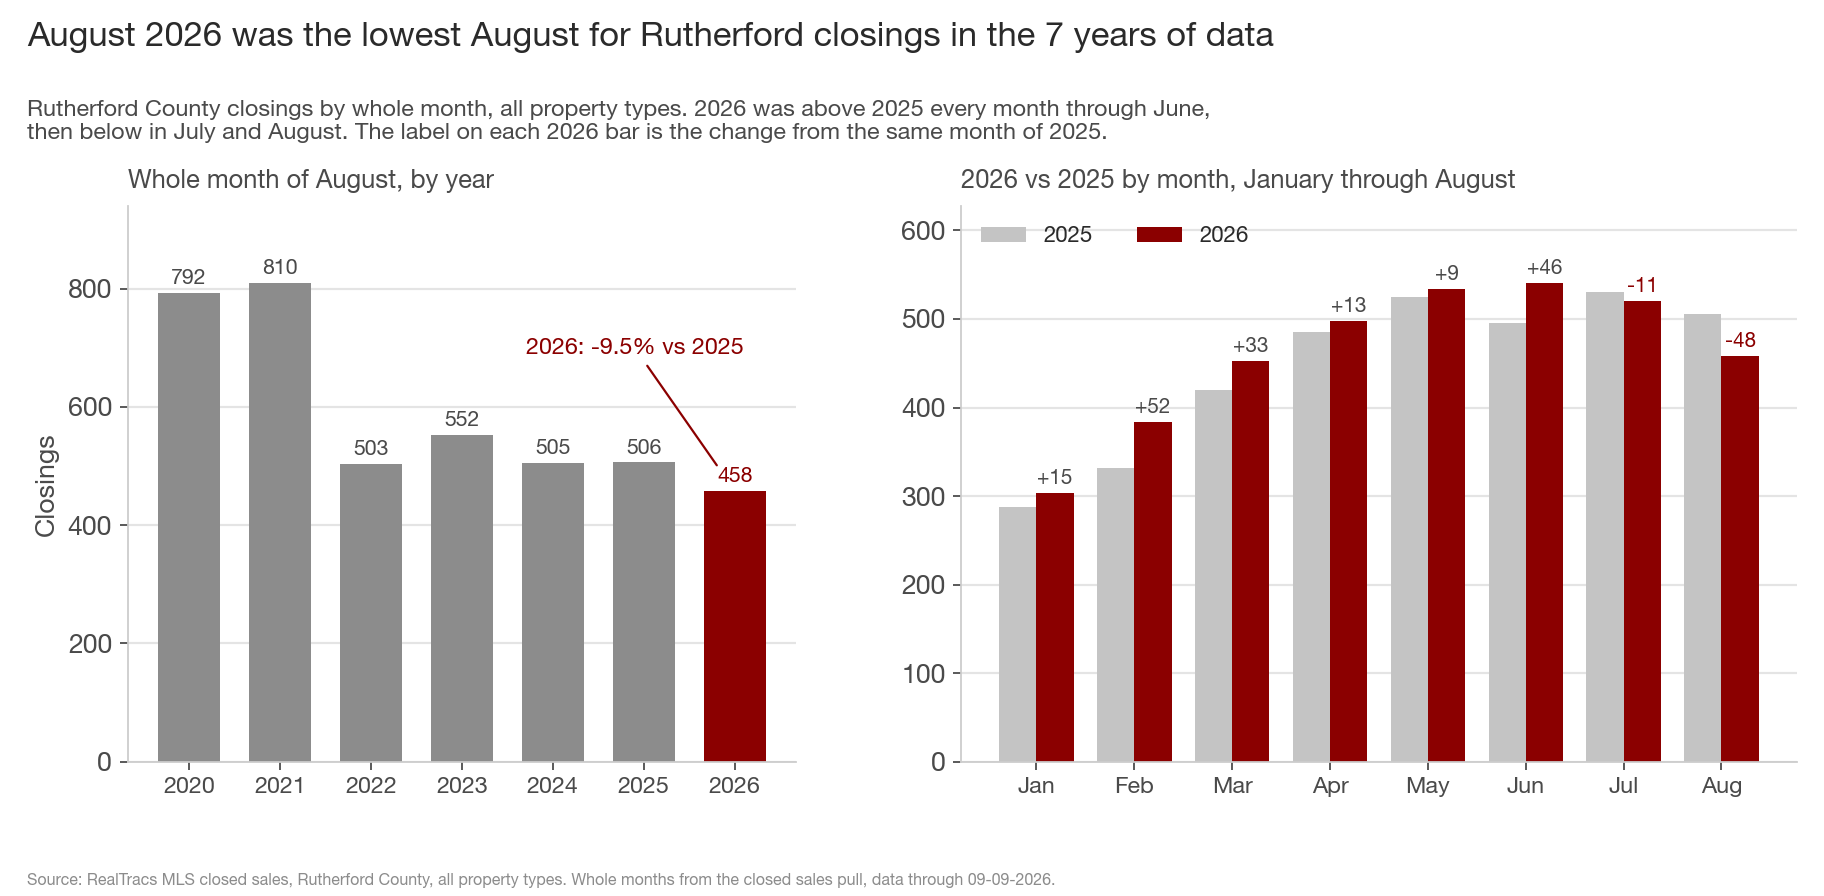
Yes. The weekly count above is a 31 day window that moves every day. Whole months from the closed sales pull are below 2025 as well. August 2026 closed 458 homes in Rutherford, against 506 in August 2025 (-9.5%), 505 in 2024 and 552 in 2023. It is the lowest August in the 7 years of data; August 2020 and 2021 closed 792 and 810. August 1 through 24, which is 15 days before the pull so late posted closings can't change it, is 299 vs 332 last year (-9.9%), also the lowest of the 7 years.
The month is a change of direction for the county. From January through June, 2026 closed more homes than 2025 every month, between 9 and 52 more. July was 11 below and August 48 below. January through August is still 3,691 closings, 3.0% above the same 8 months of 2025 and above 2024, because of the first half.
The metro as a whole closed 2,809 homes in August against 3,020 in August 2025, a decline of 211. Rutherford is 48 of that and Davidson is 89.
3. Did contracts fall first?
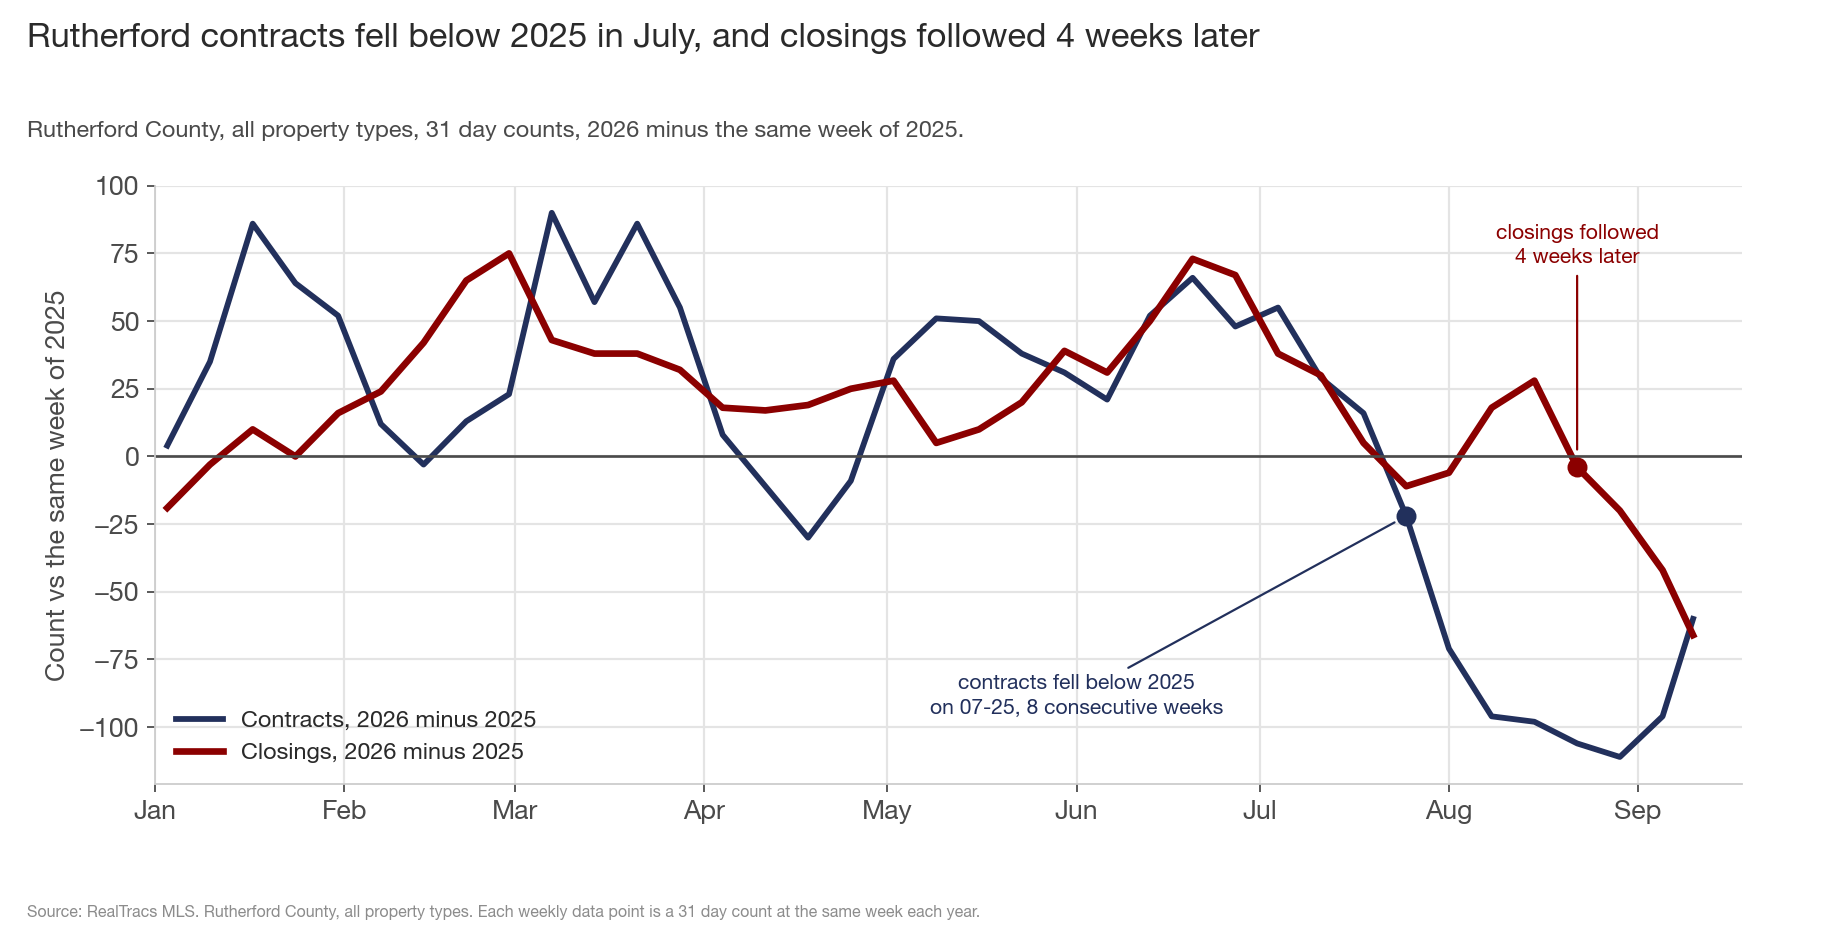
Yes, by 4 weeks. Rutherford contracts fell below all three prior years the week of July 25 and have stayed there for 8 consecutive weeks. The count reached 367 on September 5, the lowest since the middle of January, and the gap to 2025 reached 111 contracts on August 29. Closings fell below all three prior years on August 22, 4 weeks after contracts did, and have stayed below since.
This week contracts are 395, against 455 at the same week of 2025, 521 in 2024 and 498 in 2023 (-13.2%, -24.2% and -20.7%). The gap to last year is 60, less than any week since July 25, so the contract gap did not grow this week. It is still the 8th consecutive week below every prior year.
4. Which county has the largest closing decline?
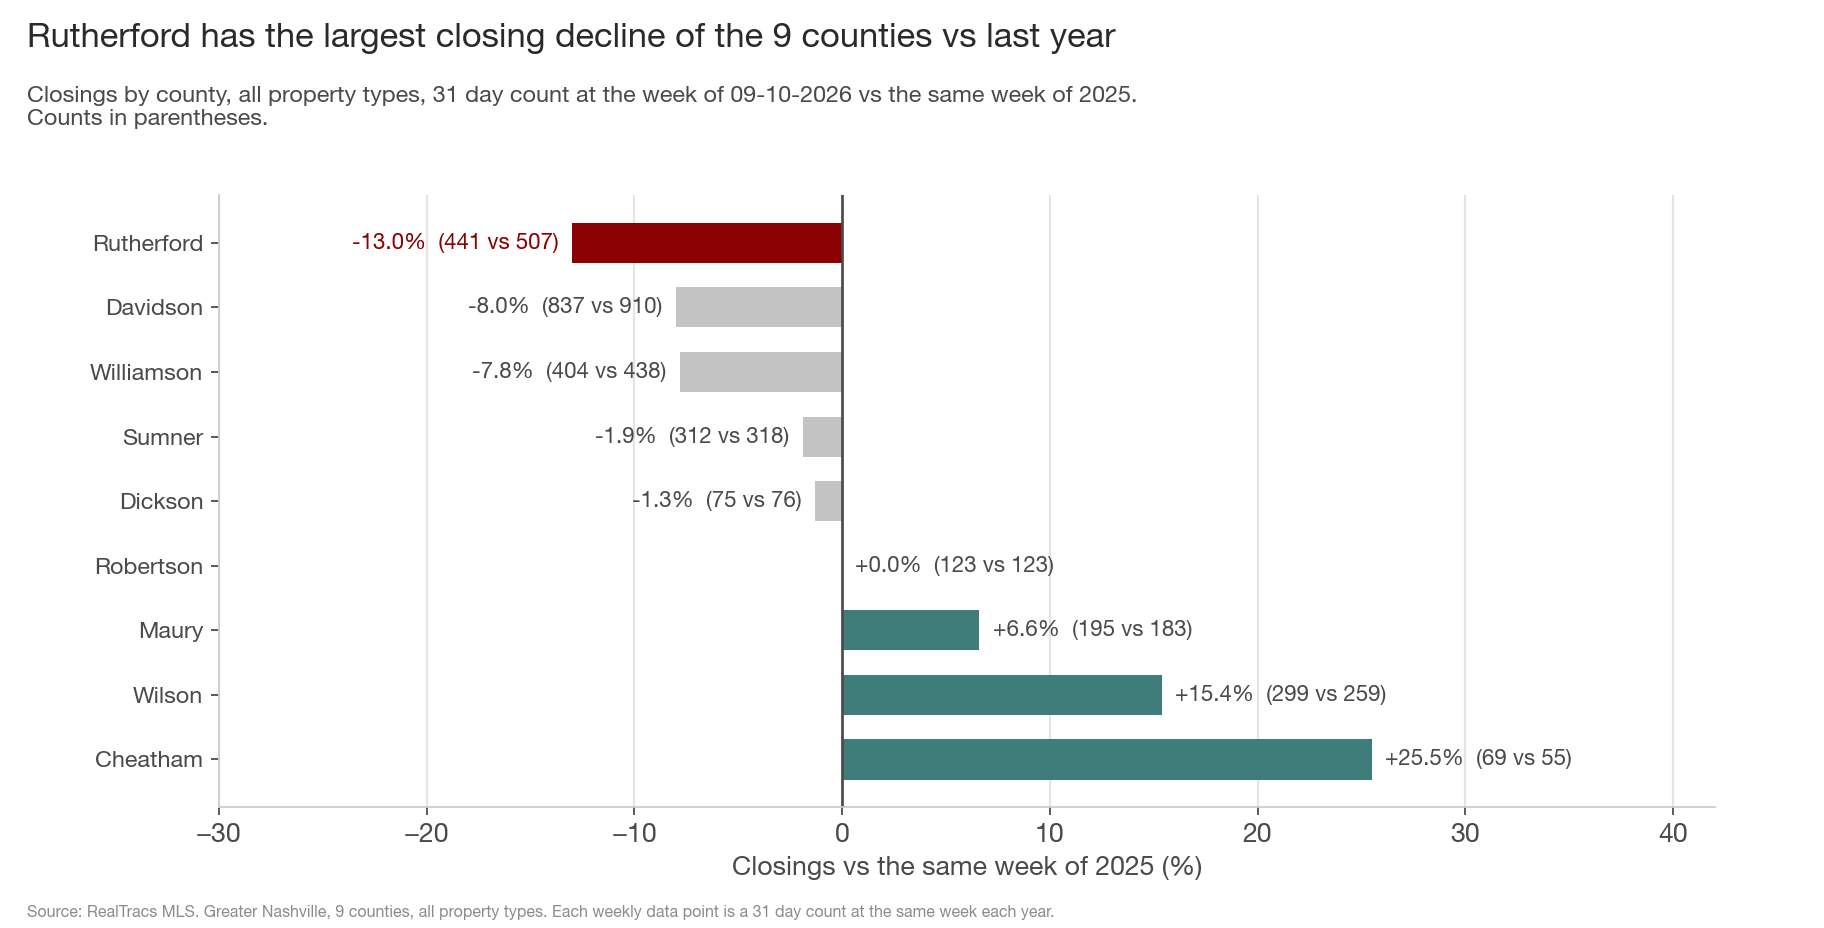
Rutherford, at -13.0%. Davidson is next at -8.0% and Williamson at -7.8%. Sumner and Dickson are within 2% of last year, Robertson is even, and Maury, Wilson and Cheatham are above last year, Wilson by 15.4%.
Rutherford is 16% of the metro's closings, and it is 66 of the 114 closings the metro is below last year. Davidson is 73 below, Williamson 34 below, and Wilson is 40 above. Against 2024 the largest decline is Sumner (-9.8% vs Rutherford's -8.7%), and against 2023 it is Davidson (-25.2% vs -24.5%), so Rutherford is the largest decline vs last year and the 2nd largest against the other 2 years.
5. Where in Rutherford is the decline?
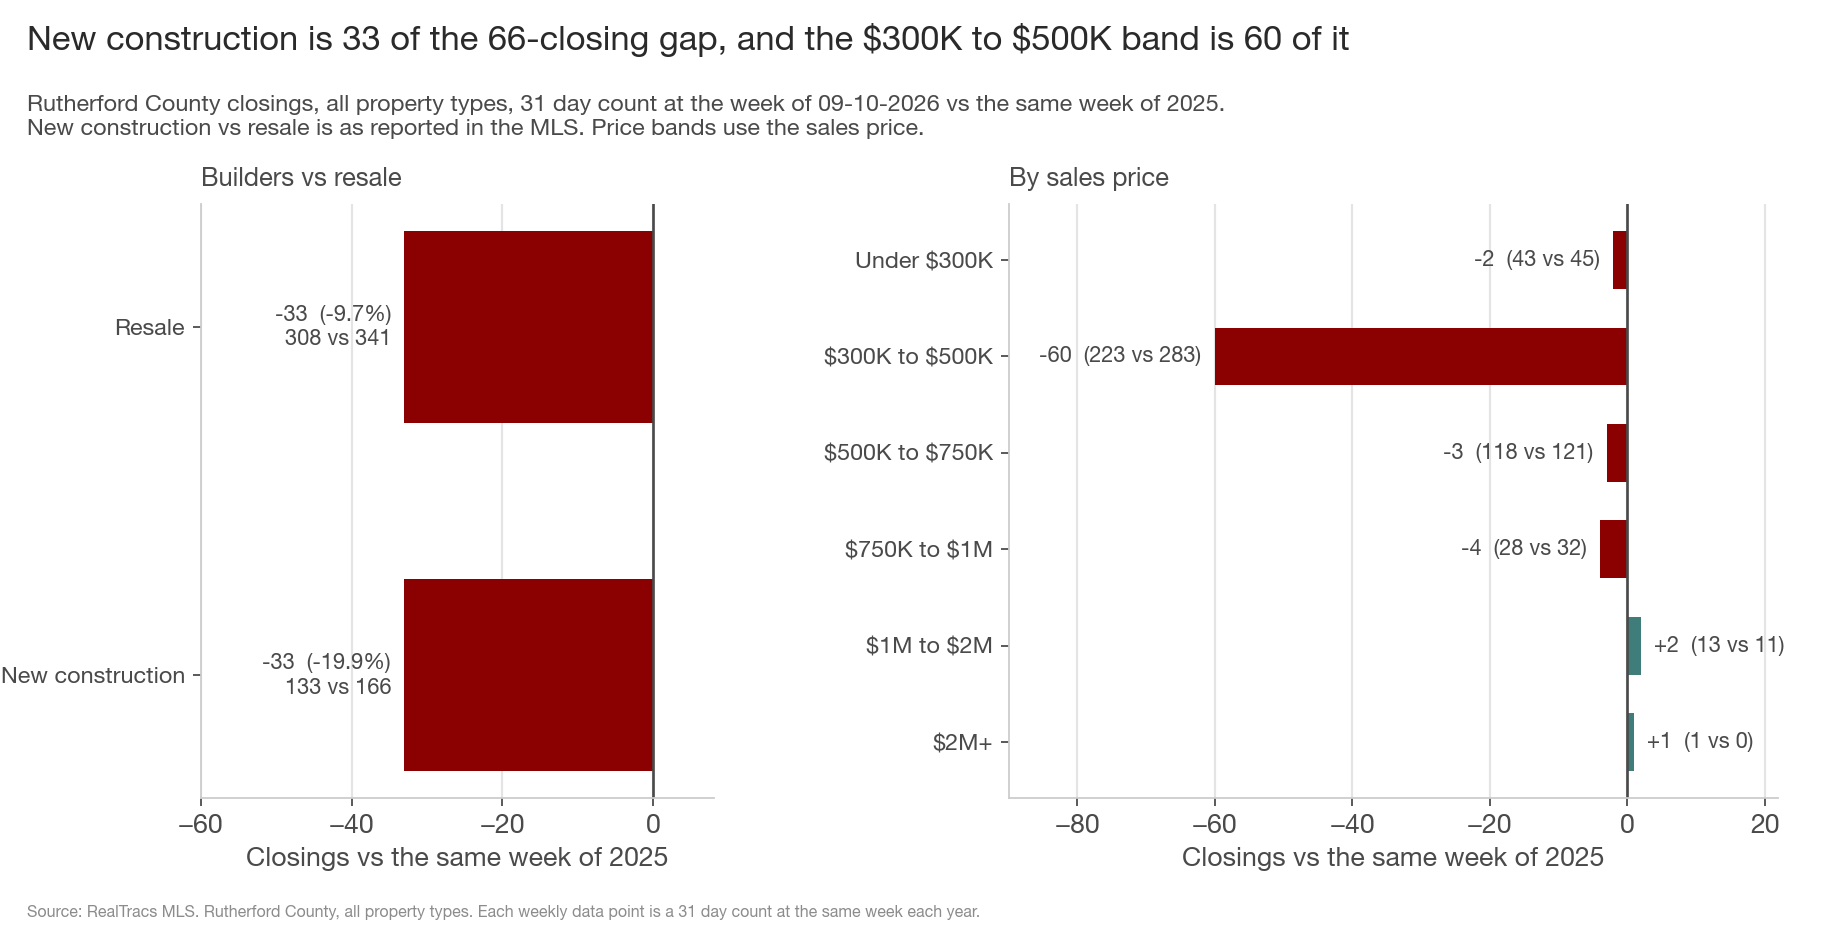
The decline is half builders and half resale, and it is almost all in one price band. New construction closed 133 homes against 166 last year (-19.9%), and resale closed 308 against 341 (-9.7%). Each is 33 of the 66-closing gap. New construction is also below 2024 (175) and 2023 (233). Resale is even with 2024 at 308 and below 2023 at 351.
By sales price, the $300K to $500K band closed 223 homes against 283 last year (-21.2%), 60 of the 66-closing gap. That band is 51% of the county's closings, and it has fallen every year in the data at this week: 383 in 2023, 294 in 2024, 283 in 2025, 223 now. Every other band is within 4 closings of last year. The band's contracts are 235 against 265 last year, 303 in 2024 and 306 in 2023, so the band's closings should stay below last year for the next 60 to 90 days.
6. What is the supply behind it?
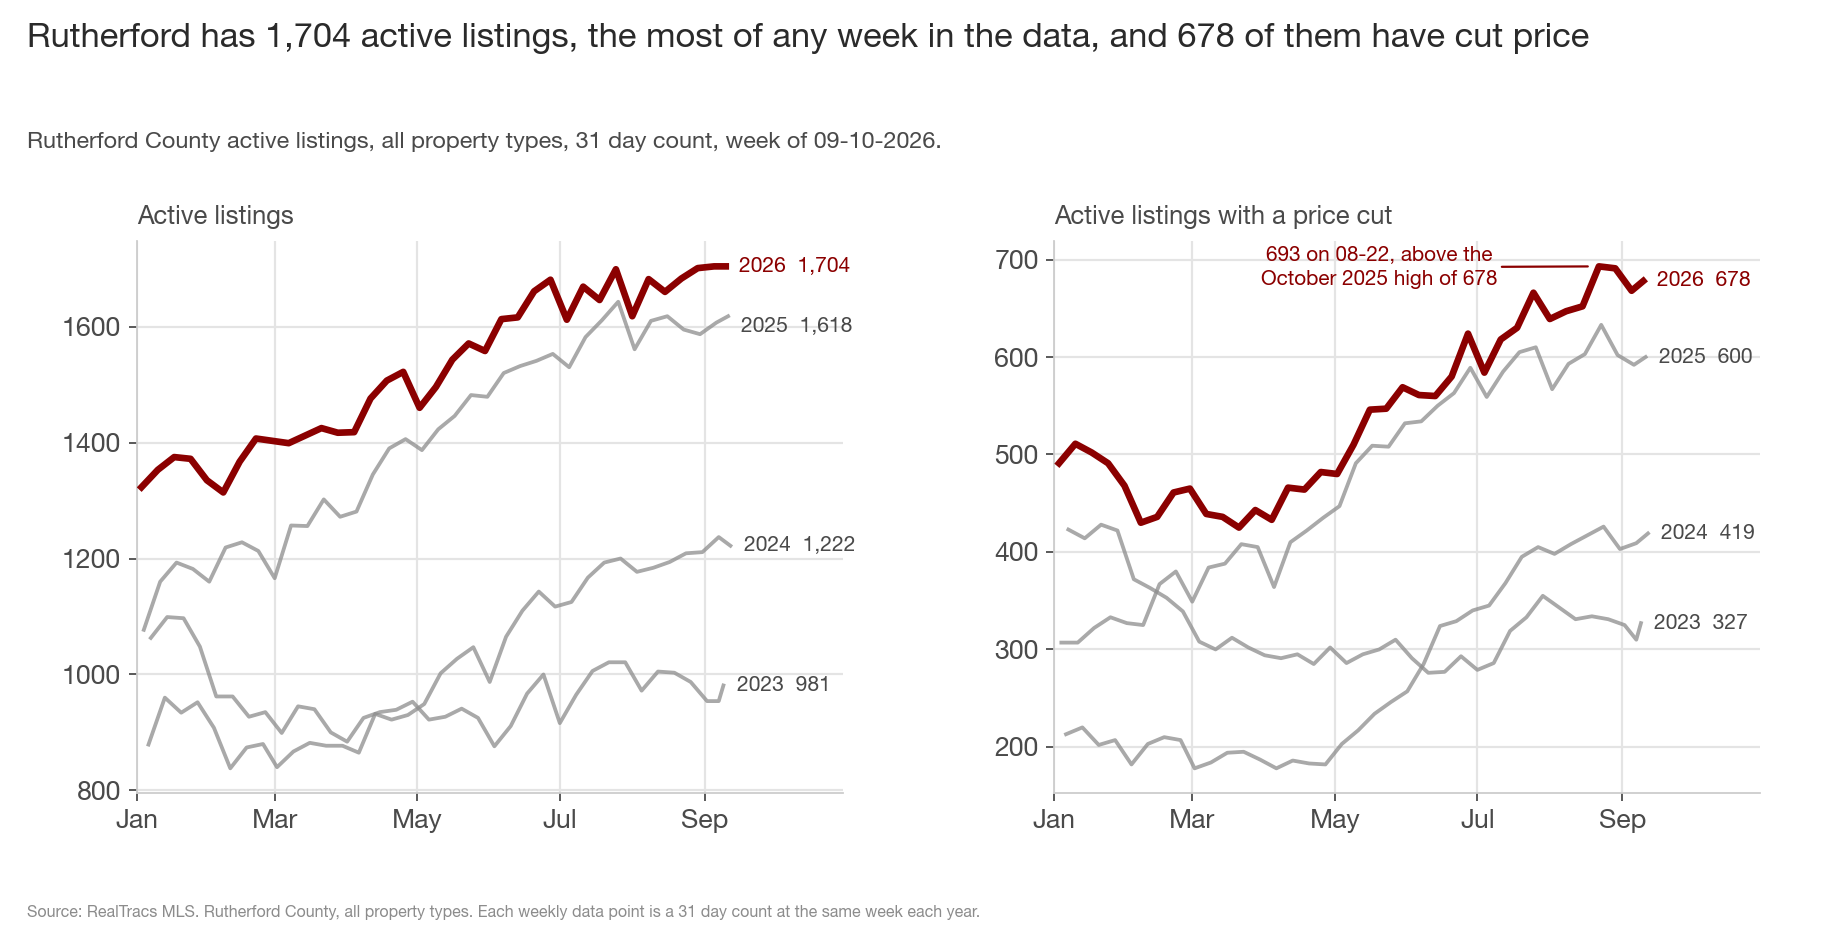
Rutherford has 1,704 active listings, 5.3% above last year's 1,618 and the most of any week in the 4 years of data. 678 of them have cut the asking price, against 600 at this week last year, and 39.8% of active listings have a cut vs 37.1% last year. The July 31 post said the price cut count should go above the October 2025 high of 678 this fall if contracts stayed under 400. It did on August 22, at 693.
Active listings per contract are 4.3, against 3.6 last year, 2.3 in 2024 and 2.0 in 2023. Last week's 4.6 was even with the highest in the data, a level the county had only reached in January of 2025 and 2026, when contract volume is at its seasonal low. There are more listings and fewer buyers who can pay at current prices. The Single Family median sales price in the county is $470,000 over the last 31 days, against $452,000 at this week last year. Part of that is mix: 60 of the 66 fewer closings are in the $300K to $500K band, so fewer low priced closings move the median up.
Adding it up
- Rutherford closed 441 homes in the last 31 days, below all three prior years for 4 consecutive weeks, and 13.0% below last year.
- August was the lowest August in the 7 years of data at 458 closings, and August 1 through 24 was the lowest as well. The county was ahead of 2025 every month through June.
- Contracts fell below all three prior years on July 25, and closings followed 4 weeks later. Contracts are 395, below every prior year for 8 consecutive weeks.
- Rutherford is the largest decline of the 9 counties vs last year and 66 of the metro's 114-closing decline.
- The decline is half builders, half resale, and 60 of the 66 closings are in the $300K to $500K band, which has fallen every year since 2023.
- Active listings are at 1,704, the most in the data, and 678 have cut price.
The July 31 post expected Rutherford closings to fall below 2025 by the middle of October if the contract decline held. They fell below 7 weeks earlier than that, and the whole month of August shows the same thing. At the end of June Rutherford was 67 closings ahead of last year, the most of the 9 counties. 11 weeks later it is the largest decline.
For a seller in Rutherford, there are 1,704 listings for sale, 678 of them cut, and 4.3 listings for every contract. For a buyer in the $300K to $500K band, the band has 816 active listings, about the same as last year's 829, with 21% fewer closings than last year and 22% fewer contracts than 2024. For builders, new construction closings in the county are 20% below last year and 43% below 2023.
What to watch: homes going under contract now close in 60 to 90 days, and the county's contracts have been 13% or more below last year for 7 of the last 8 weeks. I expect the whole month of September to close below the 458 homes of September 2025 and October to close below 2025's 460. A September at or above 458 would mean the July contract decline did not carry into fall closings. On the supply side, last year's active listings peaked at 1,668 on September 20 and were 1,627 at the end of October. I expect the 2026 count to still be above 1,627 at the end of October. A count below that would mean listings are leaving the market faster than last year.
Data through the week of 09-10-2026, Greater Nashville (9 counties: Davidson, Williamson, Rutherford, Wilson, Sumner, Maury, Dickson, Cheatham, Robertson). Each weekly data point is a 31 day count at the same week each year, all property types. Price bands use the sales price for closings and contracts and the list price for active listings. New construction vs resale is as reported in the MLS. Whole month numbers are from the closed sales pull with data through 09-09-2026. Source: RealTracs MLS.