379 condos went under contract in the last 31 days, against 427 at the same week of 2025 (-11.2%), 415 in 2024 and 413 in 2023. This is the 2nd consecutive week below all three prior years. A month ago, on August 15, the count was 439, 11.7% above last year. Condo contracts fell 60 in a month while the same 4 weeks of 2025 rose 34, and the 30 year mortgage rate went from 6.71% to 7.19%.
The August 18 post found condo contracts 12.2% above last year while Single Family contracts were 12.3% below. 12 charts below cover the weekly count, the month's decline against the prior 3 years and mortgage rates, resale vs new construction, townhouses vs other condos, the supply behind it, the counties and price bands, whether closings have followed, and then, from the closed sales, the sold price per square foot of condos, townhouses and HPR-attached homes over the last 12 months and the biggest resale gains and losses.
1. How far did condo contracts fall?
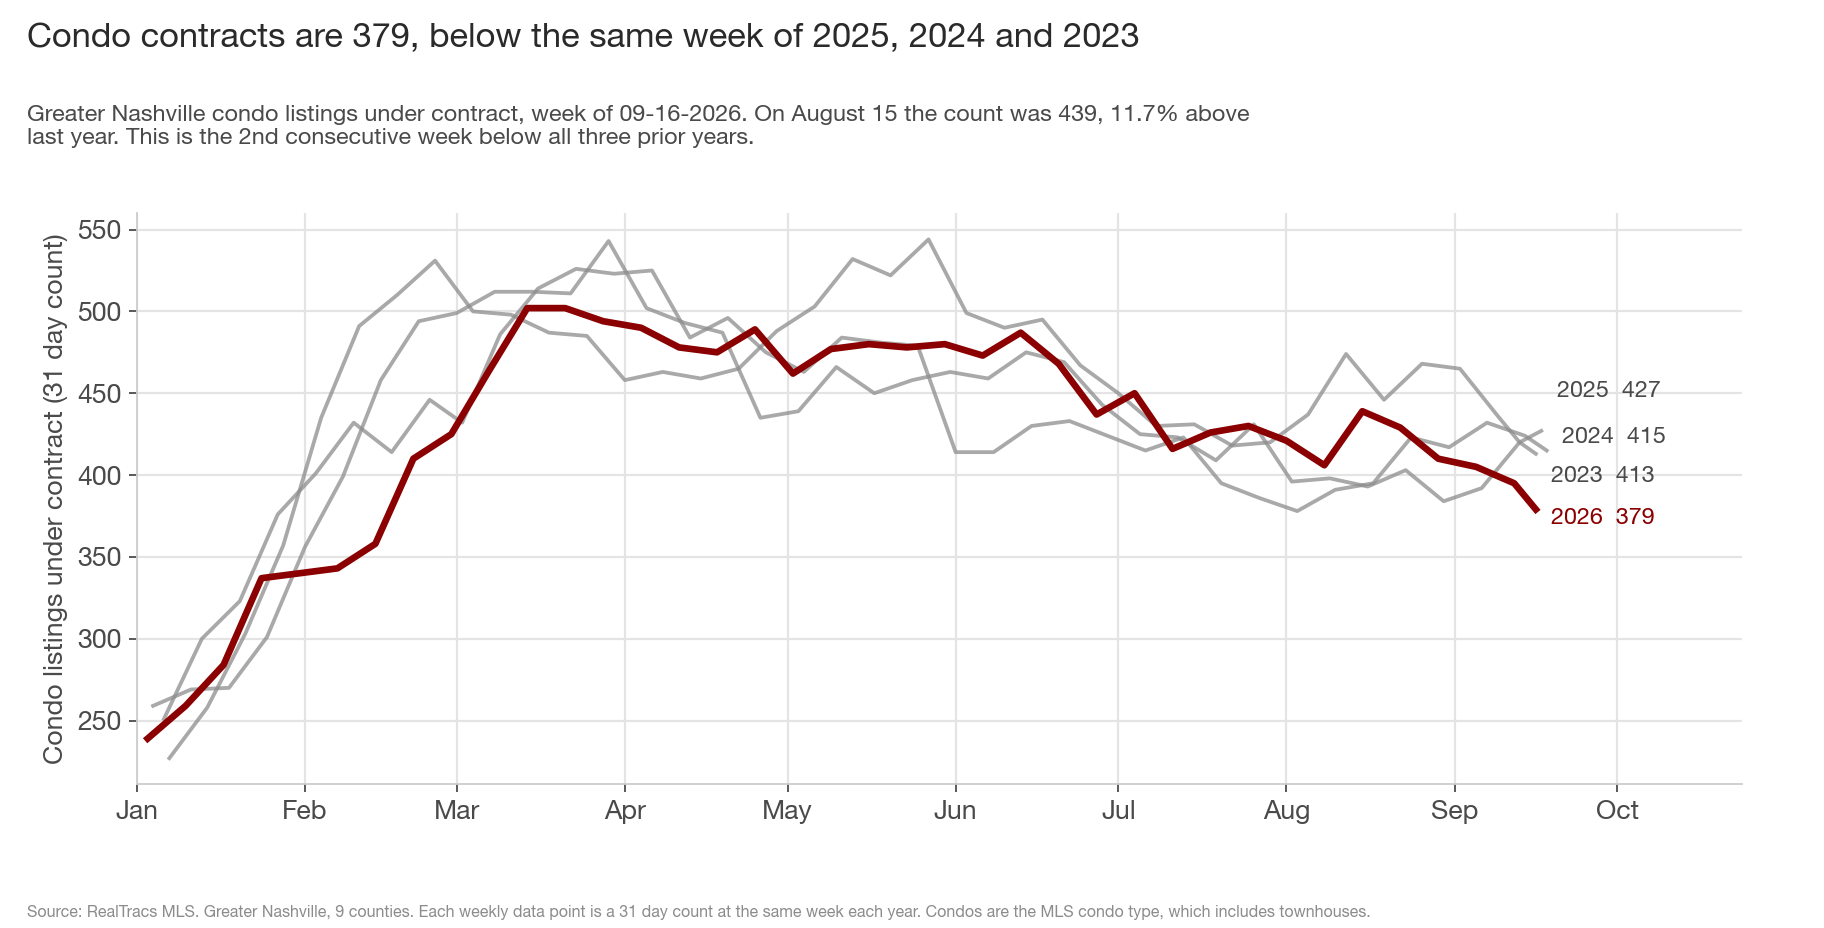
Condo contracts are 379 over the last 31 days, 11.2% below last year, 8.7% below 2024 and 8.2% below 2023. The count was below all three prior years for 6 consecutive weeks from January 31 to March 7, for one week in July, and now for the last 2 weeks. From April 25 to June 13, and again from August 1 to September 5, the count was above last year every week. The largest lead over last year this summer was August 15, 46 contracts ahead; the largest of the year was 54 on April 25. This week it is 48 behind, and 379 is the lowest count since February 14.
2. Is it 2026 falling or last year rising?
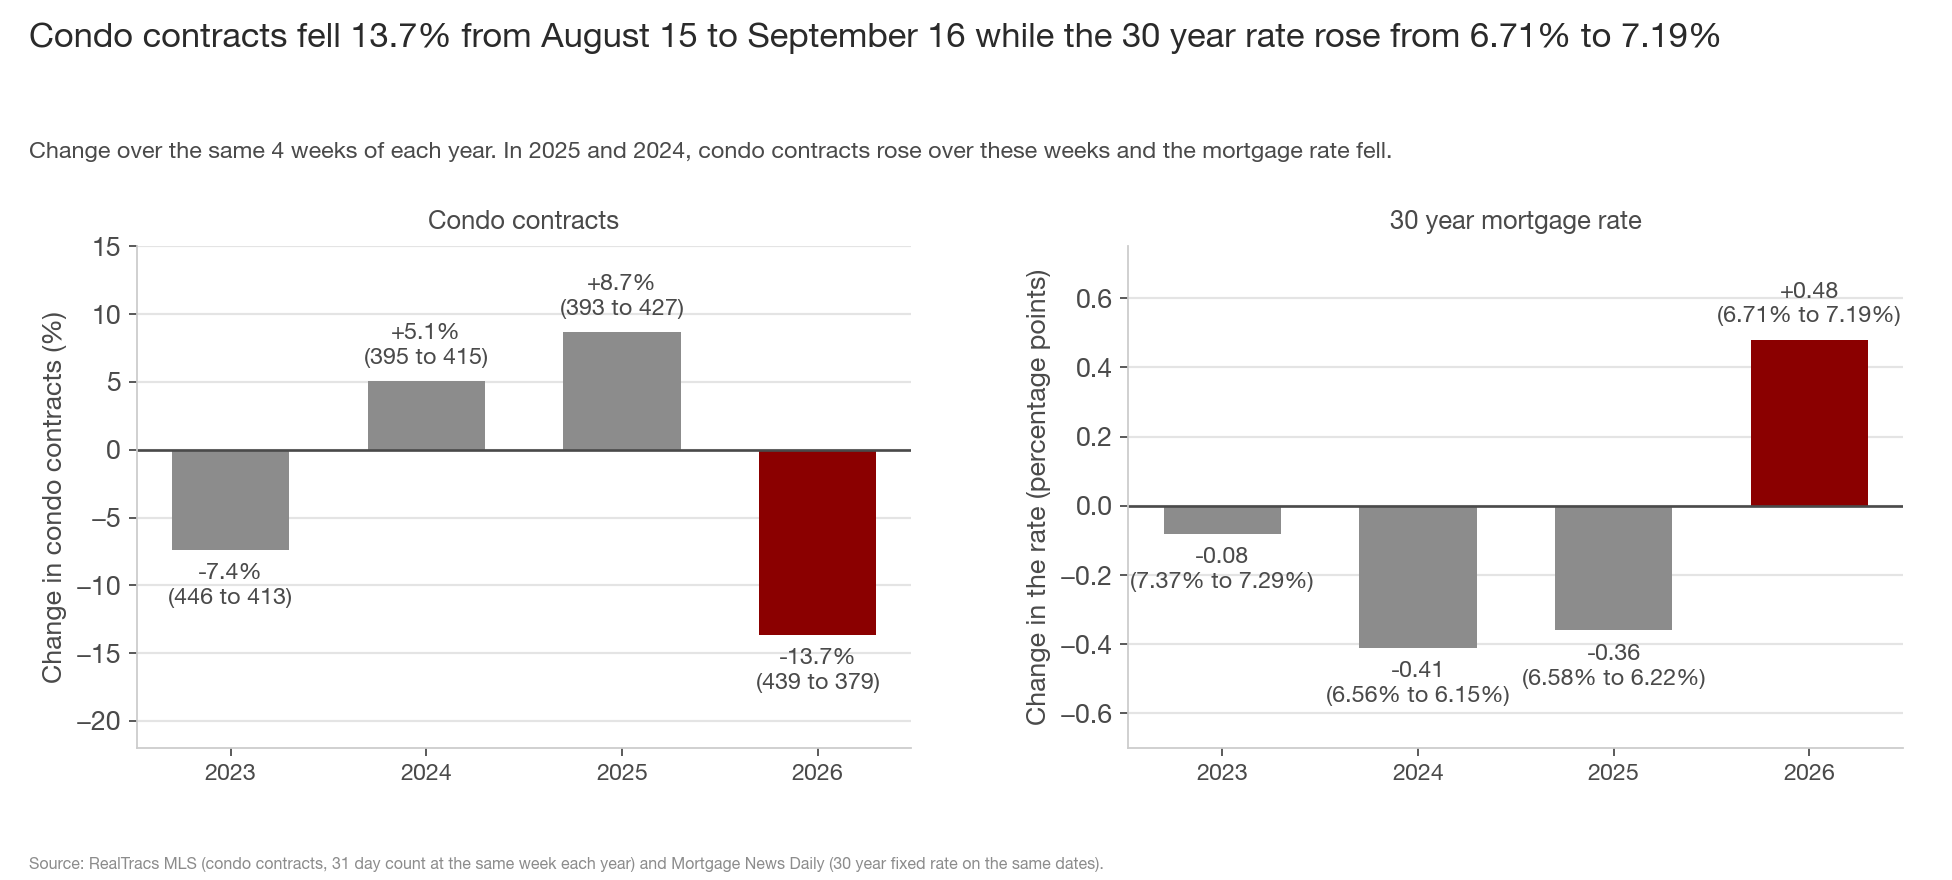
Both, and mostly 2026. From August 15 to September 16 the count fell from 439 to 379, -13.7%. The same 4 weeks of 2025 rose 8.7% (393 to 427) and 2024 rose 5.1%; 2023 fell 7.4%. Of the 94-contract swing against last year, 60 is this year's decline and 34 is last year's rise.
Mortgage rates went the other way from the prior 2 years. The 30 year fixed rate was 6.71% on August 14 and 7.19% on September 16, and the 7.22% on September 15 was the highest since January 2025. Over the same weeks of 2025 the rate fell from 6.58% to 6.22%, and in 2024 from 6.56% to 6.15%. Single Family contracts did not fall this month: 2,236 now vs 2,174 on August 15 (+2.9%), and 3.7% below last year vs 11.3% below a month ago.
3. Is the decline resale or new construction?
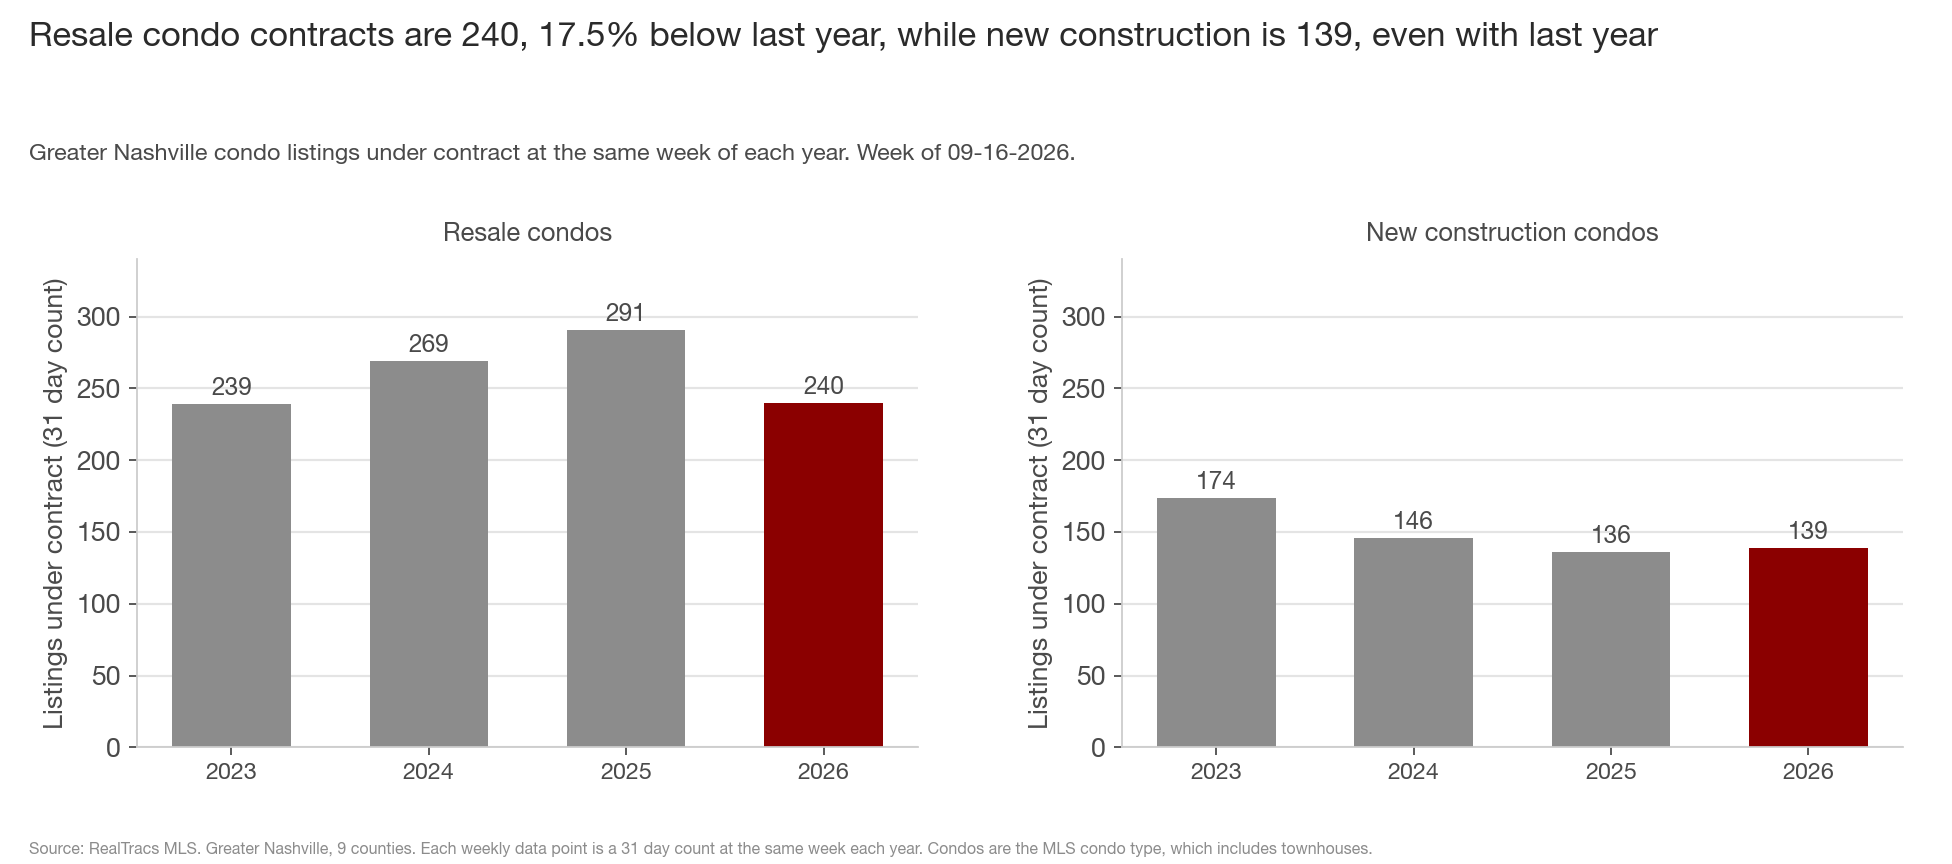
Resale. 240 resale condos are under contract, against 291 last year (-17.5%), 269 in 2024 and 239 in 2023. Resale was below all three prior years for 6 consecutive weeks through September 12 and is 1 contract above 2023 this week. New construction condos are 139, against 136 last year (+2.2%), 146 in 2024 and 174 in 2023. Of the 48 fewer contracts than last year, resale is 51 fewer and new construction is 3 more.
Over the month both fell: resale from 266 to 240 and new construction from 173 to 139. The July 30 post said the condo increase would stay limited to new construction until resale condo contracts, then 6.2% below last year, were above last year. Resale fell further instead.
4. Townhouses or other condos?
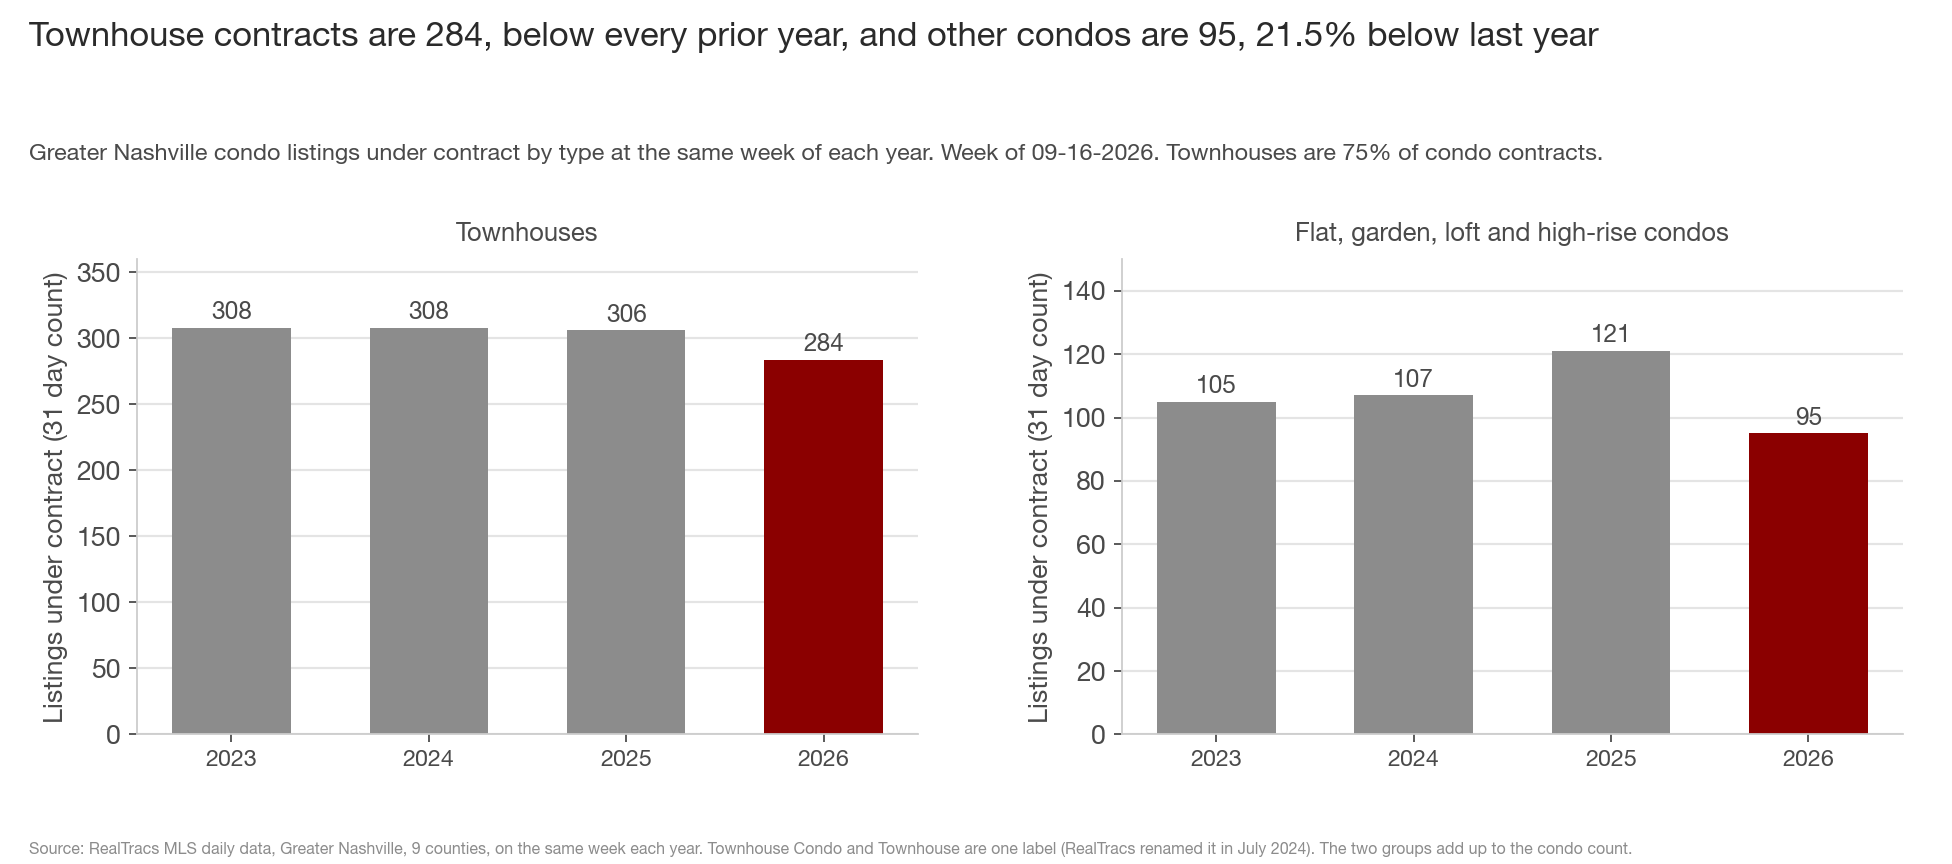
Both are below every prior year. Townhouses are 284 contracts, against 306 last year (-7.2%), 308 in 2024 and 308 in 2023. Flat, garden, loft and high-rise condos are 95, against 121 last year (-21.5%), 107 in 2024 and 105 in 2023. Townhouses are 75% of condo contracts, and they fell 40 from 324 on August 22. The July 31 post had townhouse contracts at a 4 year high of 323.
Within townhouses the decline is resale: new construction townhouses are 130 vs 126 last year, resale townhouses 154 vs 180 (-14.4%). Flat condos are 46 vs 58 and high-rise condos 11 vs 18.
5. How much supply is behind the contracts?
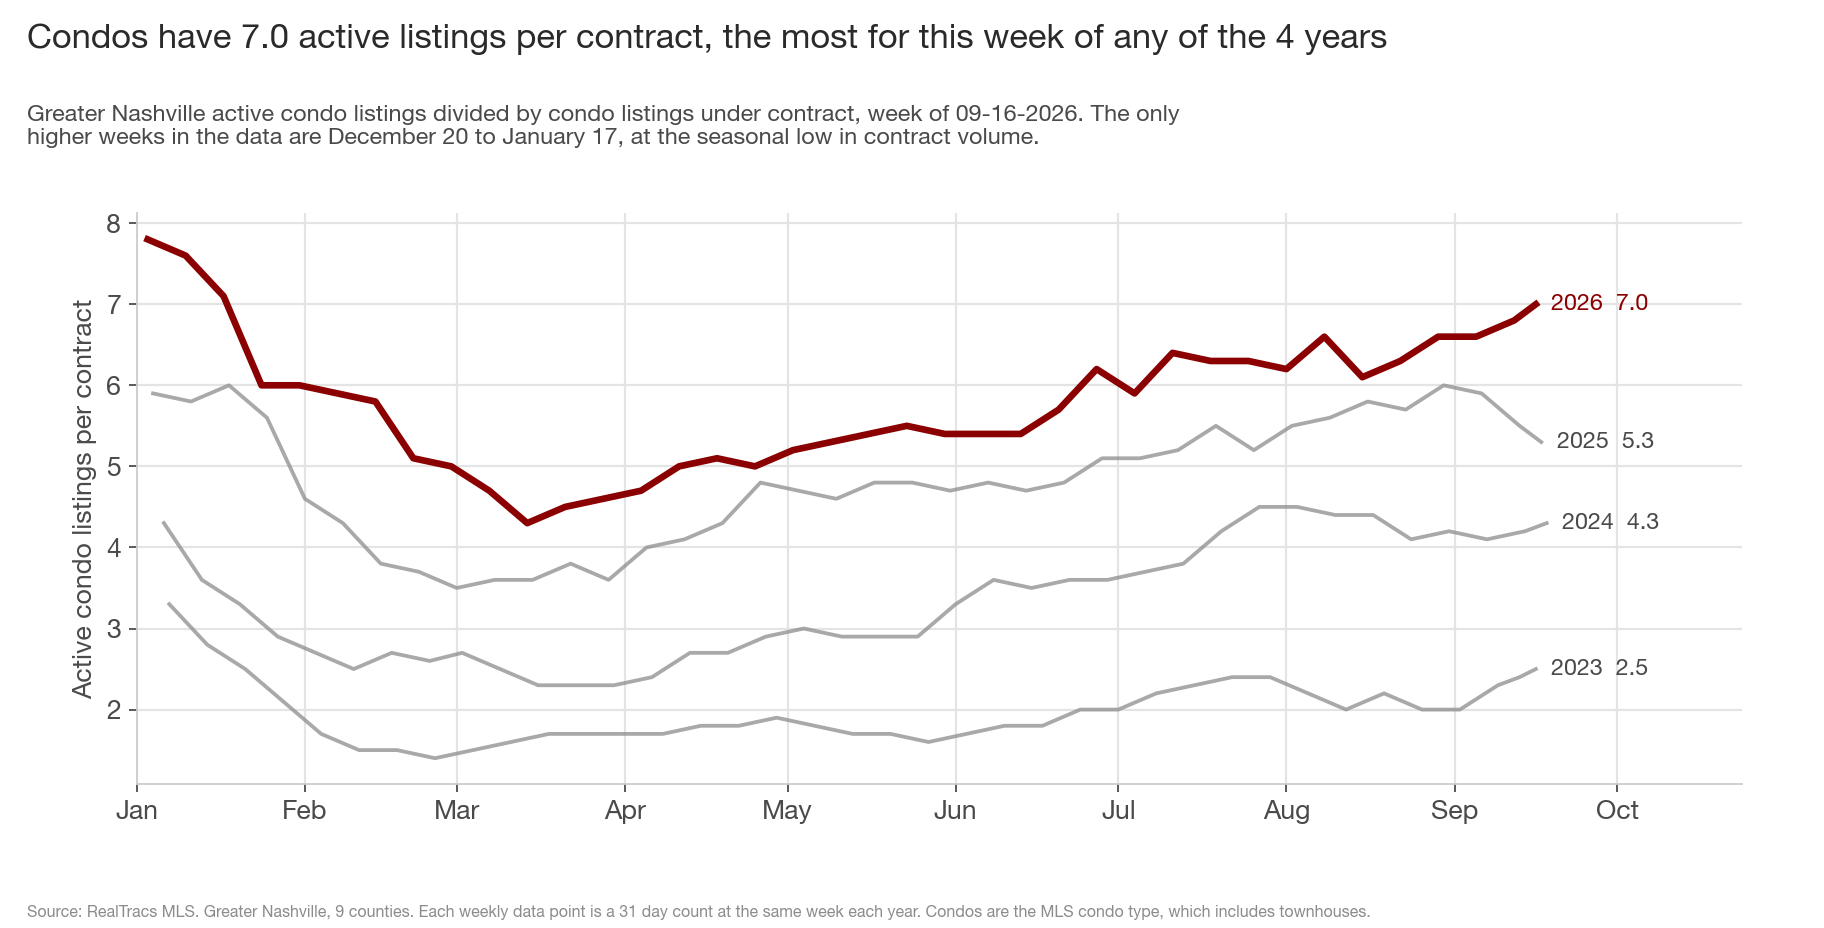
2,661 condos are active, 16.5% above last year's 2,284, and there are 7.0 active listings per contract, against 5.3 last year, 4.3 in 2024 and 2.5 in 2023. That is the most for this week of any of the 4 years. The only weeks in the data above 7.0 are the weeks from December 20 to January 17, when contract volume is at its seasonal low (7.1 to 7.8). Resale condos are at 8.5 listings per contract (2,048 active) vs 5.8 last year. Flat, garden, loft and high-rise condos are at 12.0 (1,140 active vs 95 contracts) against 7.7 last year, and townhouses at 5.4 vs 4.4. 40.0% of active condos have cut the asking price, vs 38.3% last year.
6. Which counties and price bands?
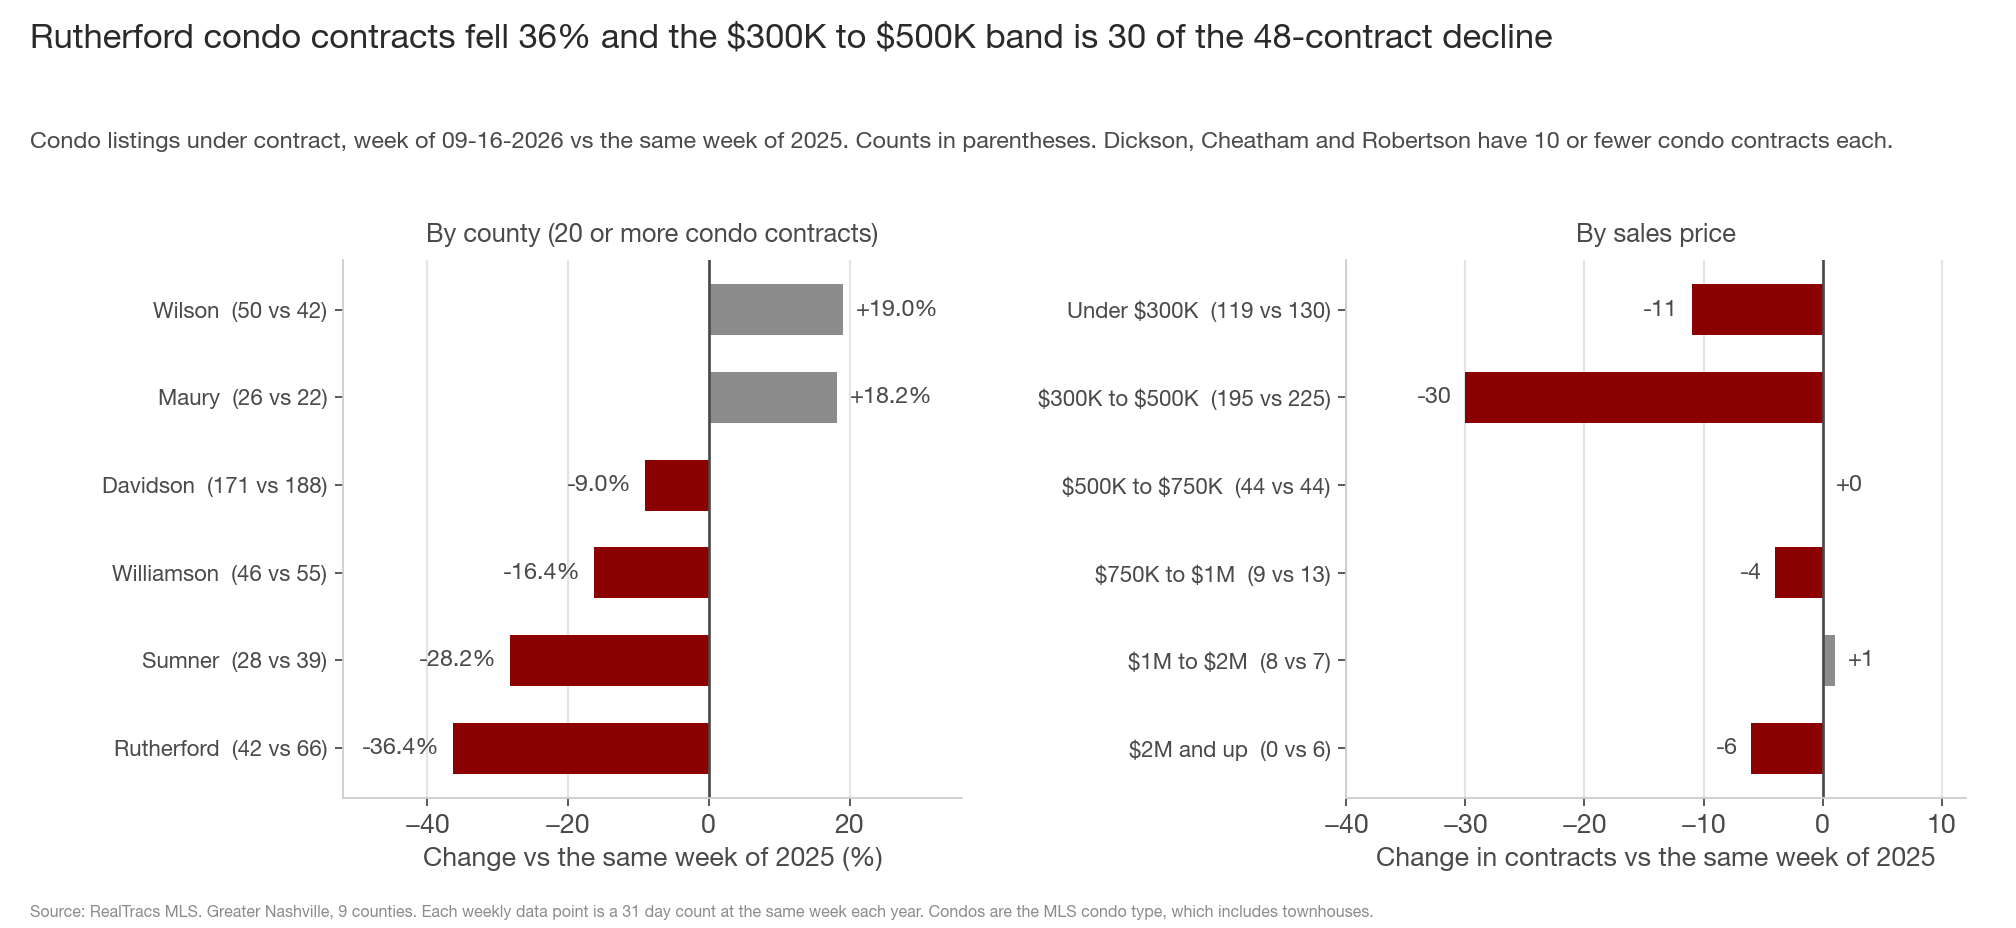
Davidson has 171 condo contracts, against 188 last year (-9.0%), and is below 2024 and 2023 as well. Rutherford has the largest decline of the 6 counties with 20 or more condo contracts, 42 against 66 (-36.4%), then Sumner (28 vs 39, -28.2%) and Williamson (46 vs 55, -16.4%). Wilson is up, 50 vs 42 (+19.0%) and above every prior year, and Maury is 26 vs 22. Dickson, Cheatham and Robertson have 10 or fewer each.
By price, the $300K to $500K band is 195 contracts against 225 last year (-13.3%), 30 of the 48-contract decline. Under $300K is 119 vs 130 (-8.5%), and $500K to $750K is even at 44. The 3 bands above $750K have 17 contracts combined.
7. Are closings following?
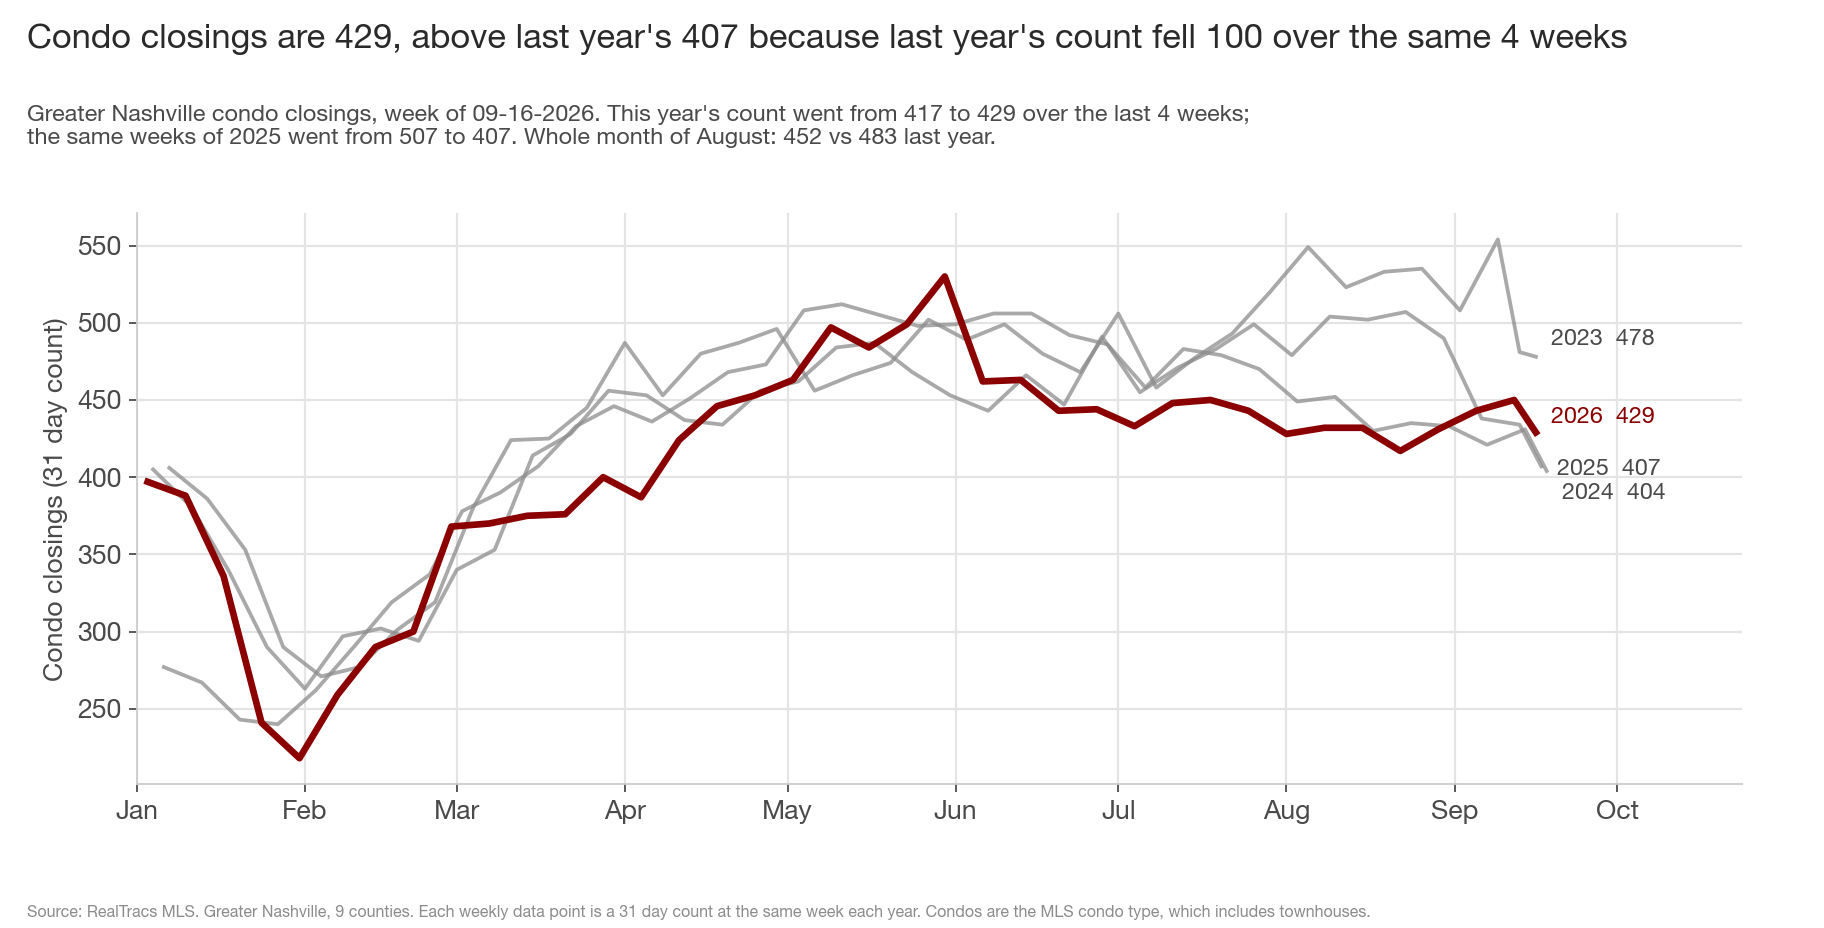
Not yet. Condo closings are 429 over the last 31 days, against 407 last year (+5.4%), 404 in 2024 and 478 in 2023. The increase vs last year comes from last year's count falling: over the last 4 weeks this year's count went from 417 to 429 while the same weeks of 2025 fell from 507 to 407. The whole month of August closed 452 condos, against 483 in August 2025 (-6.4%), 436 in 2024 and 514 in 2023.
The July 30 post said condo closings should reach 475 by early October if the summer's contract increase held, and the August 18 post put the range at 457 to 475. Closings are at 429, and the contracts that become October closings are now 11.2% below last year.
8. What are condos selling for per square foot?
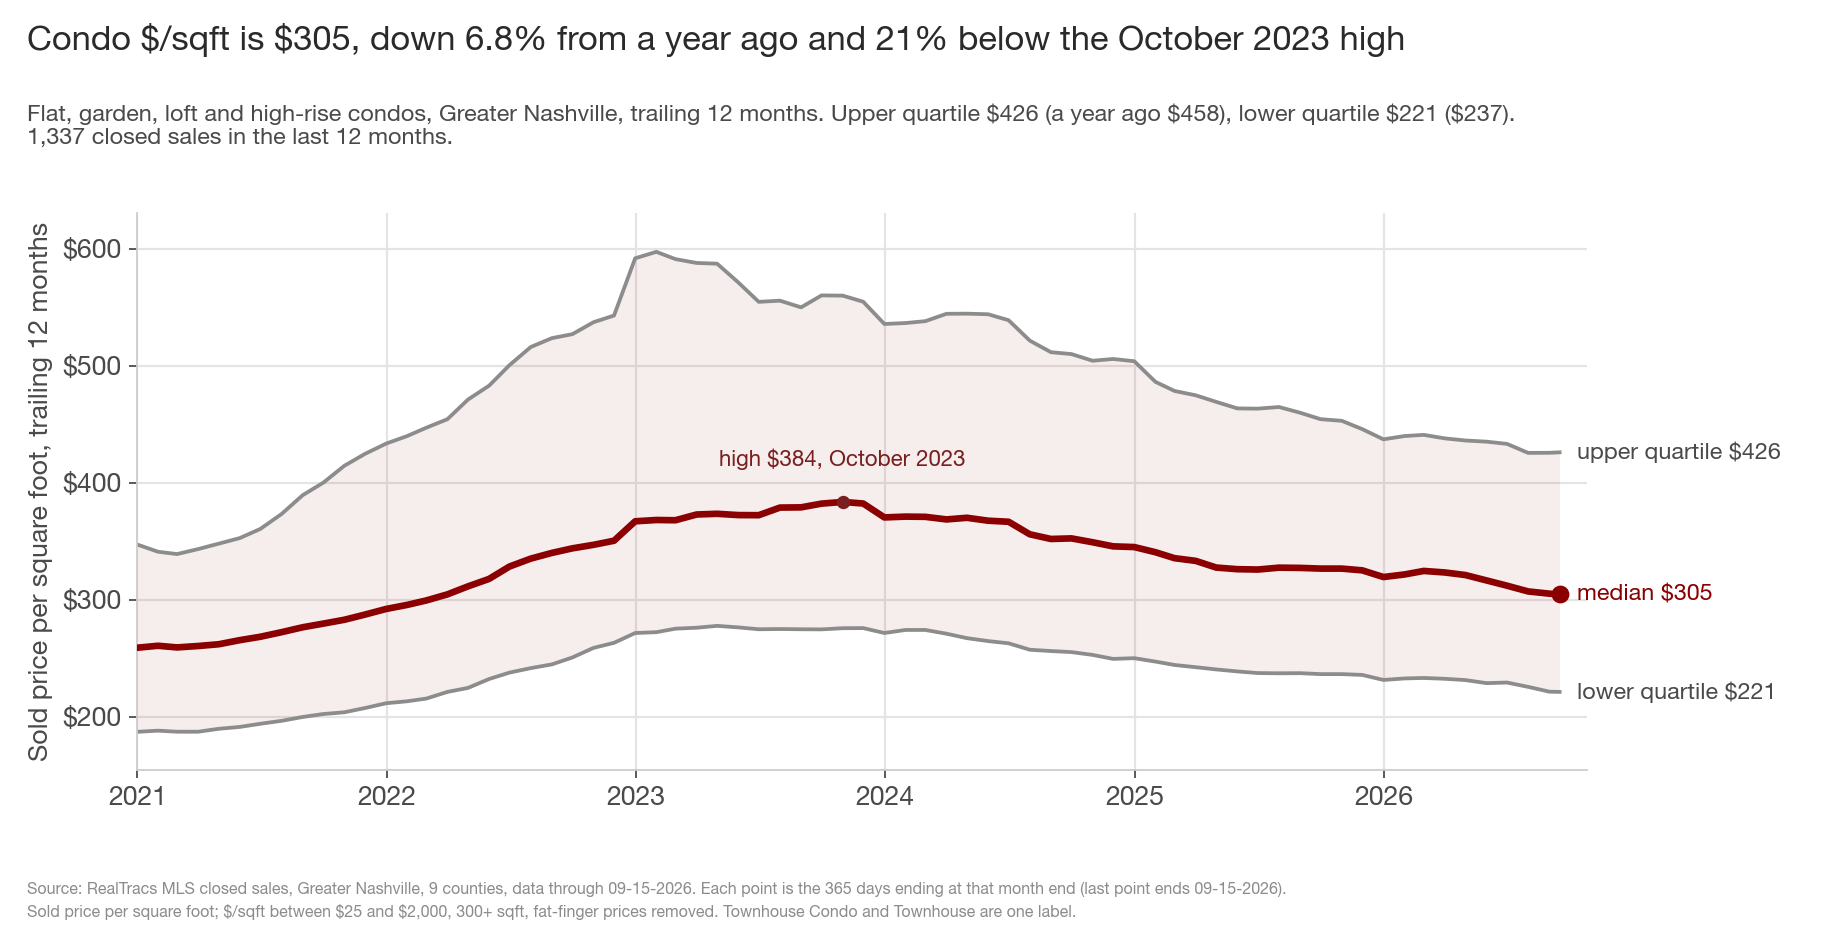
Flat, garden, loft and high-rise condos sold for a median of $305 per square foot over the last 12 months, against $327 in the 12 months before that (-6.8%), and 21% below the $384 of the 12 months to October 2023. 1 in 4 condos sold above $426 per square foot, down from $458 a year before, and 1 in 4 sold below $221, down from $237, so the whole range moved down. 1,337 condos closed in the window.
9. What about townhouses?
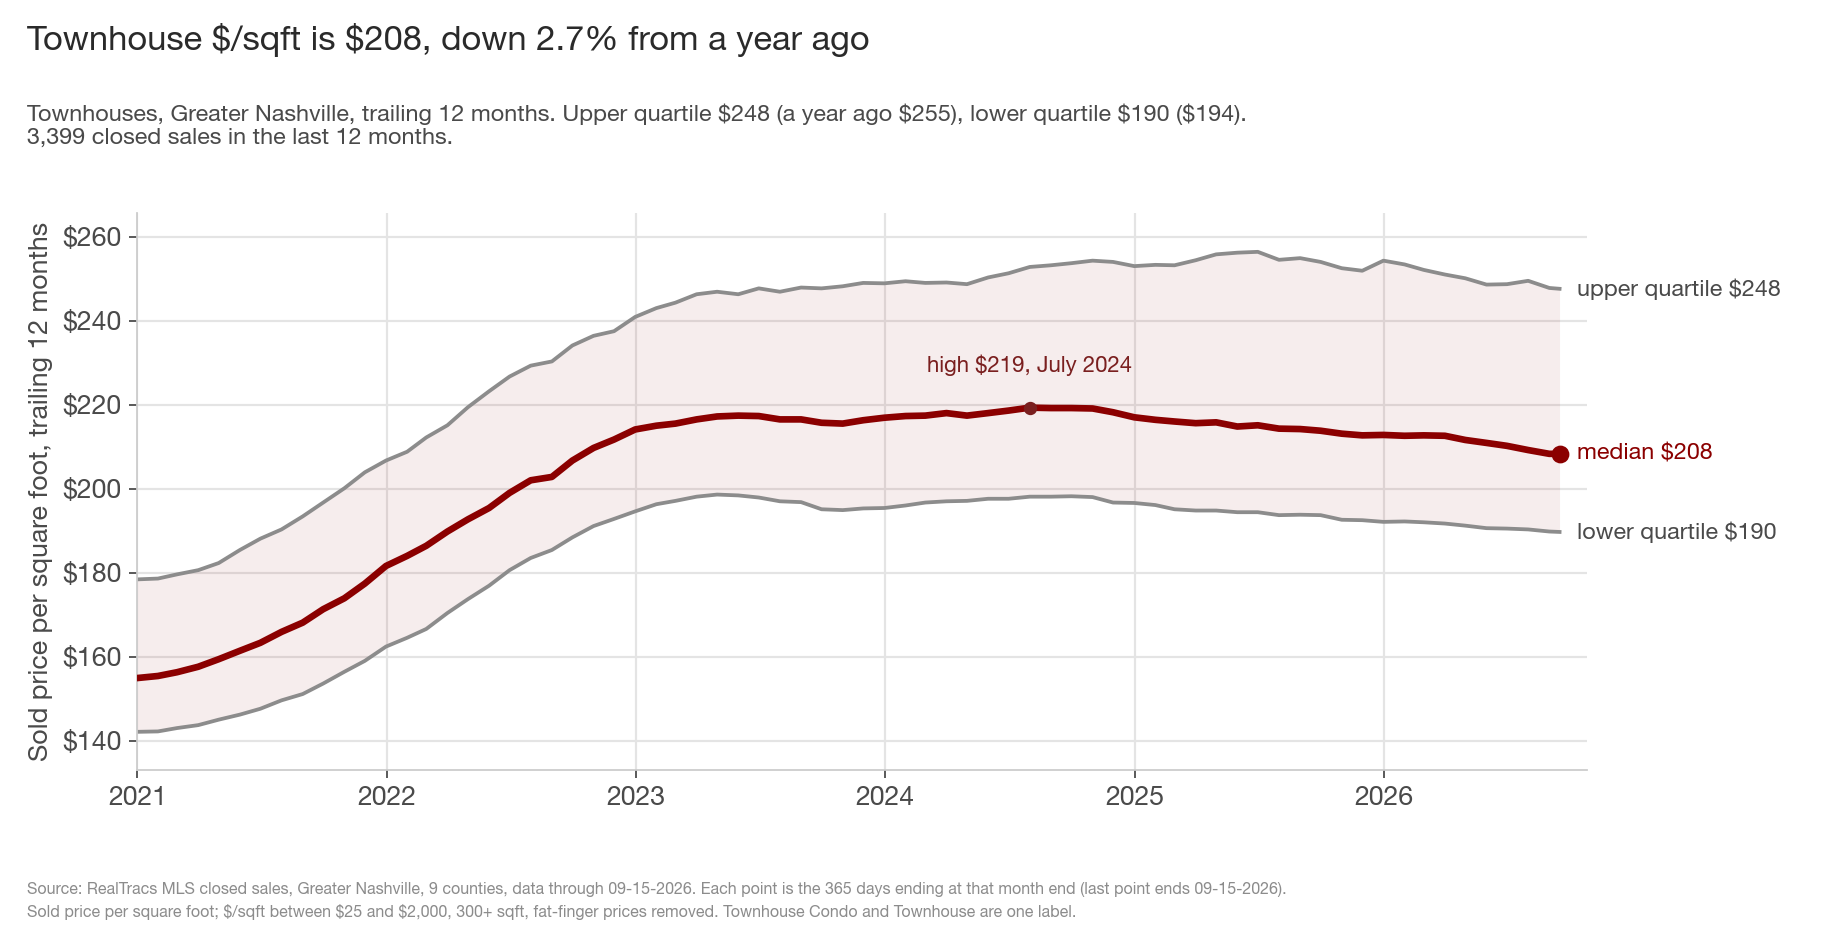
Townhouses sold for a median of $208 per square foot, 2.7% below the $214 of the 12 months before and 5% below the July 2024 high of $219. 1 in 4 townhouses sold above $248 (from $255) and 1 in 4 below $190 (from $194). 3,399 townhouses closed in the window, more than condos and HPR-attached homes combined.
10. And HPR-attached homes?
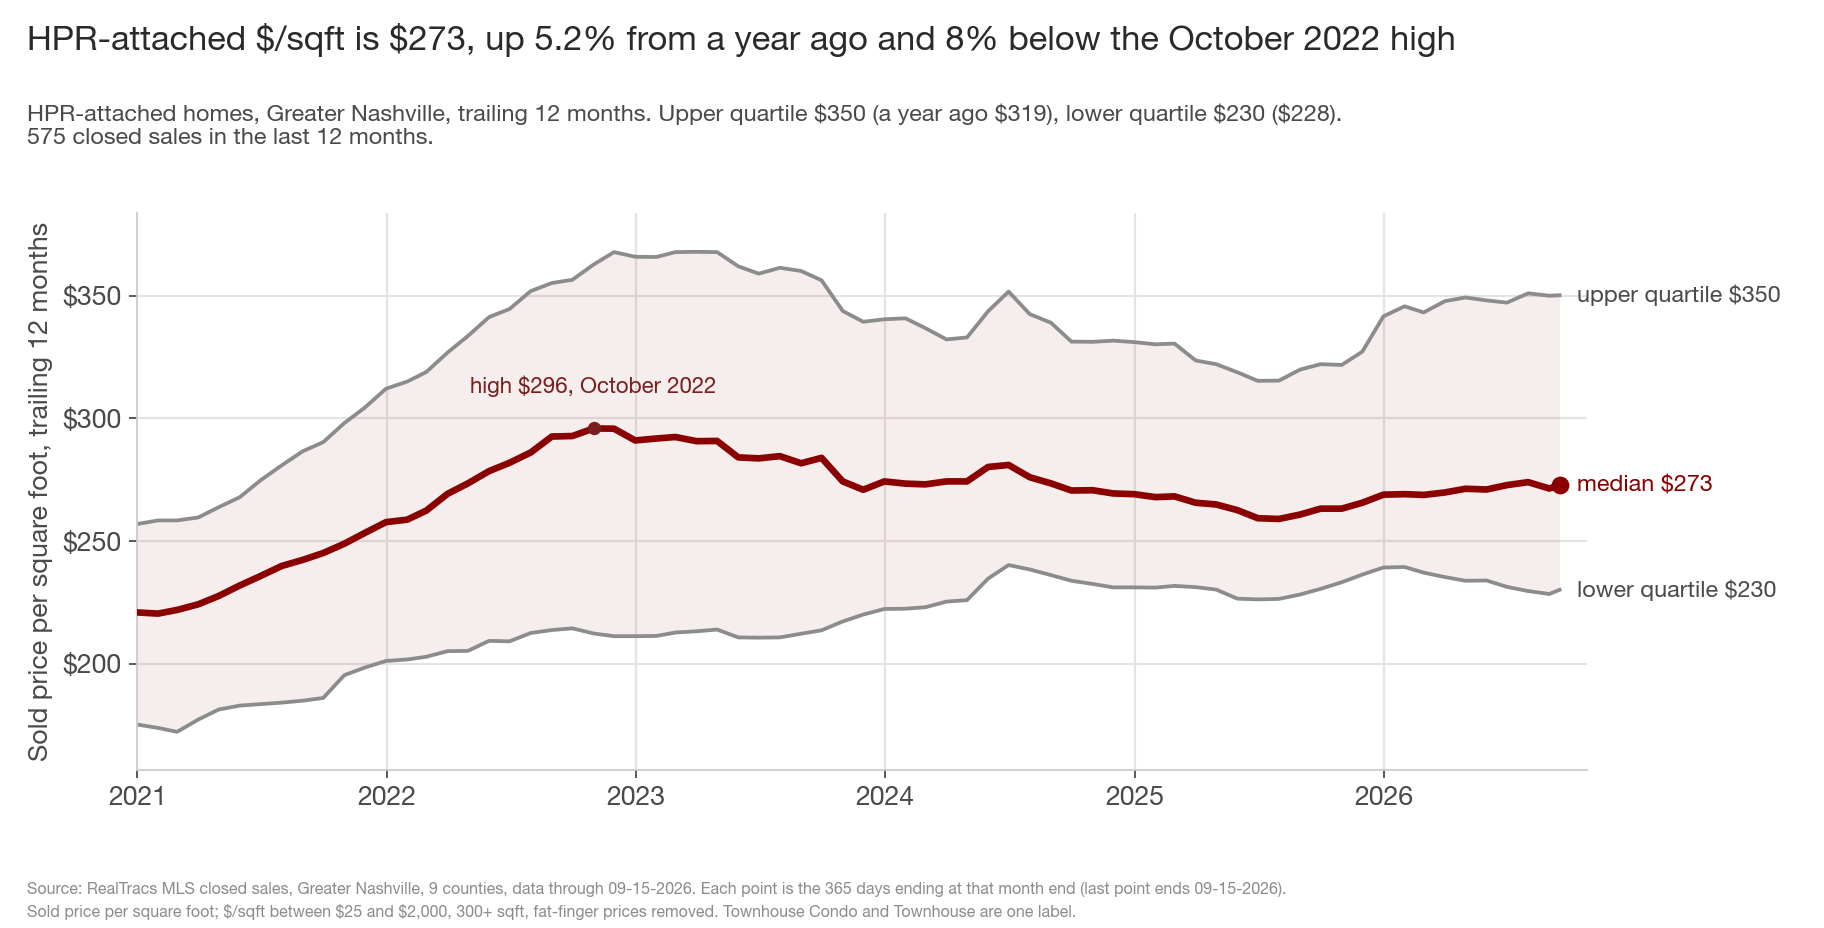
HPR-attached homes went the other way. The median is $273 per square foot, 5.2% above the $259 of the 12 months before, and 8% below the October 2022 high of $296. 1 in 4 sold above $350, up from $319, while the bottom of the range held at $230. 575 HPR-attached homes closed in the window.
11. The four property types side by side
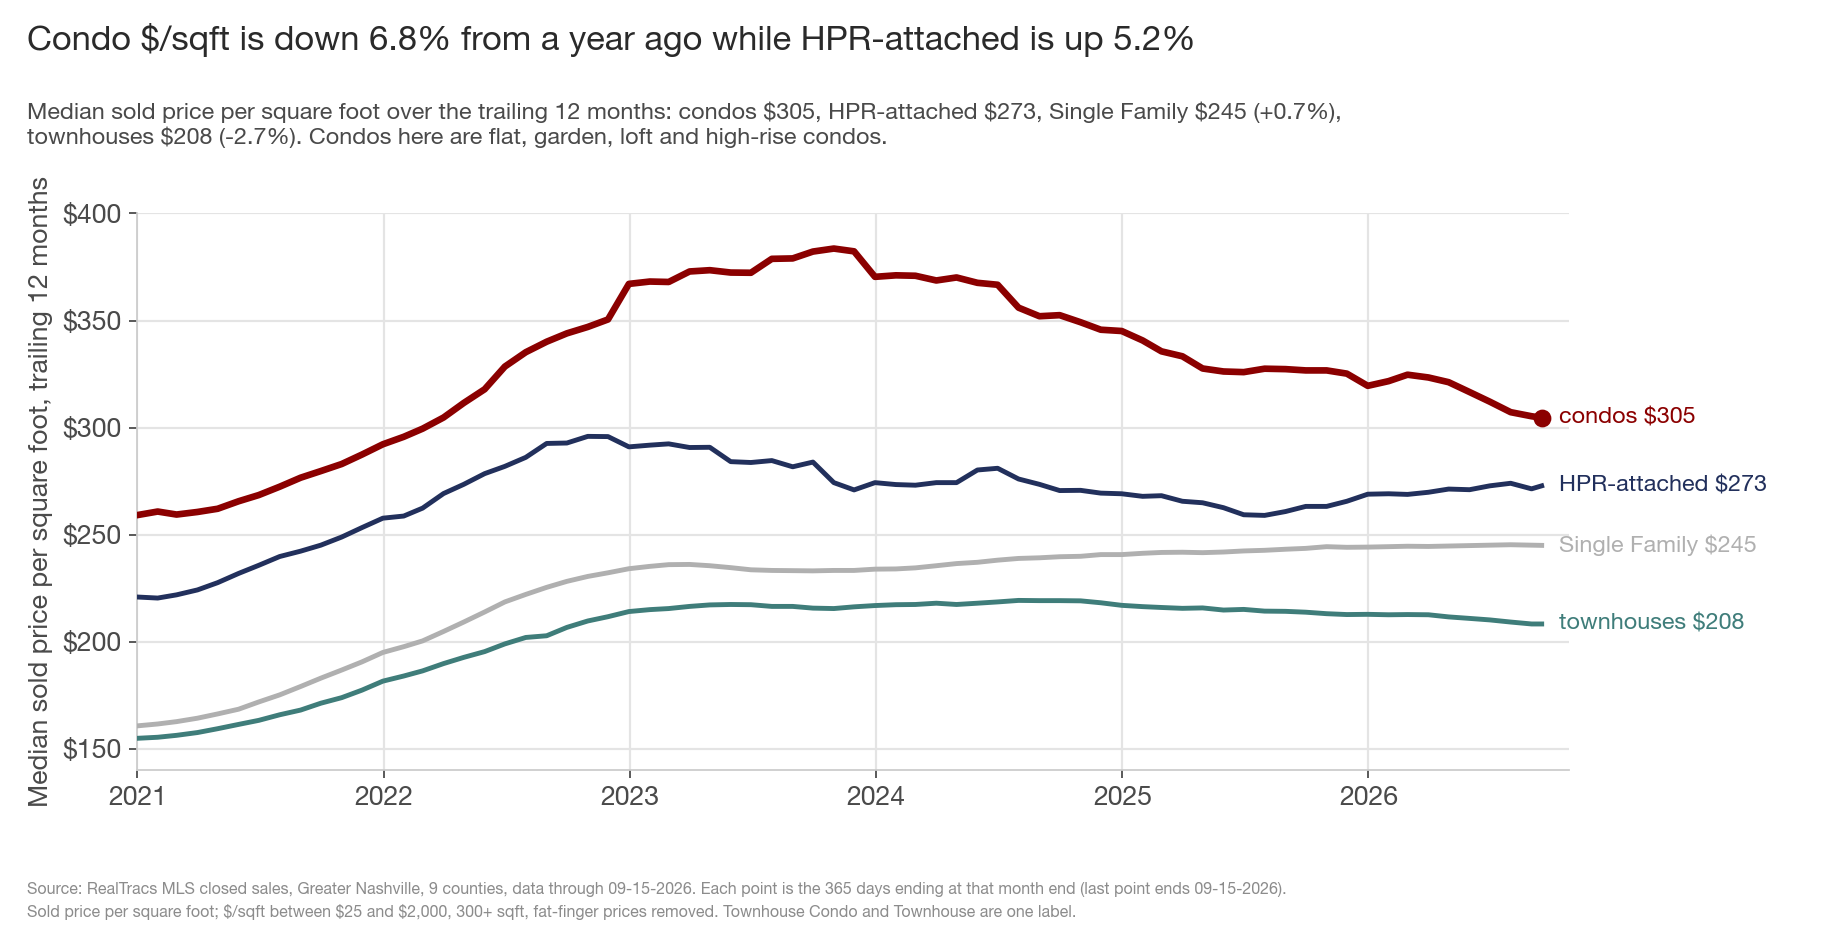
Condos are still the most expensive of the four per square foot at $305, then HPR-attached at $273, Single Family at $245 (+0.7% from the 12 months before) and townhouses at $208. Condos are the only one of the four more than 10% below their high. Single Family is at its high.
12. Which resales had the biggest gains and losses?
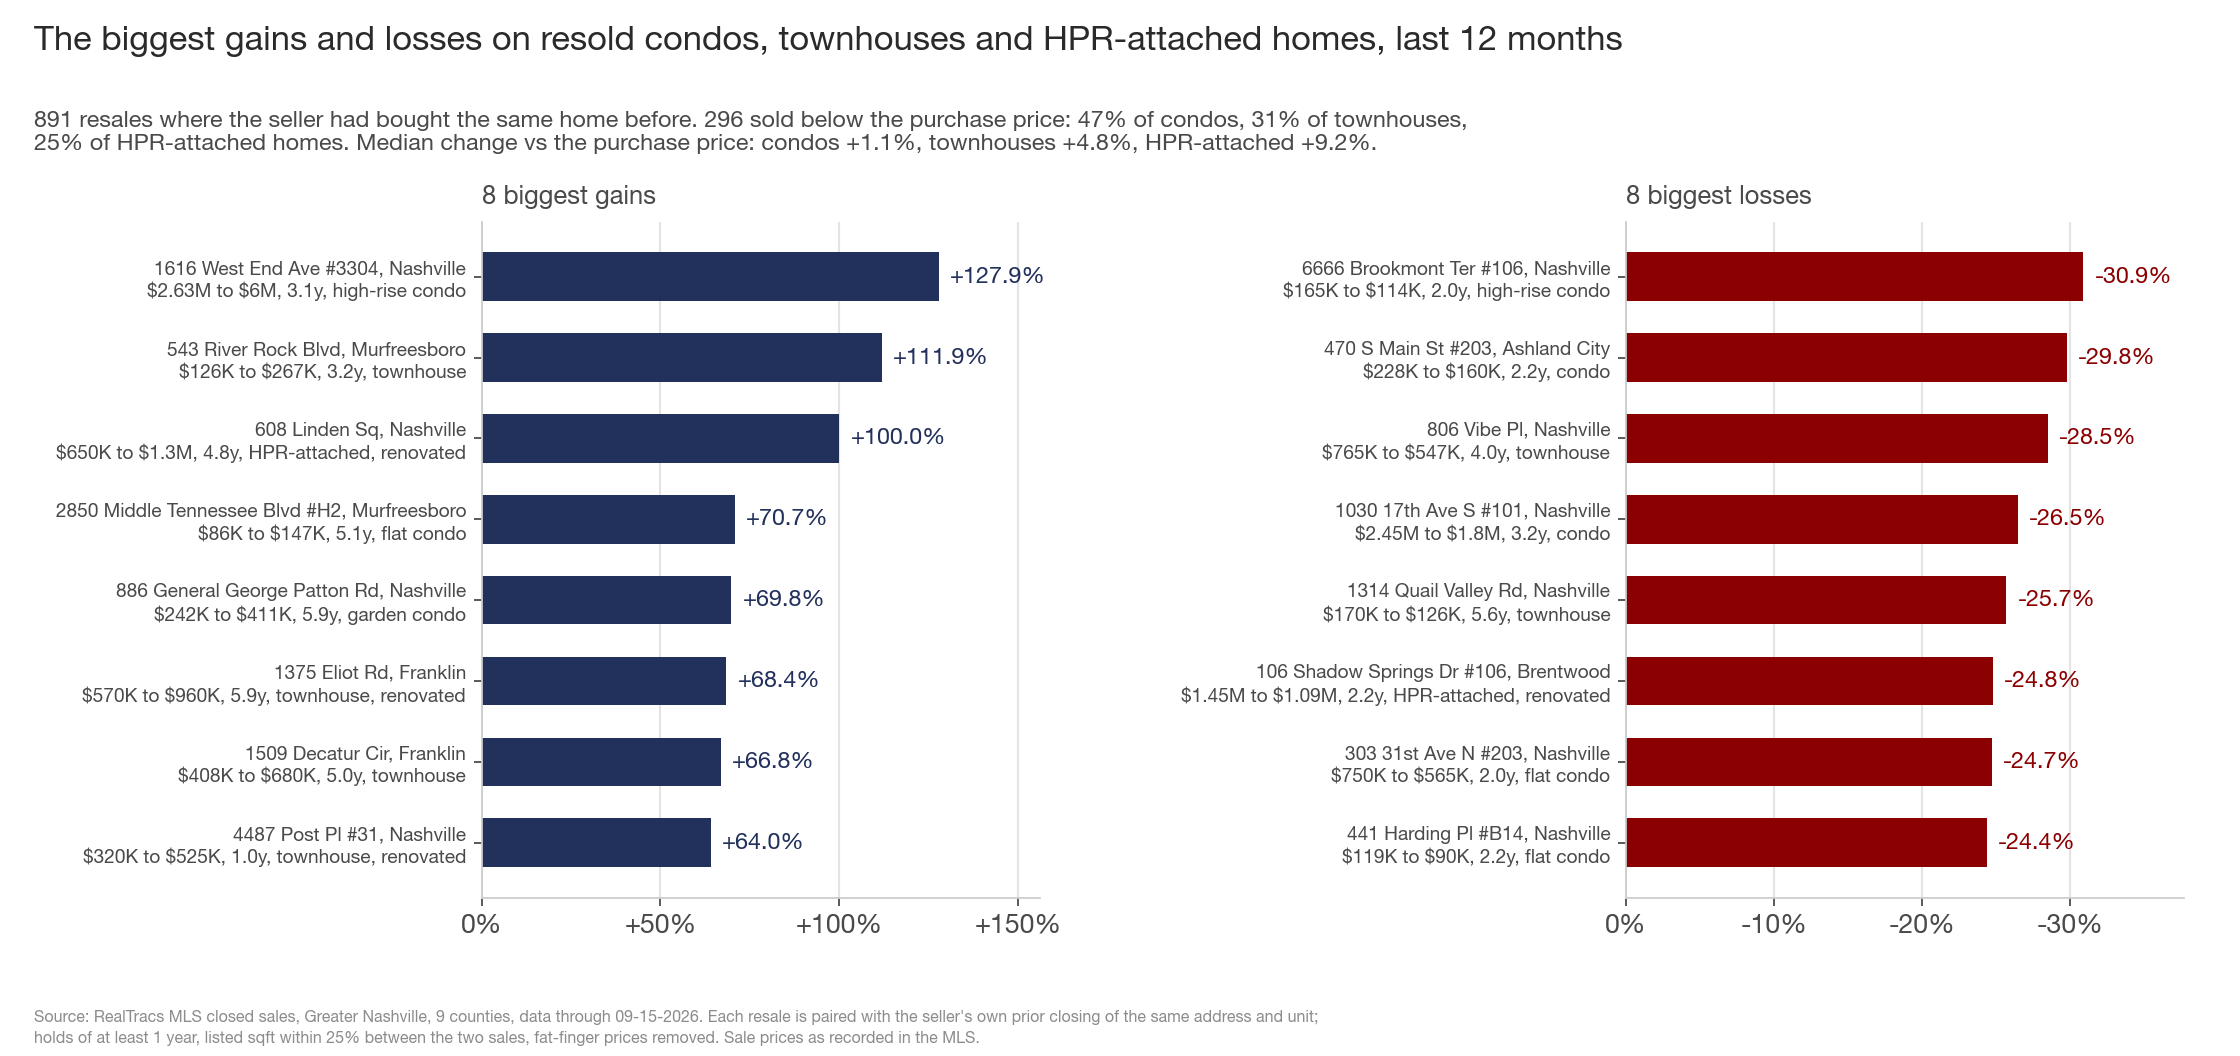
891 condos, townhouses and HPR-attached homes sold again in the last 12 months where the seller had bought the same home before. 296 of them, 33%, sold below what the seller paid: 47% of condos, 31% of townhouses and 25% of HPR-attached homes. The median change vs the purchase price is +1.1% for condos, +4.8% for townhouses and +9.2% for HPR-attached homes.
The biggest increase is 1616 West End Ave #3304, bought for $2.63M in 2023 and sold for $6.0M. The biggest loss is 6666 Brookmont Ter #106, bought for $165,000 and sold 2 years later for $114,000 (-30.9%). Sale prices come from the MLS. The list does not count homes held under 1 year or homes where the listed square foot count changed more than 25% between the two sales.
Adding it up
- Condo contracts are 379, 11.2% below last year and below all three prior years for the 2nd consecutive week, a month after being 11.7% above.
- The count fell 13.7% in a month while the same weeks of 2025 and 2024 rose. The 30 year mortgage rate rose from 6.71% to 7.19% over the same weeks; it fell in both prior years.
- Resale condo contracts are 17.5% below last year; new construction is even with last year.
- Townhouses are below every prior year at 284, and flat, garden, loft and high-rise condos are 21.5% below last year at 95.
- Condos have 7.0 active listings per contract, the most for this week in the 4 years of data; resale condos are at 8.5.
- Rutherford, Sumner, Williamson and Davidson are down; Wilson is up. The $300K to $500K band is 30 of the 48-contract decline.
- Closings are 5.4% above last year because last year's count fell 100 in the same 4 weeks.
- Condos sold for $305 per square foot over the last 12 months, 6.8% below the 12 months before and 21% below the 2023 high. Townhouses are $208 (-2.7%) and HPR-attached homes $273 (+5.2%).
- 47% of condos sold again in the last 12 months went for less than the seller paid, vs 31% of townhouses and 25% of HPR-attached homes.
The July 30 post and the August 18 post found condo contracts above every prior year and asked whether the contracts would turn into closings. The contracts fell first. The month's decline came as mortgage rates went above 7% for the first time since May 2025. Single Family contracts rose 2.9% in the same month, so the decline is limited to condos.
For a condo seller, there are 2,661 condos for sale, 7 for every contract, and 40% have cut the asking price. For a buyer of a flat, garden, loft or high-rise condo, there are 12 listings for every contract. For builders, new construction condo contracts are even with last year at 139, 34 below a month ago.
What to watch: homes going under contract now close in 60 to 90 days. Last year's condo closings were 421 the week of October 25 and 391 the week of November 1. I expect condo closings to be below 421 by the last week of October. A count above that would mean the contract decline did not carry into closings. On the contract side, last year's count was 393 on October 4 and 390 on October 25; I expect this year to stay below both. A count above 390 at the end of October would mean this month's decline was a one month move.
Data through the week of 09-16-2026, Greater Nashville (9 counties: Davidson, Williamson, Rutherford, Wilson, Sumner, Maury, Dickson, Cheatham, Robertson). Each weekly data point is a 31 day count at the same week each year. Condos are the MLS condo type, which includes townhouses; the townhouse and other condo numbers come from the daily MLS data on the same days and add up to the weekly count. Price bands use the sales price for contracts and the list price for active listings. New construction vs resale is as reported in the MLS. Whole month numbers and the price per square foot are from the closed sales pull with data through 09-15-2026; each price per square foot point is the 365 days to that month end. HPR-attached is the RealTracs Horizontal Property Regime attached type. Each resale is compared with the seller's own prior closing of the same address and unit. Mortgage rates are the Mortgage News Daily 30 year fixed rate. Source: RealTracs MLS; Mortgage News Daily.