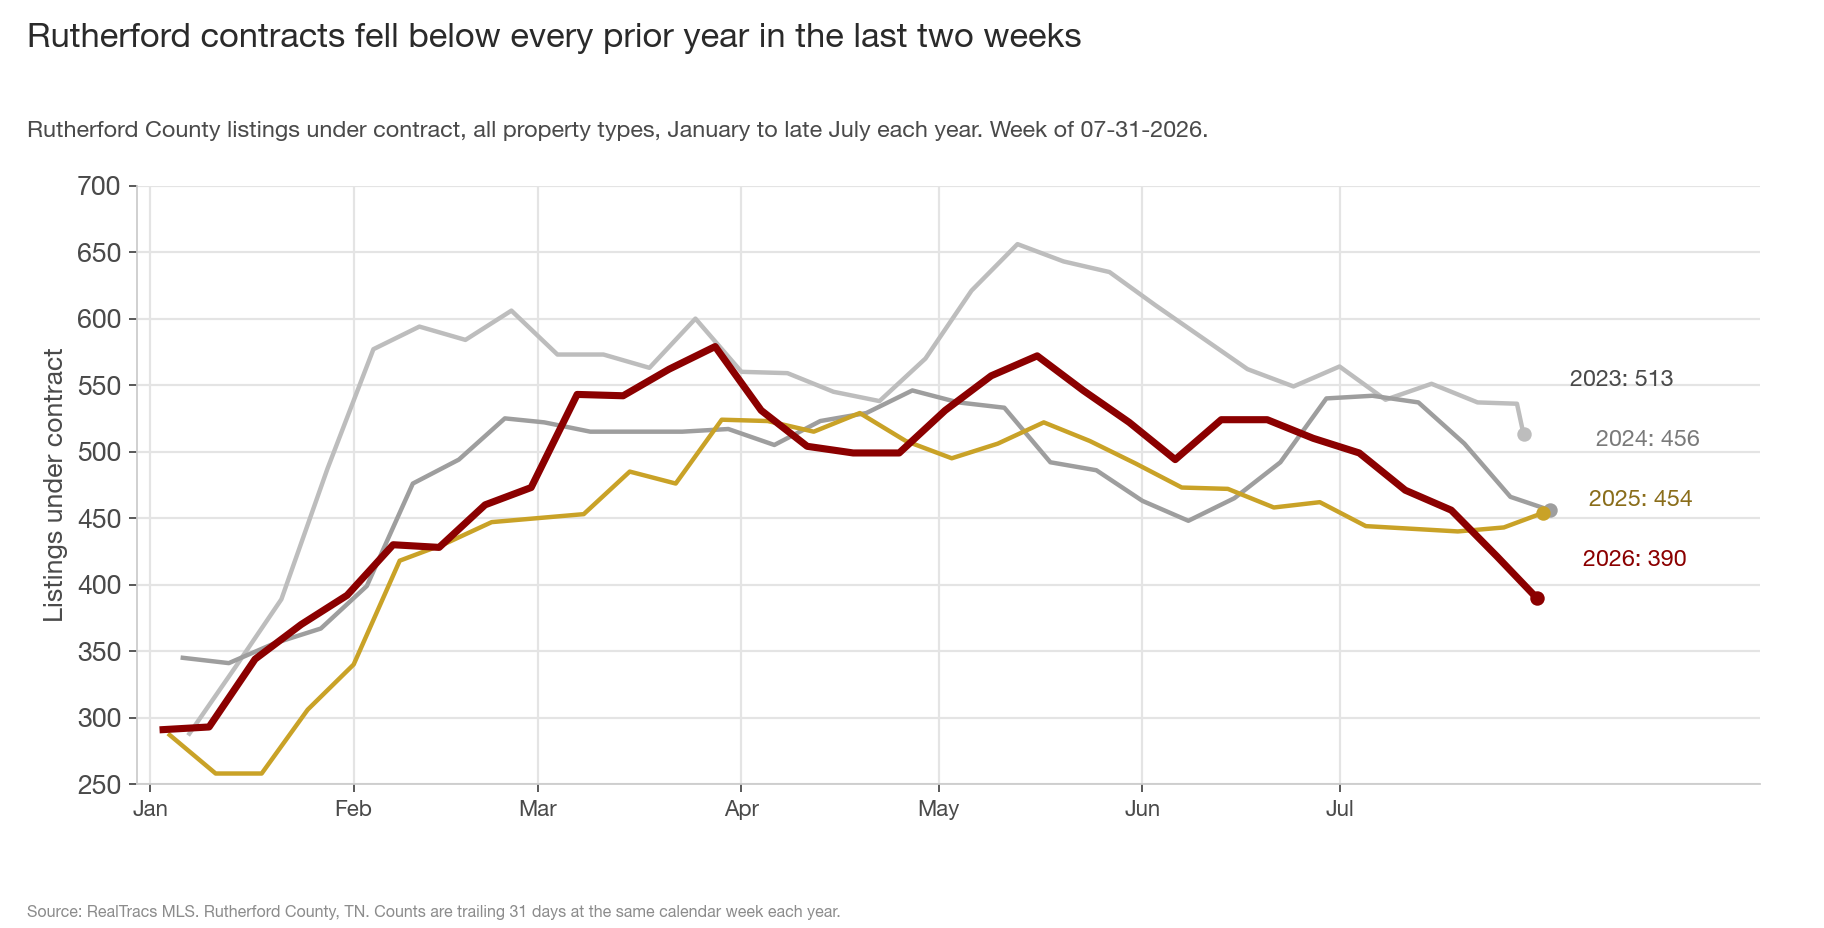
Rutherford County has 390 listings under contract, against 454 at the same week of 2025, 456 in 2024 and 513 in 2023. That is the fewest for late July in the four years of data, and fewer than any week since late January. Four weeks ago Rutherford was running +12.4% ahead of last year.
The drop holds against 2023 and 2024 as well as 2025, so it is independent of the April 2025 tariff base that has distorted year-over-year readings all summer. The metro as a whole is down 5.3%; Rutherford is down 14.1%, the most of the nine counties. The six charts below cover how fast it turned, how it compares, and what is behind it.
1. Rutherford contracts fell below every prior year in the last two weeks
Rutherford ran above 2025 every week from early May through mid-July. It crossed below all three prior years the week of 07-25, and this week the gap widened to 64 contracts below the closest year. The widest gap earlier this year was 30, in mid-April.
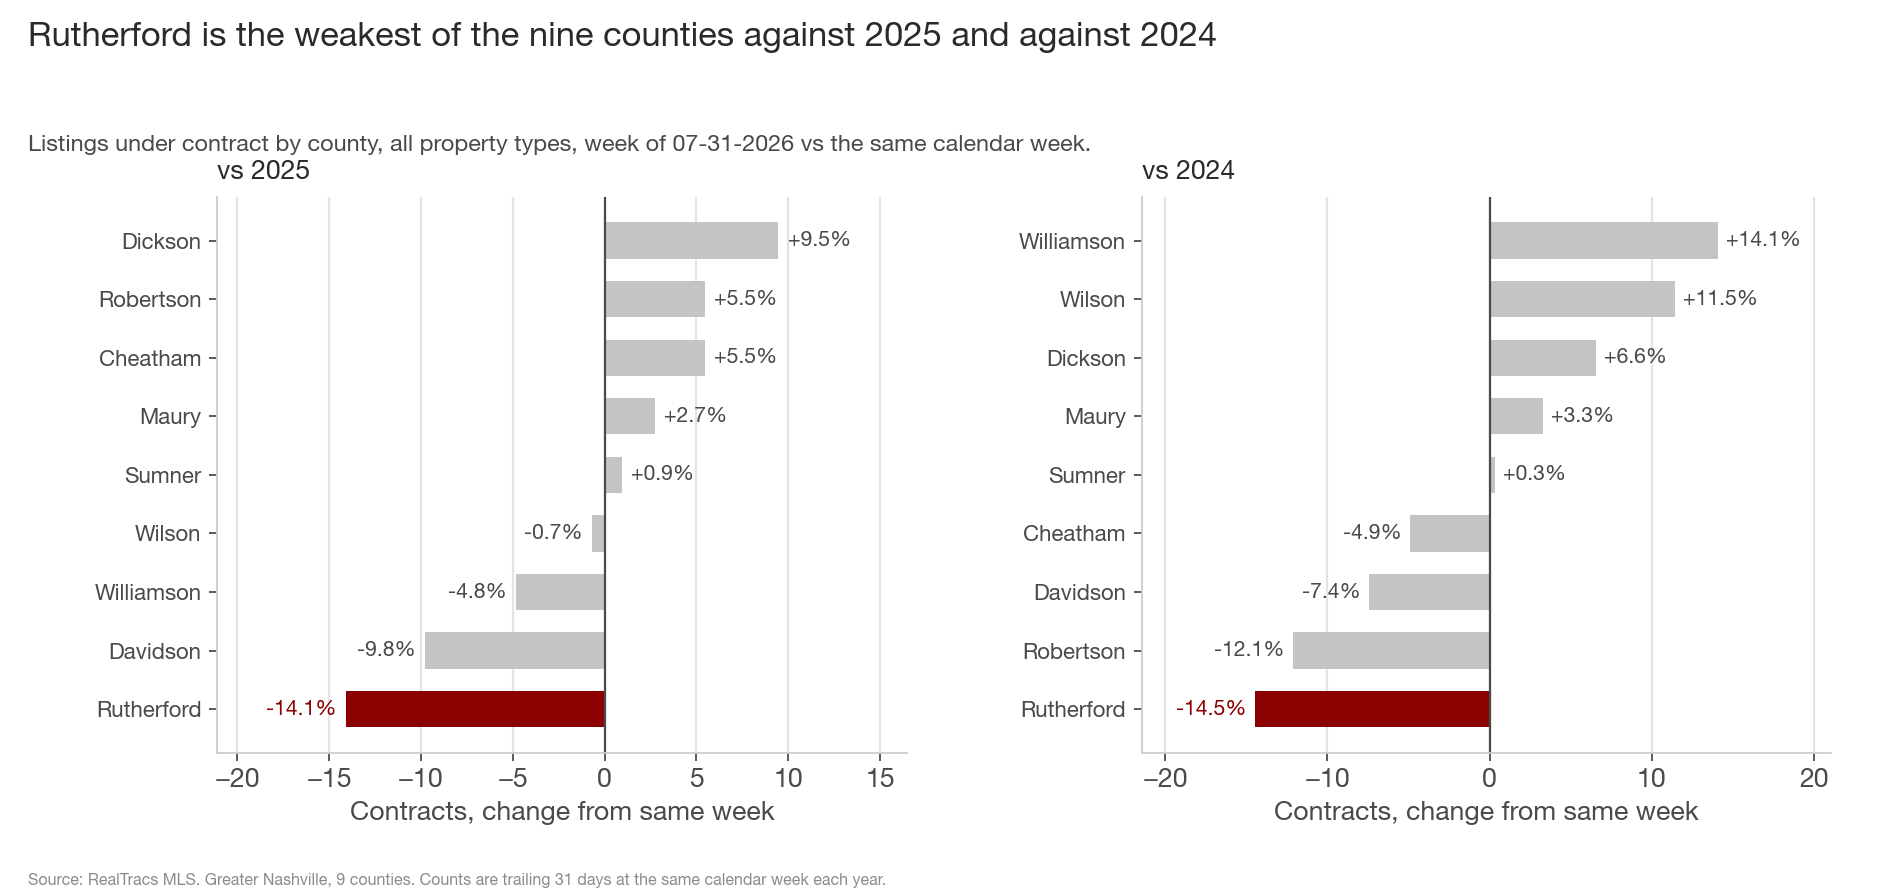
2. Rutherford is the weakest of the nine counties against 2025 and against 2024
Rutherford is down 14.1% on 2025 and 14.5% on 2024, last of the nine counties on both comparisons, and its 24.0% drop against 2023 is also the largest. Davidson, which has been below all three prior years in 17 different weeks this year, is down 9.8% and 7.4% on the same comparisons, so Rutherford is now falling faster than the county that has been weak all year.
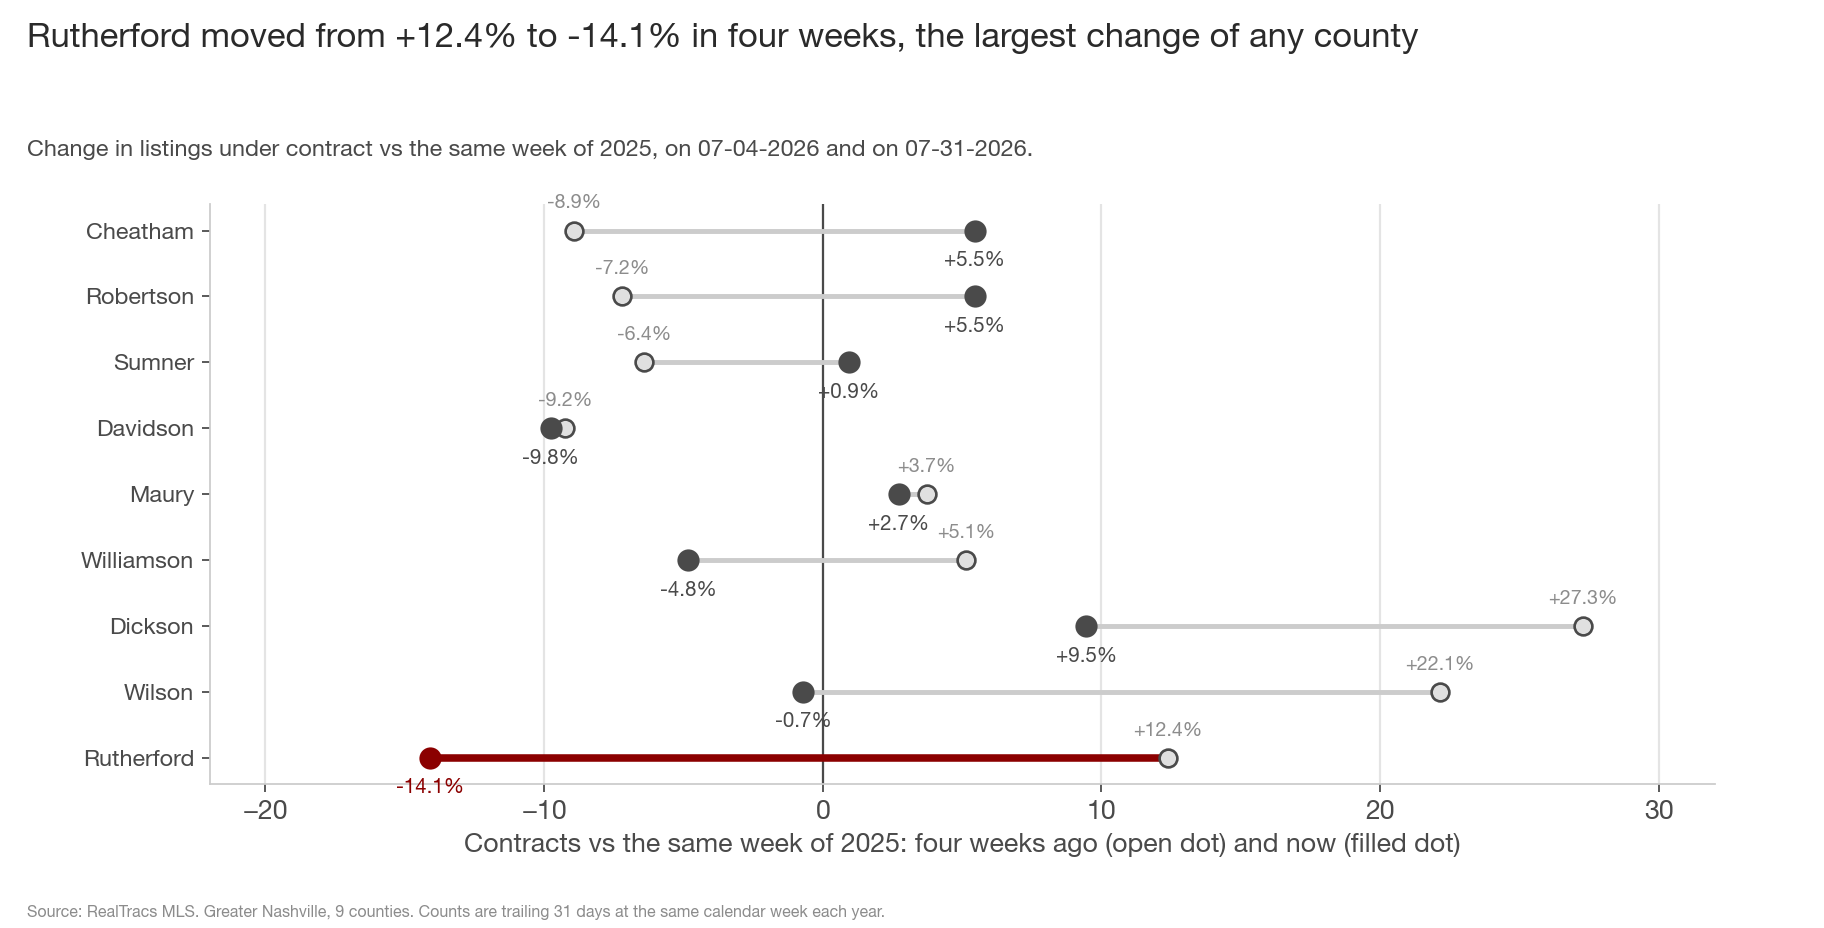
3. Rutherford moved from +12.4% to -14.1% in four weeks, the largest change of any county
The change comes from Rutherford's own count: contracts fell from 499 on 07-04 to 390 now, while last year's matching weeks rose slightly, from 444 to 454. Wilson had the second largest move, from +22.1% to -0.7%, though Wilson is still up 11.5% on 2024, so its drop so far is only a return to the 2025 base.
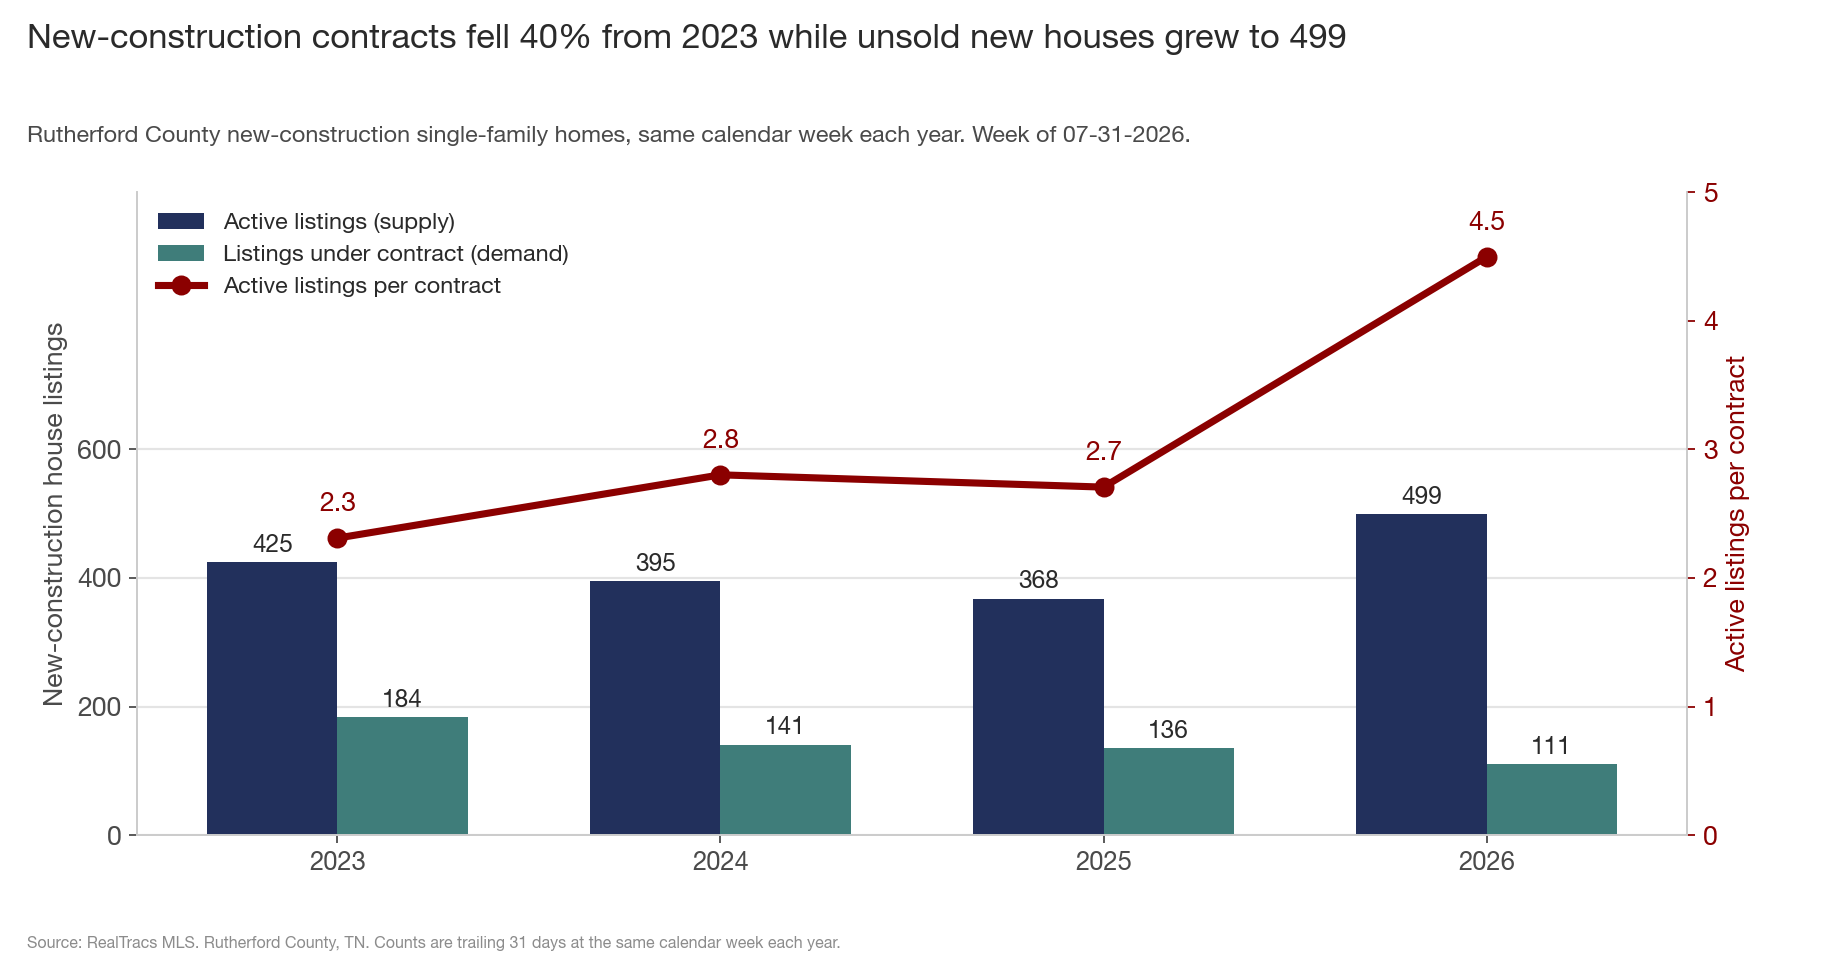
4. New-construction contracts fell 40% from 2023 while unsold new houses grew to 499
Rutherford was the county where builders were still adding on both sides as recently as June. Now new-construction house contracts are at 111, down 18% on 2025, 21% on 2024 and 40% on 2023, and resale house contracts are also below all three years at 218. Unsold new-construction houses went the other way, to 499, more than any week in the prior three years, which moves new-build listings per contract from 2.7 last year to 4.5.
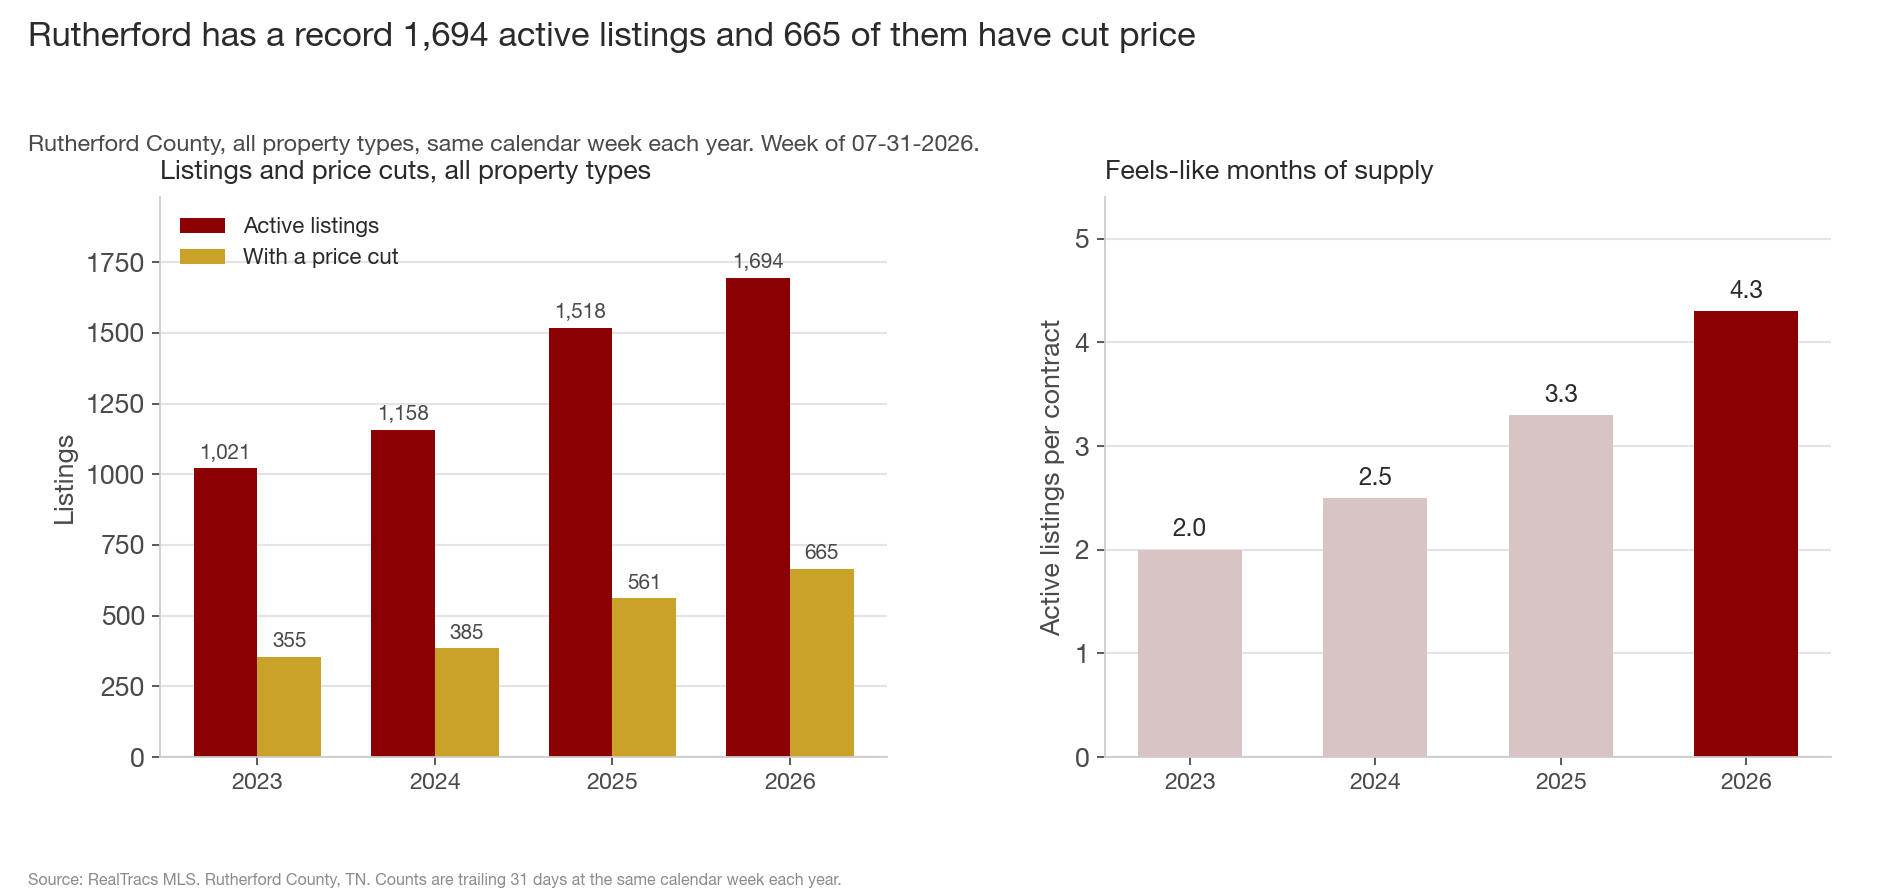
5. Rutherford has a record 1,694 active listings and 665 of them have cut price
Active listings hit 1,699 last week, the highest of any week in the four years of data, and sit at 1,694 now, up 66% from late July 2023. 665 of them have cut price, the most for late July in the data (the all-time high is 678, from October 2025), and the cut share of 39.3% is also a late-July high. Active listings per contract reached 4.3, from 3.3, 2.5 and 2.0 at this week in the three prior years. More listings are meeting fewer buyers who can pay at current prices: the county's single-family median has sat at $450,000 since mid-June, while the same week last year was $470,000.
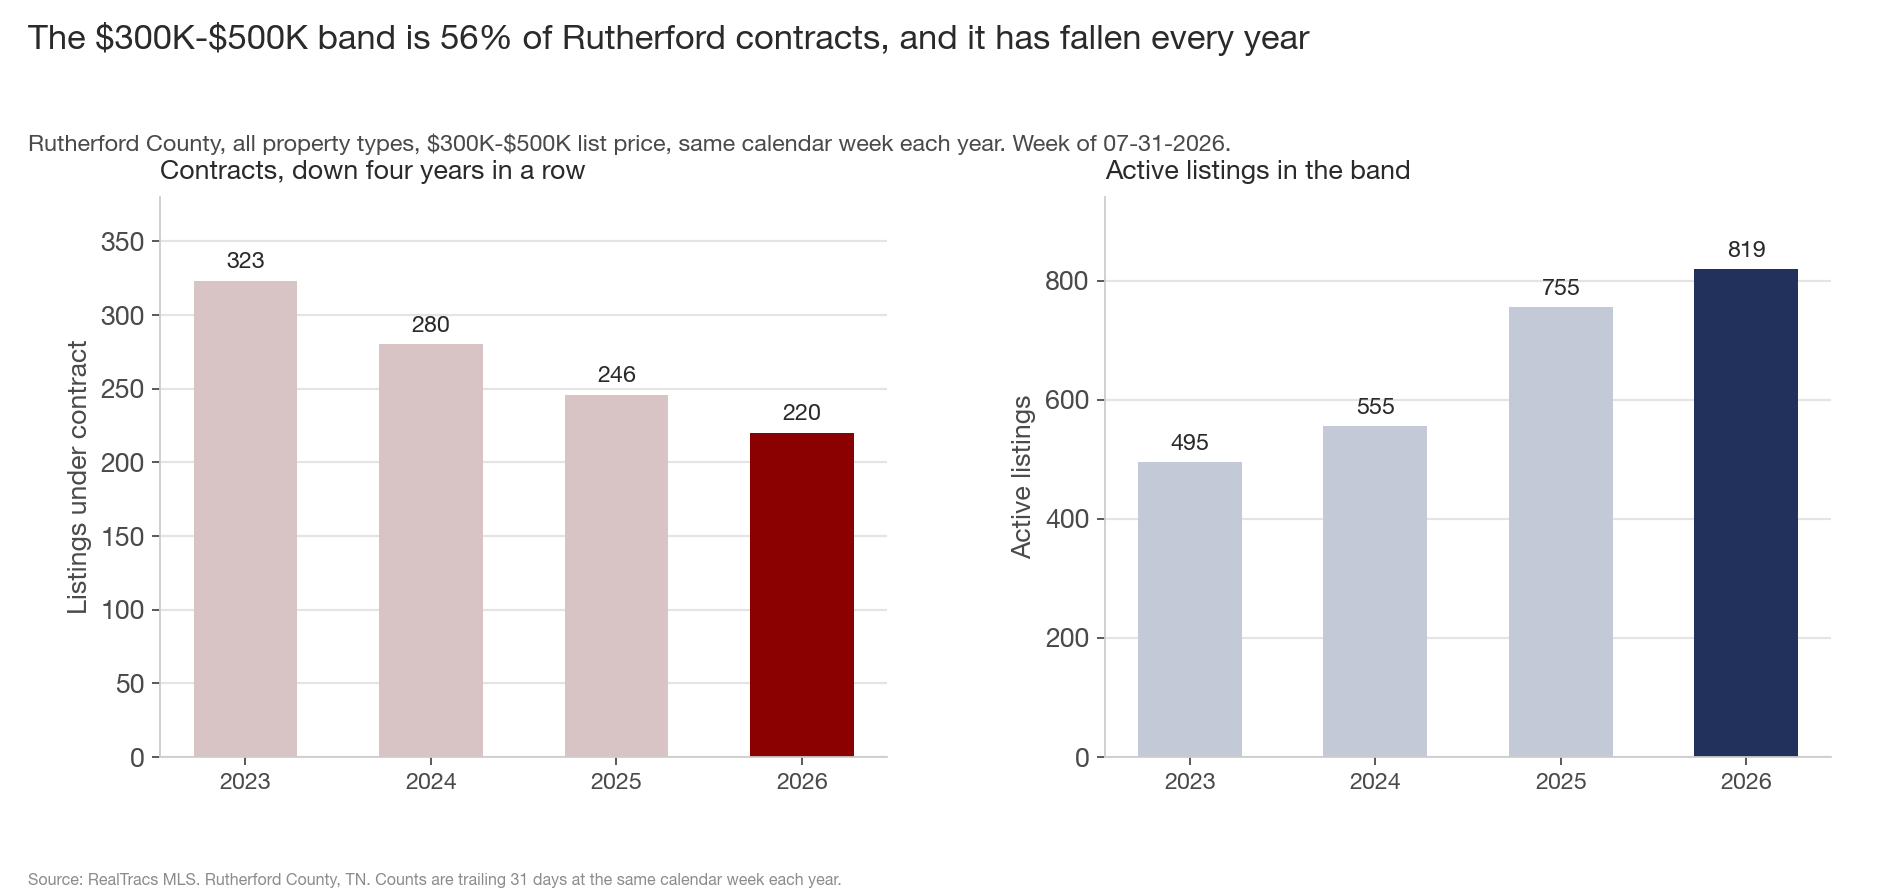
6. The $300K-$500K band is 56% of Rutherford contracts, and it has fallen every year
Rutherford's biggest price band by far is $300K-$500K, at 220 of the 390 contracts. That band has fallen four years in a row, 323 to 280 to 246 to 220, a 32% decline since 2023, while its active listings rose to 819 from 755 last year. This week's drop is not only that band, since every band between $300K and $2M is below 2025 and under $300K is flat at 37, but the four-year slide is concentrated there.
What this adds up to
- Rutherford has 390 contracts, below every prior year in the data, after running above 2025 all spring.
- It is the weakest of the nine counties against 2025, 2024 and 2023, and its four-week change, +12.4% to -14.1%, is the largest of any county.
- Both sides of the single-family market are at four-year lows: new-construction contracts at 111 and resale at 218.
- Unsold new-construction houses are at 499, more than any week in the prior three years, and new-build listings per contract rose from 2.7 to 4.5 in a year.
- Active listings are at a record 1,694, with a late-July high 39.3% of them cut.
Two things slowed in Rutherford at once: builders have their most unsold houses in the data against their fewest contracts, and the $300K-$500K band that makes up 56% of the county's demand has now fallen four years in a row. Davidson's weakness this year came with builders pulling listings back. Rutherford's is arriving with listings still growing, which is why the listings-per-contract reading moved faster here than anywhere else.
For sellers in Rutherford, 4.3 active listings per contract and a record 1,694 on the market means pricing against more competition than any point in the last four years. For buyers, the $300K-$500K band has 819 active listings against 755 last year and fewer buyers competing for them. For builders, 4.5 unsold houses per contract is the number to watch before adding more.
What to watch: contracts signed now close in roughly 60 to 90 days. Rutherford closings are still above last year, 502 against 486. If the contract deficit persists, closings should fall below 2025 by mid-October. If closings are still at or above last year then, the July drop was noise. The second reading is the 665 price cuts: if the contract count stays under 400, that number should pass the October 2025 high of 678 this fall.
Data through week ending 07-31-2026, Greater Nashville (Davidson, Williamson, Rutherford, Wilson, Sumner, Maury, Dickson, Cheatham, Robertson). Counts are trailing 31 days at the same calendar week each year. Source: RealTracs MLS.