40 condos (flat, garden, loft and high-rise condos, so not townhouses) closed between June 1 and August 26 where the seller had bought the same unit in June 2022 or later. 29 of them, 72%, closed below what the seller paid, vs 44% last year. In the summer of 2024 it was 10%. Single Family homes are at 17% and townhouses at 48% for sellers who bought in the same window, so condos have the most losses of the three property types by far.
Every seller in this count bought in the last 4 years, June 2022 or later, after the spring 2022 price peak. The August 15 post compared every Davidson County sale back to 1980 to the same home's previous price and found almost 1 in 10 closing below it this year; this post is the same question asked of the metro's recent buyers, broken out by property type. 5 charts below cover the loss share for each type, the median outcome, the purchase year, the price per square foot, and the supply and demand behind it. The full list of the 40 condo resales is at the bottom.
1. How many recent buyers closed below their previous purchase price this summer?
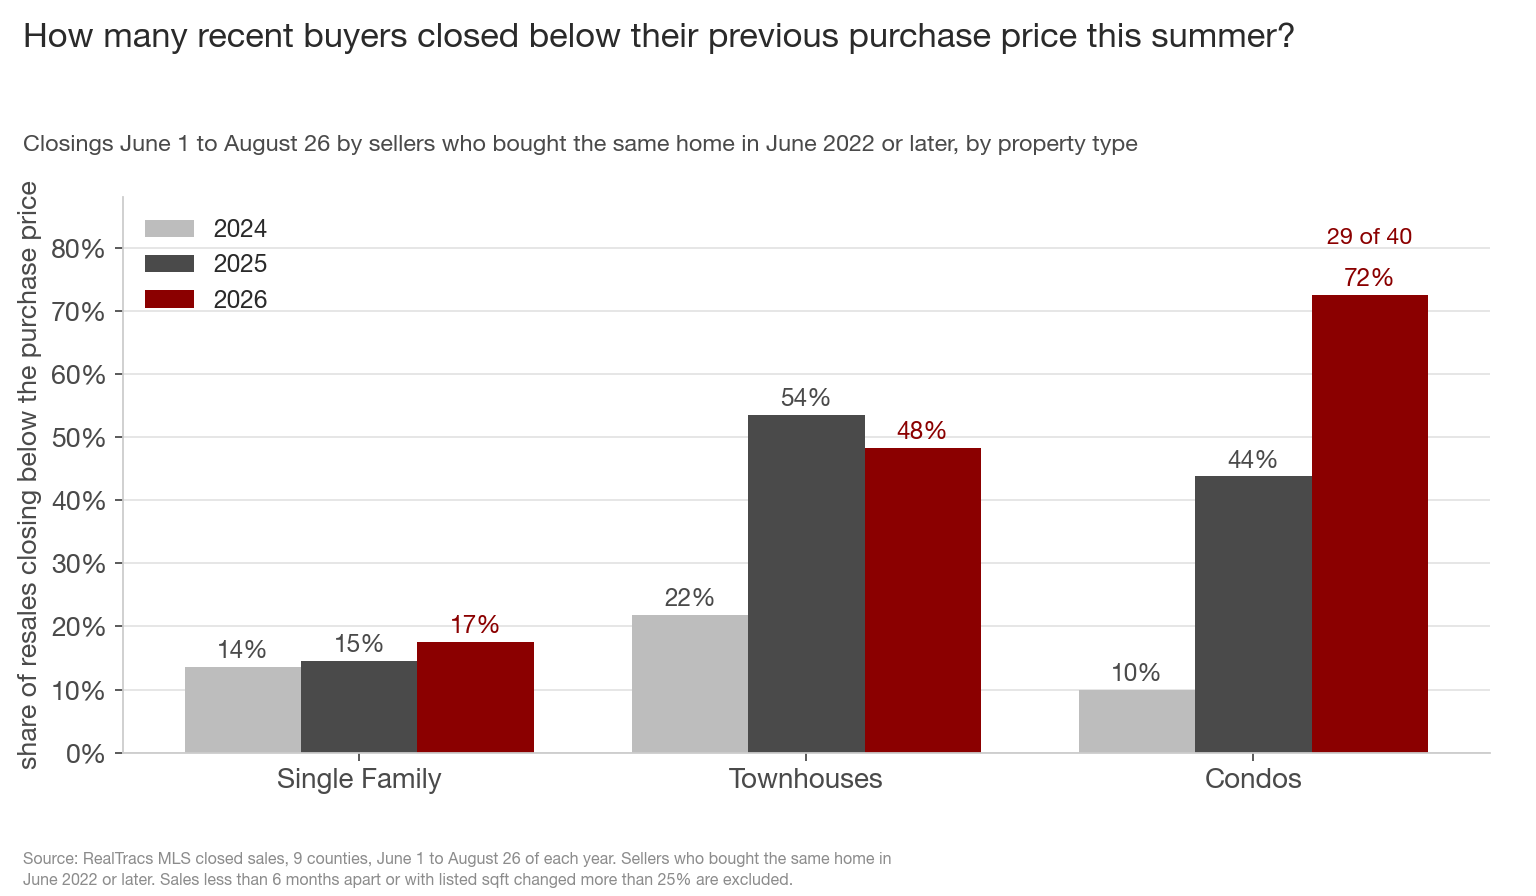
Each closing from June 1 to August 26 is compared to the price the seller paid for the same home, and only sellers who bought in June 2022 or later are in the count. For Single Family homes, the share closing below the purchase price went 14%, 15%, 17% over the last 3 years. Townhouses went 22%, then 54%, and now 48%, so last summer was their worst. Condos went 10%, 44%, 72%.
The comparison excludes homes that sold twice within 6 months and homes where the listed sqft changed more than 25% between the two sales, so a home that got much bigger between sales does not count as the same home.
2. What does the median outcome look like now?
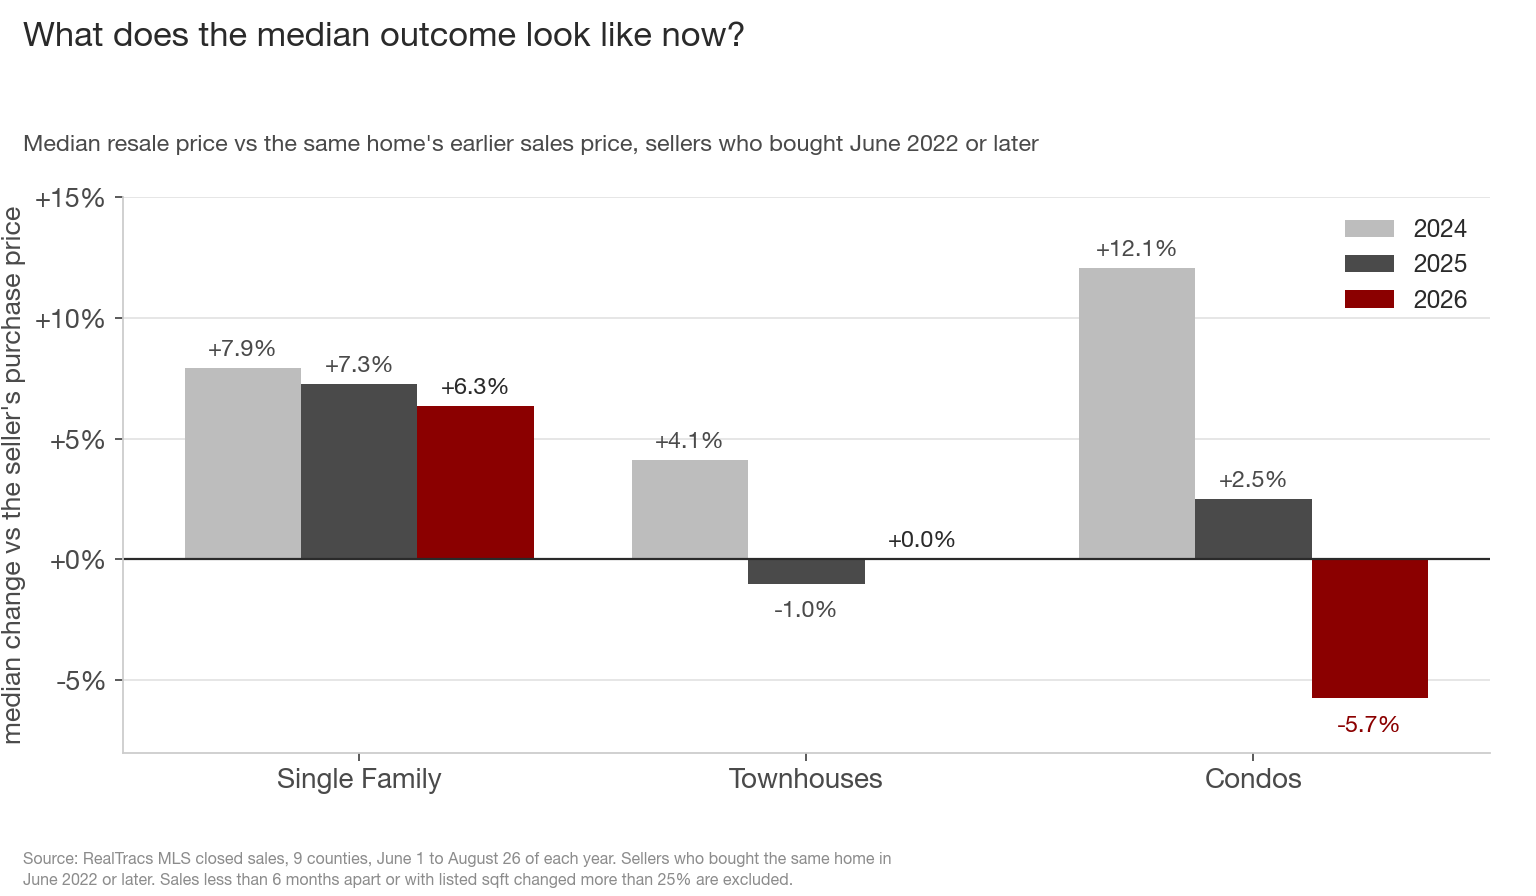
The median Single Family home bought in the last 4 years sold this summer for 6.3% above the seller's purchase price. The median townhouse sold for exactly what the seller paid, 0.0%, after -1.0% last summer. The median condo closed 5.7% below the purchase price, down from +2.5% last summer and +12.1% in 2024.
3. What happened to condos purchased after the 2022 interest rate spike?
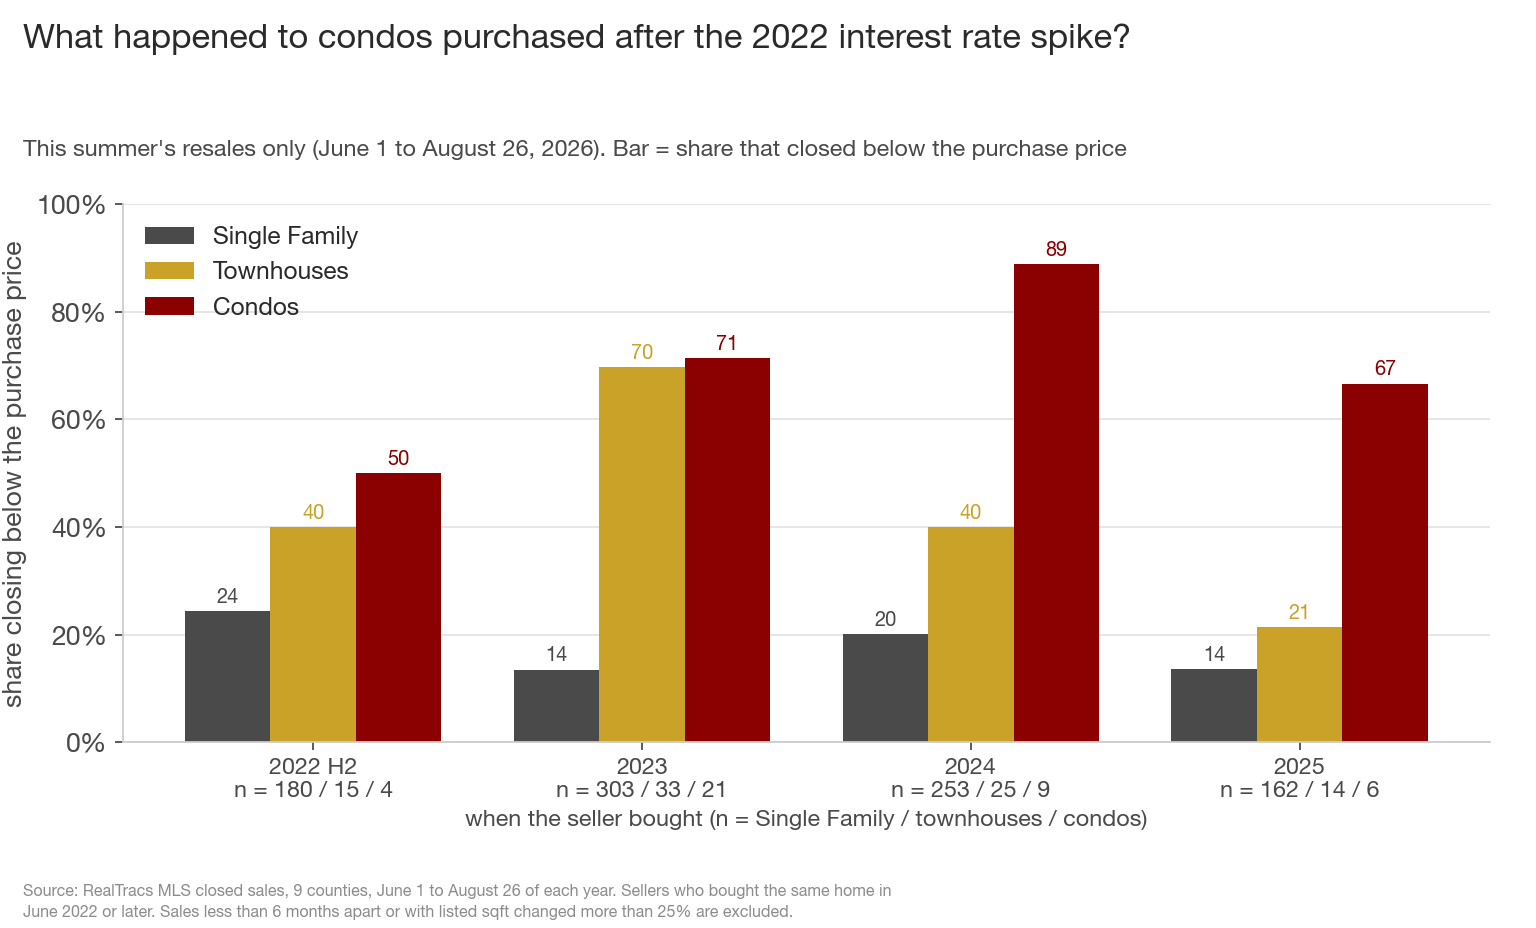
Condos bought in 2023 closed below the purchase price 15 times out of 21, and condos bought in 2024 did 8 times out of 9. Townhouses bought in 2023 are the worst townhouse year, 70% below. For Single Family the worst window is the second half of 2022, right after the price peak: 24% of those resales closed below, vs 17% for Single Family overall.
At 1616 West End Avenue, two units bought in December 2022 sold this summer for 16-17% more than the seller paid, while two units bought in 2023 both closed below the purchase price. A unit at 1510 Demonbreun Street bought in 2023 for $793,000 closed at $610,000, down 23%. A unit at 160 2nd Avenue South bought in 2024 for $1,900,000 closed at $1,650,000.
4. What is the price per square foot doing?
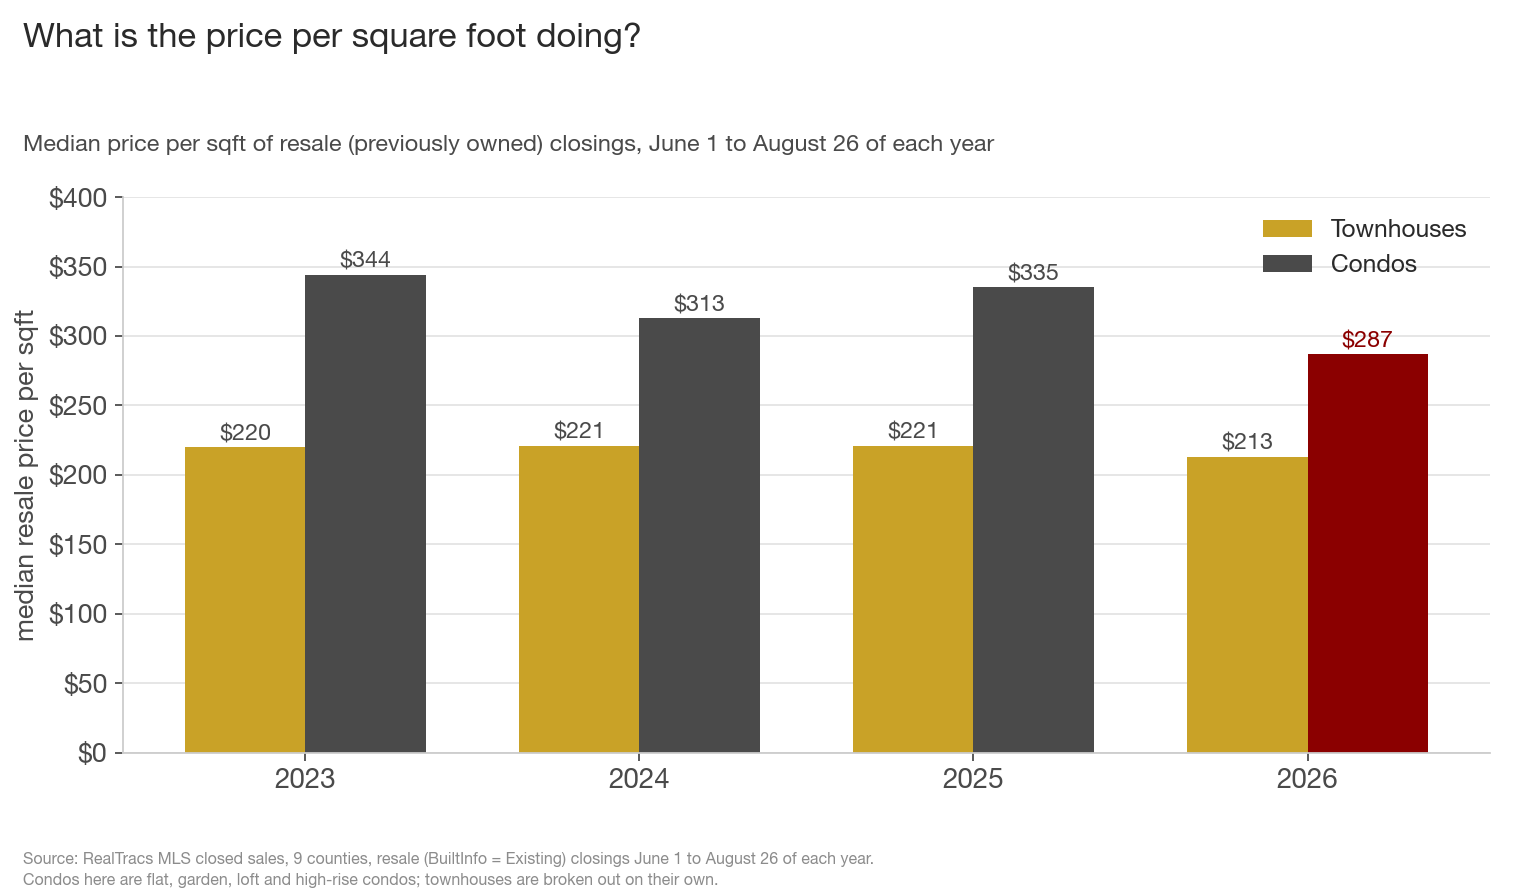
Condos closed this summer at a median of $287 per square foot, down from $335 last summer and $344 in the summer of 2023. Townhouses held at $220-$221 for 3 years and fell to $213 this year. Vs 2023, every condo type is lower: flat condos went from $333 to $294, garden condos from $264 to $239, and high-rise condos from $593 to $539. Vs last year, high-rise condos are up a little while the rest are down.
The median price per square foot across all condo closings over the last 31 days is $216 this week. Every weekly reading of 2023 and 2024 was higher, and 2025 went lower only in 4 weeks last December.
5. Are falling prices pulling buyers in?
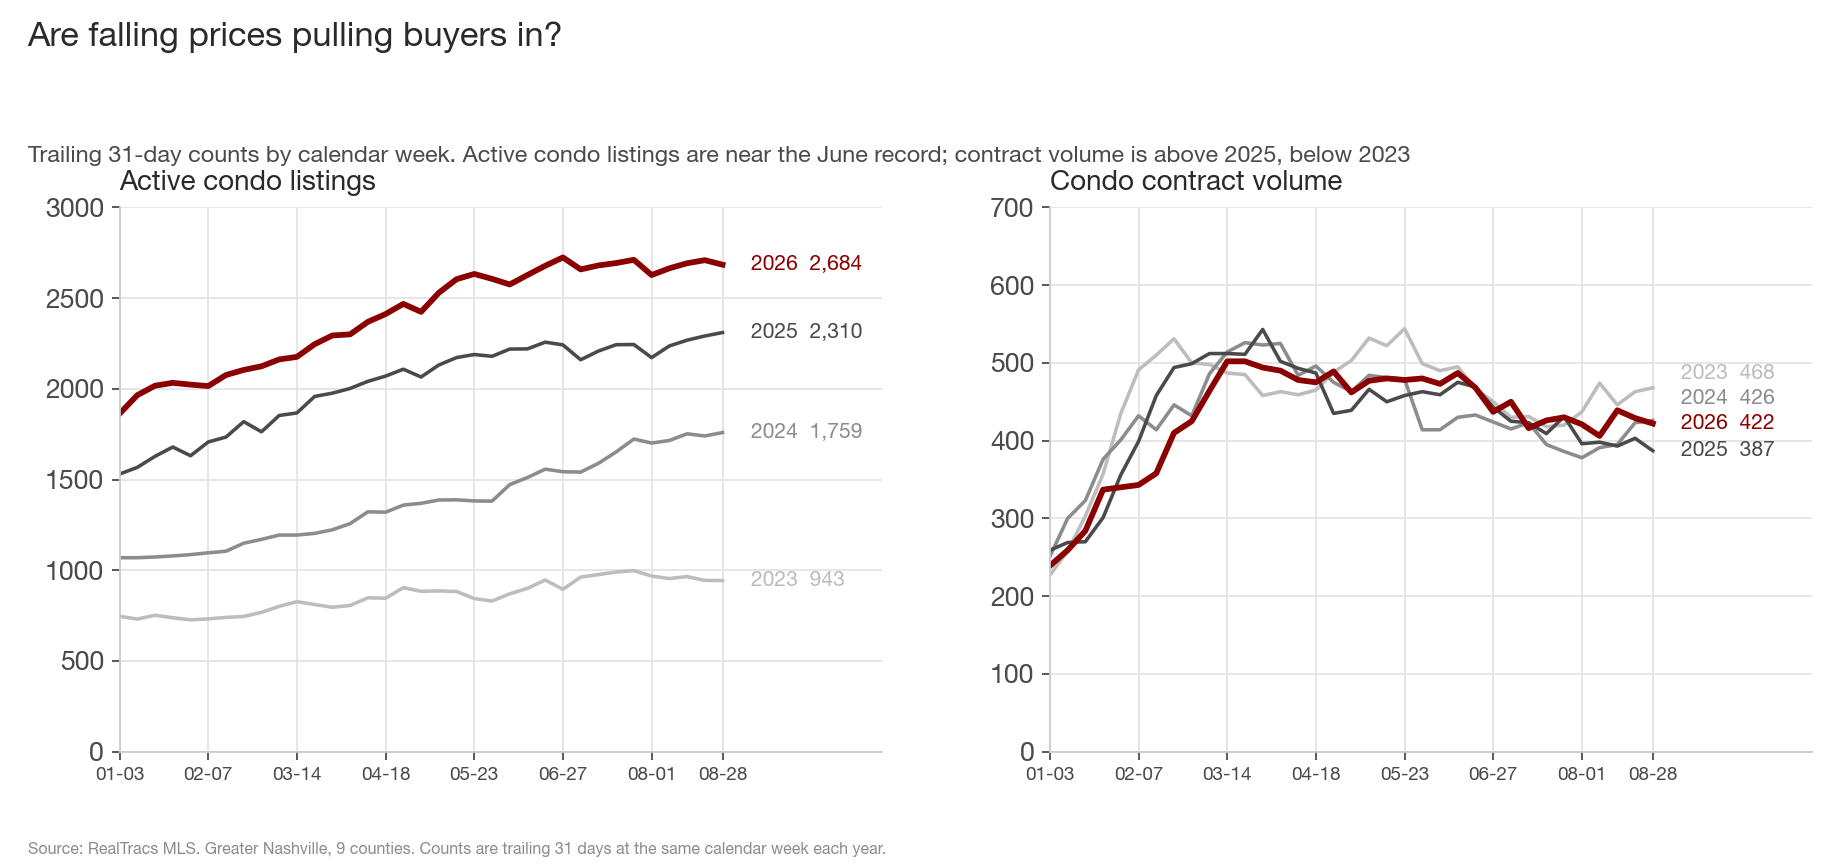
Supply. There are 2,684 active condo listings, up 16.2% vs last year and nearly 3 times the 943 of this week in 2023. The record in the 4 years of weekly data is 2,724, set the week of June 27. 40% of active condo listings have a price cut, and the median asking price is $370,000, lower than at this week of 2025 ($379,000), 2024 ($388,000) and 2023 ($400,000). Sellers are asking less every year, and the resales above show what buyers are paying.
Condo contract volume is 422 this week, up 9.0% vs last year, and it has run above 2025 every week since August 1, 6 of the last 8 weekly data points. It is still below the 468 of this week in 2023. Single Family contract volume is down 11.8% vs last year, so condos are the only one of the two property types with demand above 2025.
Adding it up
- 29 of 40 condos bought in June 2022 or later and sold again this summer closed below the seller's purchase price, up from 44% last summer and 10% in 2024.
- Townhouses bought in the same window are at 48% (54% last summer, so this is the second summer near half). Single Family homes are at 17%, and the median Single Family resale is still 6.3% over the purchase price.
- The worst purchase years are 2023 and 2024. Condos bought in 2024 closed below the purchase price 8 times out of 9.
- Condo resales are at $287 per square foot, below each of the last 3 years. Asking prices are also lower than in any of the last 3 years.
- Condo contract volume is up 9.0% vs last year while Single Family contract volume is down 11.8%.
For condo sellers who bought in the last 4 years, the market price today is often below their purchase price, and the 40% cut share says many sellers are still cutting toward it. For buyers, condos are the one part of this market where the price is clearly lower than it was one, two and three years ago. Whether that is enough will depend on the monthly cost: a $350,000 condo at today's rates still costs more per month than the same unit cost its 2021 buyer.
What to watch: if the lower prices are what is bringing buyers back, condo contract volume should hold above 2025 through the fall. I expect the share of condo resales closing below the seller's purchase price to stay above 50% through the fall closings. If contract volume keeps running above last year and the loss share does not climb further, that says the lower prices are finding enough buyers. If contract volume falls back below 2025, prices have further to fall.
The 40 condo resales
The 29 that closed below the seller's purchase price:
| Address | City | Bought | Sold 2026 | Change |
|---|---|---|---|---|
6666 Brookmont Ter #106 |
Nashville | $165,000 (2024-07) | $114,000 | -30.9% |
420 Elysian Fields Rd #E4 |
Nashville | $185,000 (2023-01) | $140,000 | -24.3% |
1125 10th Ave N #211 |
Nashville | $453,000 (2022-12) | $345,000 | -23.8% |
1510 Demonbreun St #904 |
Nashville | $793,000 (2023-07) | $610,000 | -23.1% |
1353 Highway 12 S #110 |
Ashland City | $249,900 (2023-12) | $199,000 | -20.4% |
2601 Hillsboro Pike #K5 |
Nashville | $214,000 (2024-05) | $174,000 | -18.7% |
635 7th Ave S #417 |
Nashville | $625,000 (2023-09) | $520,500 | -16.7% |
2355 Fairchild Cir #102 |
Nolensville | $339,000 (2023-06) | $287,400 | -15.2% |
420 Walton Ln #i41 |
Madison | $150,000 (2024-11) | $129,000 | -14.0% |
1144 Lock 4 Rd #J4 |
Gallatin | $410,000 (2024-03) | $354,900 | -13.4% |
160 2nd Ave S #2306 |
Nashville | $1,900,000 (2024-08) | $1,650,000 | -13.2% |
214 Old Hickory Blvd #177 |
Nashville | $275,000 (2023-04) | $240,000 | -12.7% |
3000 Poston Ave #102 |
Nashville | $975,000 (2025-08) | $875,000 | -10.3% |
110 Bellevue Rd #30 |
Nashville | $247,000 (2023-07) | $222,647 | -9.9% |
810 Bellevue Rd #214 |
Nashville | $245,000 (2023-02) | $223,000 | -9.0% |
2929 Selena Dr #48 |
Nashville | $215,000 (2023-05) | $198,000 | -7.9% |
1677 54th Ave N #119 |
Nashville | $350,000 (2022-12) | $323,000 | -7.7% |
200 Sanders Ferry Rd #2408 |
Hendersonville | $265,000 (2025-12) | $245,000 | -7.5% |
1616 West End Ave #2201 |
Nashville | $1,875,000 (2023-11) | $1,750,000 | -6.7% |
1638 54th Ave N #228 |
Nashville | $379,500 (2023-08) | $355,000 | -6.5% |
2258 Lebanon Pike #40 |
Nashville | $239,990 (2025-09) | $228,000 | -5.0% |
1677 54th Ave N #232 |
Nashville | $315,000 (2023-02) | $300,000 | -4.8% |
542 Southgate Ave #104 |
Nashville | $575,000 (2024-03) | $550,000 | -4.3% |
1325 5th Ave N #25 |
Nashville | $395,000 (2023-11) | $380,000 | -3.8% |
21 Vaughns Gap Rd #86 |
Nashville | $278,000 (2024-12) | $269,000 | -3.2% |
600 E Trinity Ln #108 |
Nashville | $425,000 (2023-07) | $417,000 | -1.9% |
110 31st Ave N #607 |
Nashville | $1,060,000 (2024-04) | $1,050,000 | -0.9% |
1616 West End Ave #1708 |
Nashville | $1,130,000 (2023-08) | $1,120,000 | -0.9% |
700 Vintage Green Ln #102 |
Franklin | $355,000 (2025-12) | $352,000 | -0.8% |
The 11 that closed at or above the seller's purchase price:
| Address | City | Bought | Sold 2026 | Change |
|---|---|---|---|---|
600 E Trinity Ln #118 |
Nashville | $265,000 (2023-08) | $266,900 | +0.7% |
991 Westhaven Blvd #20 |
Franklin | $680,000 (2025-01) | $695,000 | +2.2% |
6680 Charlotte Pike #D13 |
Nashville | $159,900 (2023-10) | $165,000 | +3.2% |
400 Warioto Way #1007 |
Ashland City | $942,000 (2023-07) | $995,000 | +5.6% |
3000 Vanderbilt Pl #423 |
Nashville | $337,000 (2023-10) | $375,000 | +11.3% |
900 20th Ave S #1314 |
Nashville | $1,350,000 (2024-09) | $1,525,000 | +13.0% |
1616 West End Ave #3004 |
Nashville | $1,007,000 (2022-12) | $1,170,000 | +16.2% |
1616 West End Ave #2906 |
Nashville | $1,009,000 (2022-12) | $1,179,000 | +16.8% |
4487 Post Pl #2 |
Nashville | $361,000 (2023-08) | $429,500 | +19.0% |
2901 Blair Blvd #B3 |
Nashville | $220,000 (2023-03) | $272,000 | +23.6% |
21 Vaughns Gap Rd #55 |
Nashville | $190,000 (2025-10) | $265,000 | +39.5% |
Data through the week of 08-28-2026 (closed sales through 08-27; the resale comparison window is June 1 to August 26), Greater Nashville (9 counties: Davidson, Williamson, Rutherford, Wilson, Sumner, Maury, Dickson, Cheatham, Robertson). Source: RealTracs MLS.