The $1M-$2M band closed 346 listings in the trailing 31 days, against 277 at the same week last year, up 24.9%, the largest gain of the six price bands. Every band under $1M closed fewer than a year ago. The same week, the band's listings under contract fell to 232 against 279, down 16.8%, the largest percentage decline of the six bands and the third straight reading below last year.
Closings show what buyers signed 60 to 90 days ago. The contracts show what closings will look like this fall, and the two sides of this band now point in opposite directions. Eight charts below, including a January-through-July count from the closed-sales export to put the trailing-31-day numbers in a full-year frame, and a look at the price distribution that explains why all this growth leaves the median price nearly flat.
1. Where are closings growing? Only above $1M, while $1M-$2M contracts fall the most
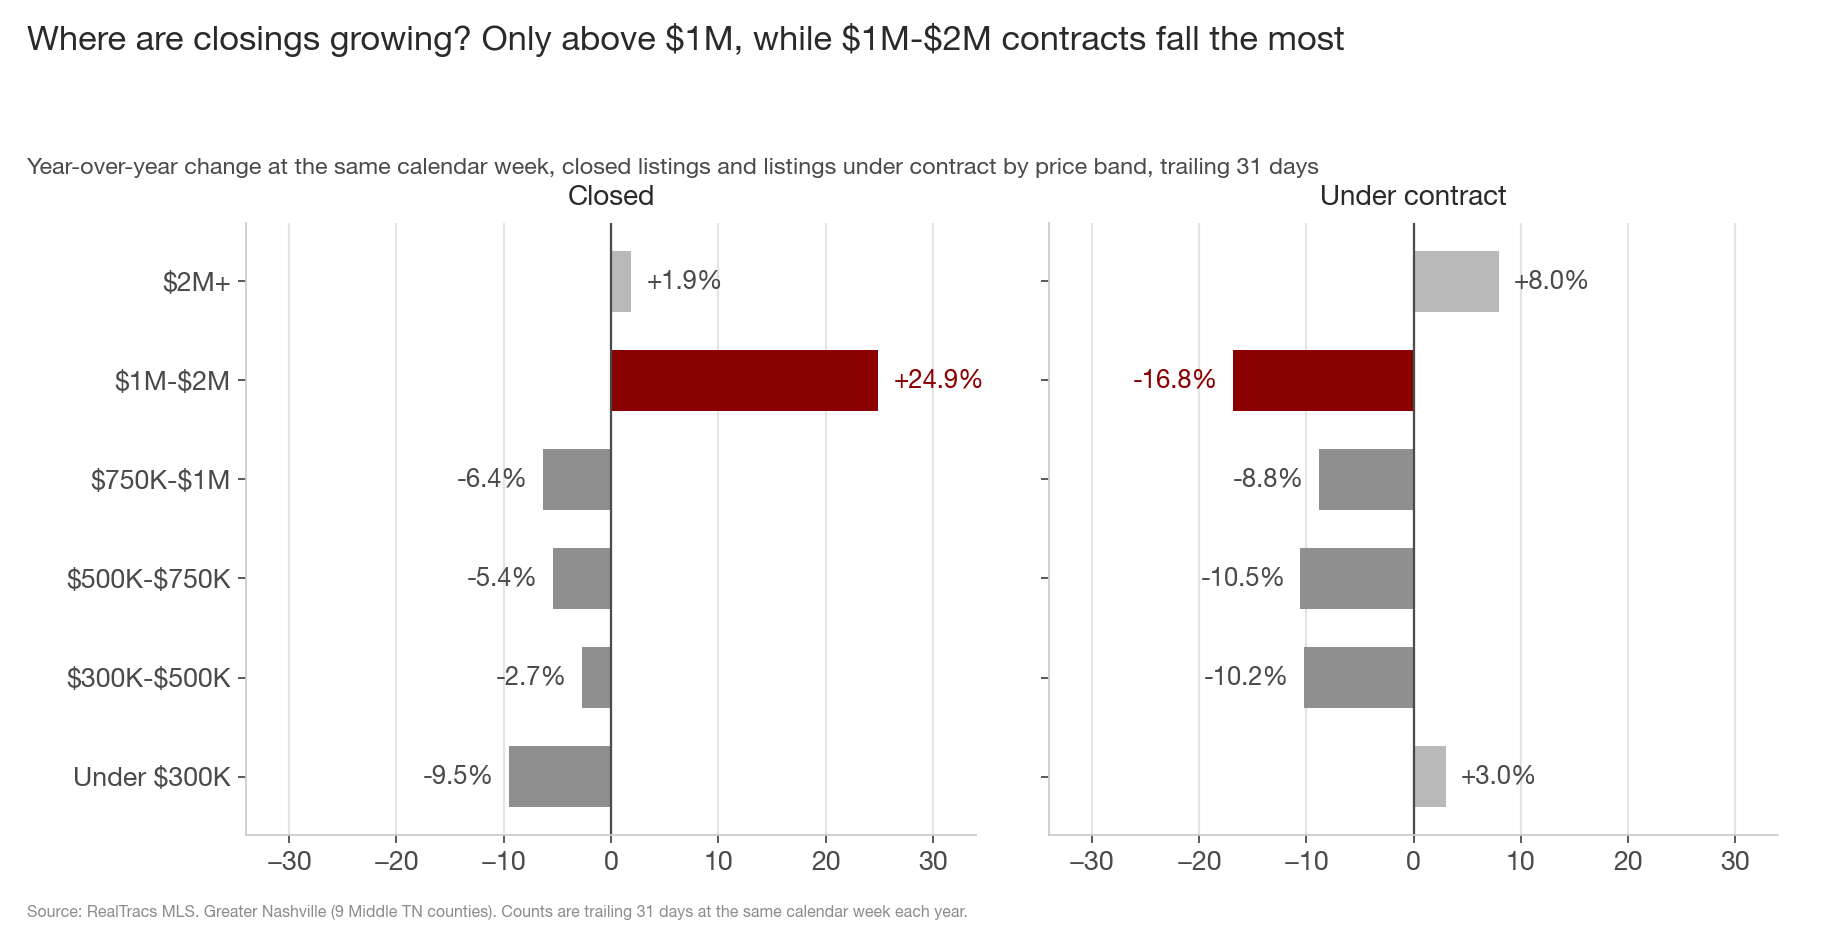
The closed gain holds against every year on file, +44.2% vs 2024 and +53.8% vs 2023, so it is not an artifact of a weak 2025. On the contract side, only the two end bands are positive (Under $300K +3.0%, $2M+ +8.0%); the four middle bands are all negative. The band is almost entirely houses: 334 of the 346 closings are single-family.
2. Is the whole year strong too? 1,937 closings through July, the most of the six covered years
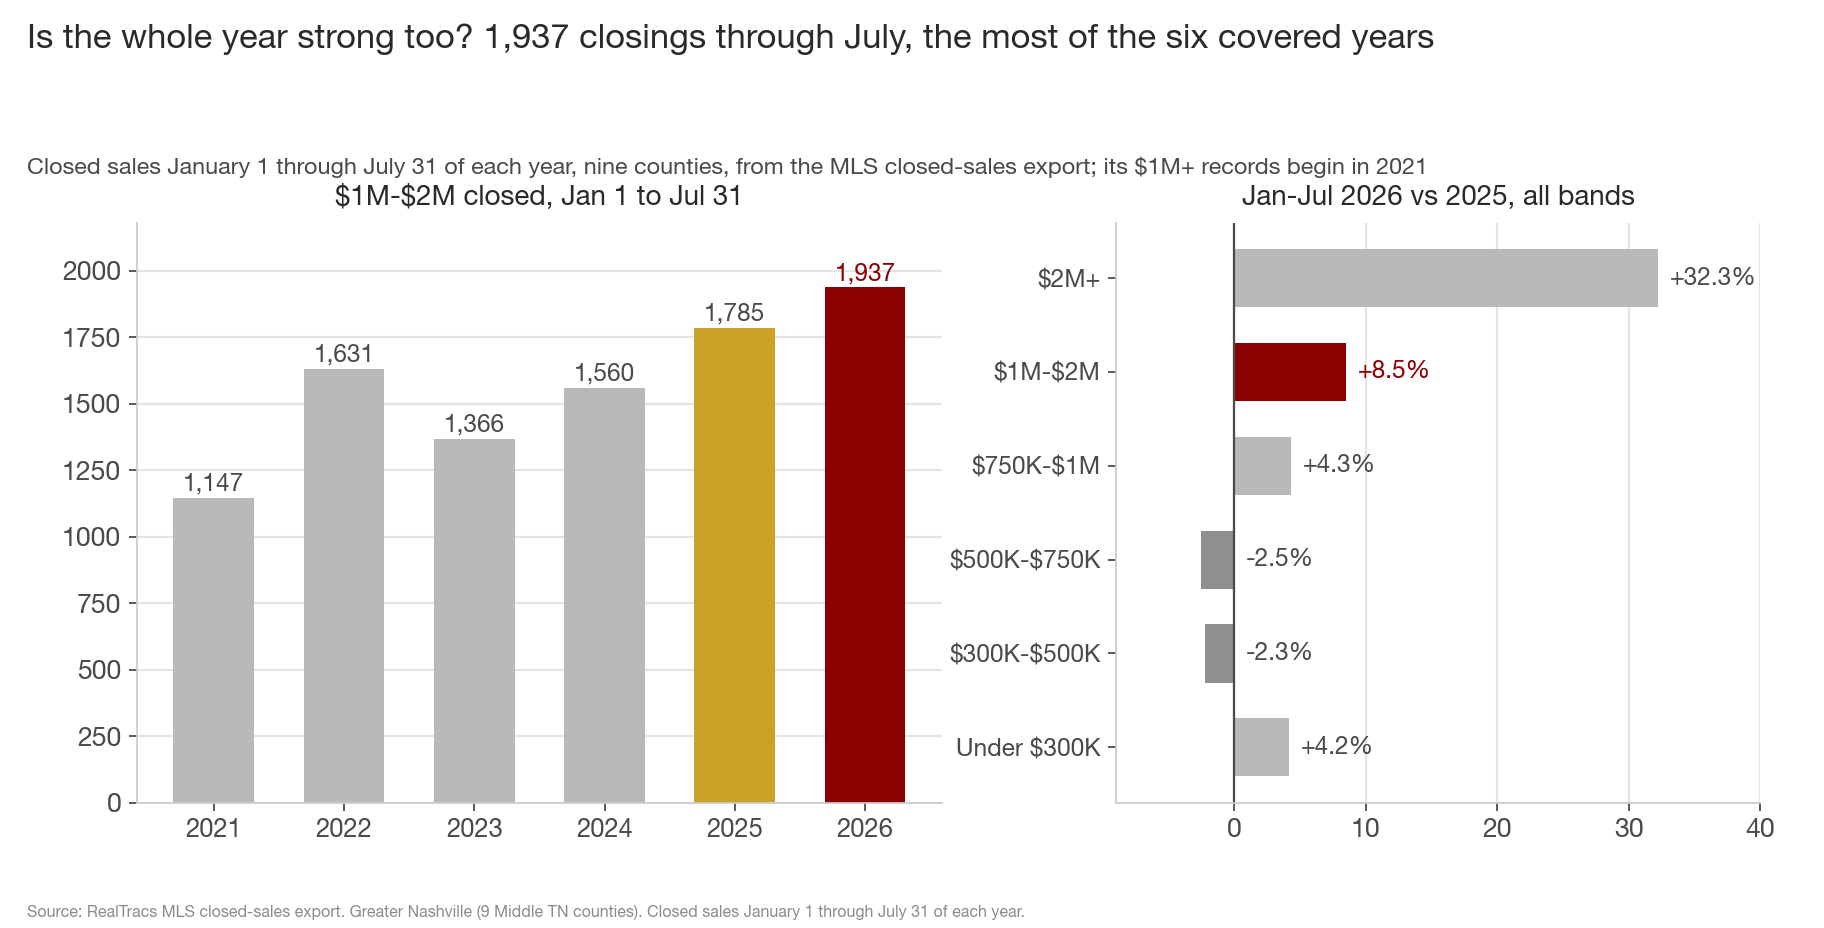
The trailing-31-day window can move on one strong month, so here is the year through July from the MLS closed-sales export (closings January 1 through July 31 of each year, all nine counties; the export's $1M+ records begin in 2021). The band closed 1,937 homes in the first seven months, the most of the six covered years and 8.5% above 2025, worth $2.66 billion in closed volume, also a high. It is not only this band: $2M+ is up 32.3% over the same months, the fastest growth of the six bands, while the two bands between $300K and $750K, which carry almost two thirds of all closings, are each down about 2.5%.
3. Why doesn't the growth above $1M move the median price? The middle is where the sales are
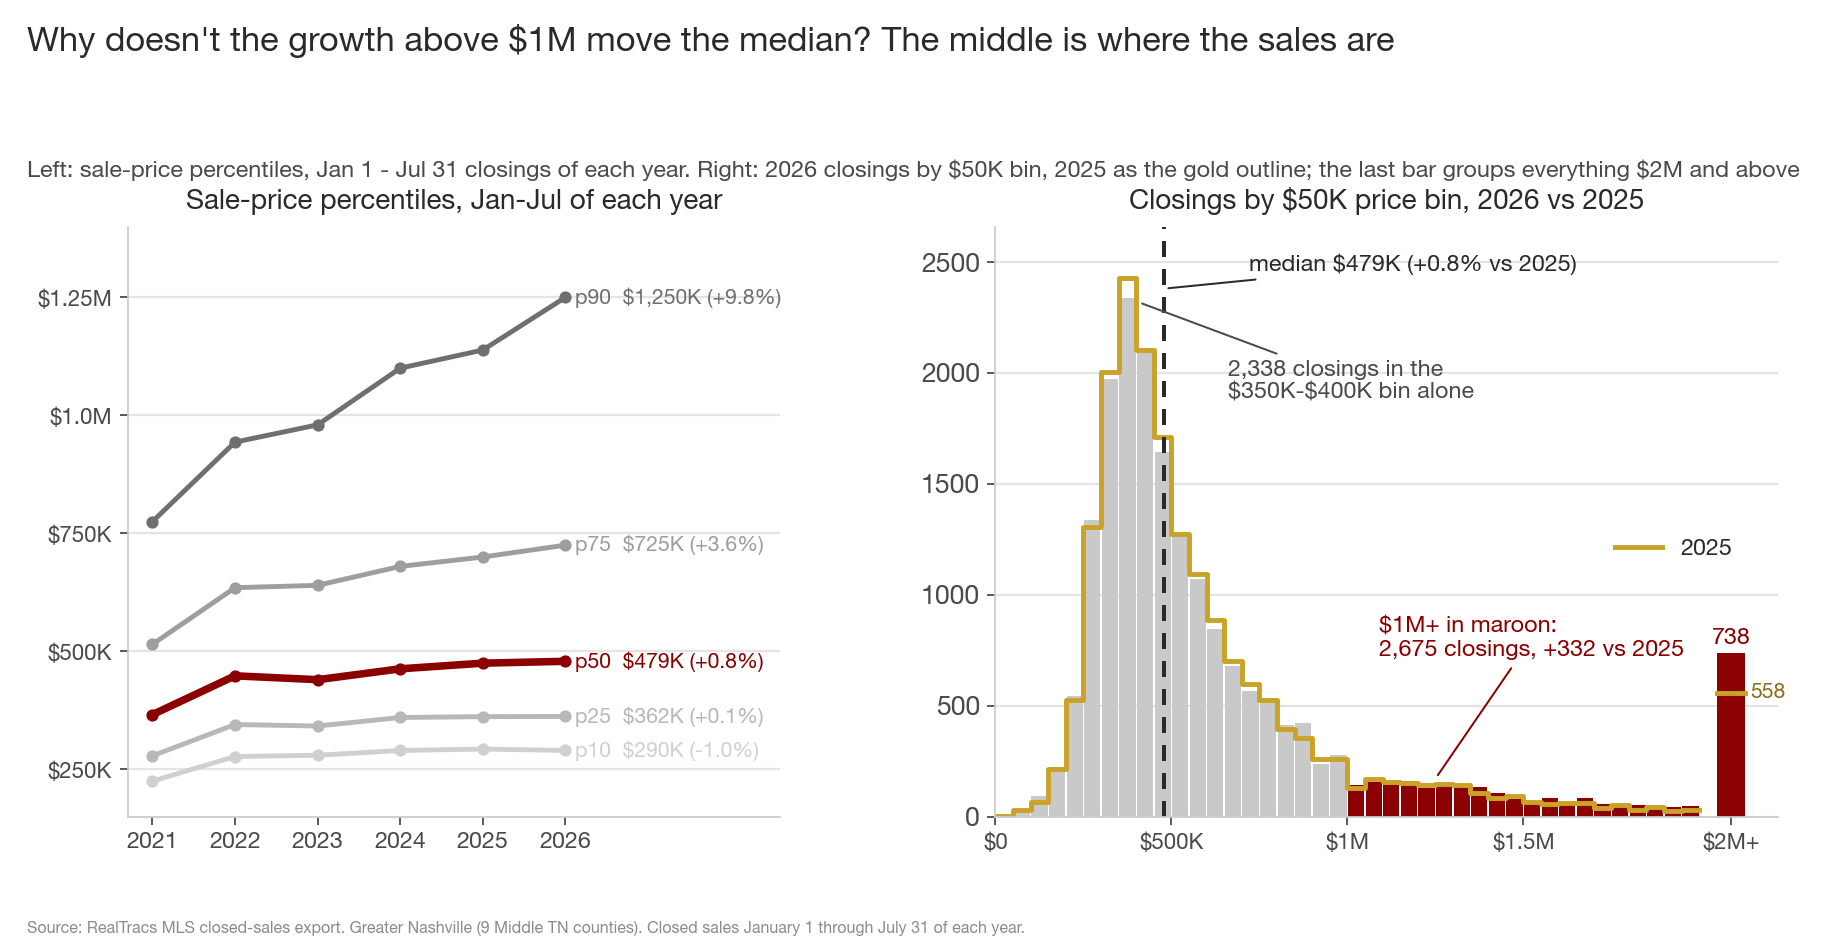
The median sale price for the same seven months is $478,900, up 0.8% from $475,000, even with all the growth above $1M. Both are true because the median only moves when closings cross the middle of the distribution, and the middle is where the volume is: 2,338 closings sit in the $350K-$400K bin alone, and near the median the market closes roughly 31 homes per $1,000 of price. Against that, the $1M+ segment's +332 closings are under 2% of the market, enough to move the median about $4,000, which is what happened.
The growth shows up in the statistics that can see the top of the distribution: the 90th percentile price is up 9.8% and the 95th up 12.9%, while the 25th is +0.1% and the 10th is -1.0%; the dollar-weighted average is up 6.9% ($644K to $689K). The bar at the far right of the histogram groups everything at $2M and above: 738 closings this year against 558 last year. Single-family alone has the same shape: median +1.6%, 95th percentile +13.9%. More expensive homes are trading in higher numbers, while the price of the typical home is close to flat.
4. Why were closings this strong? Contracts set a record in May
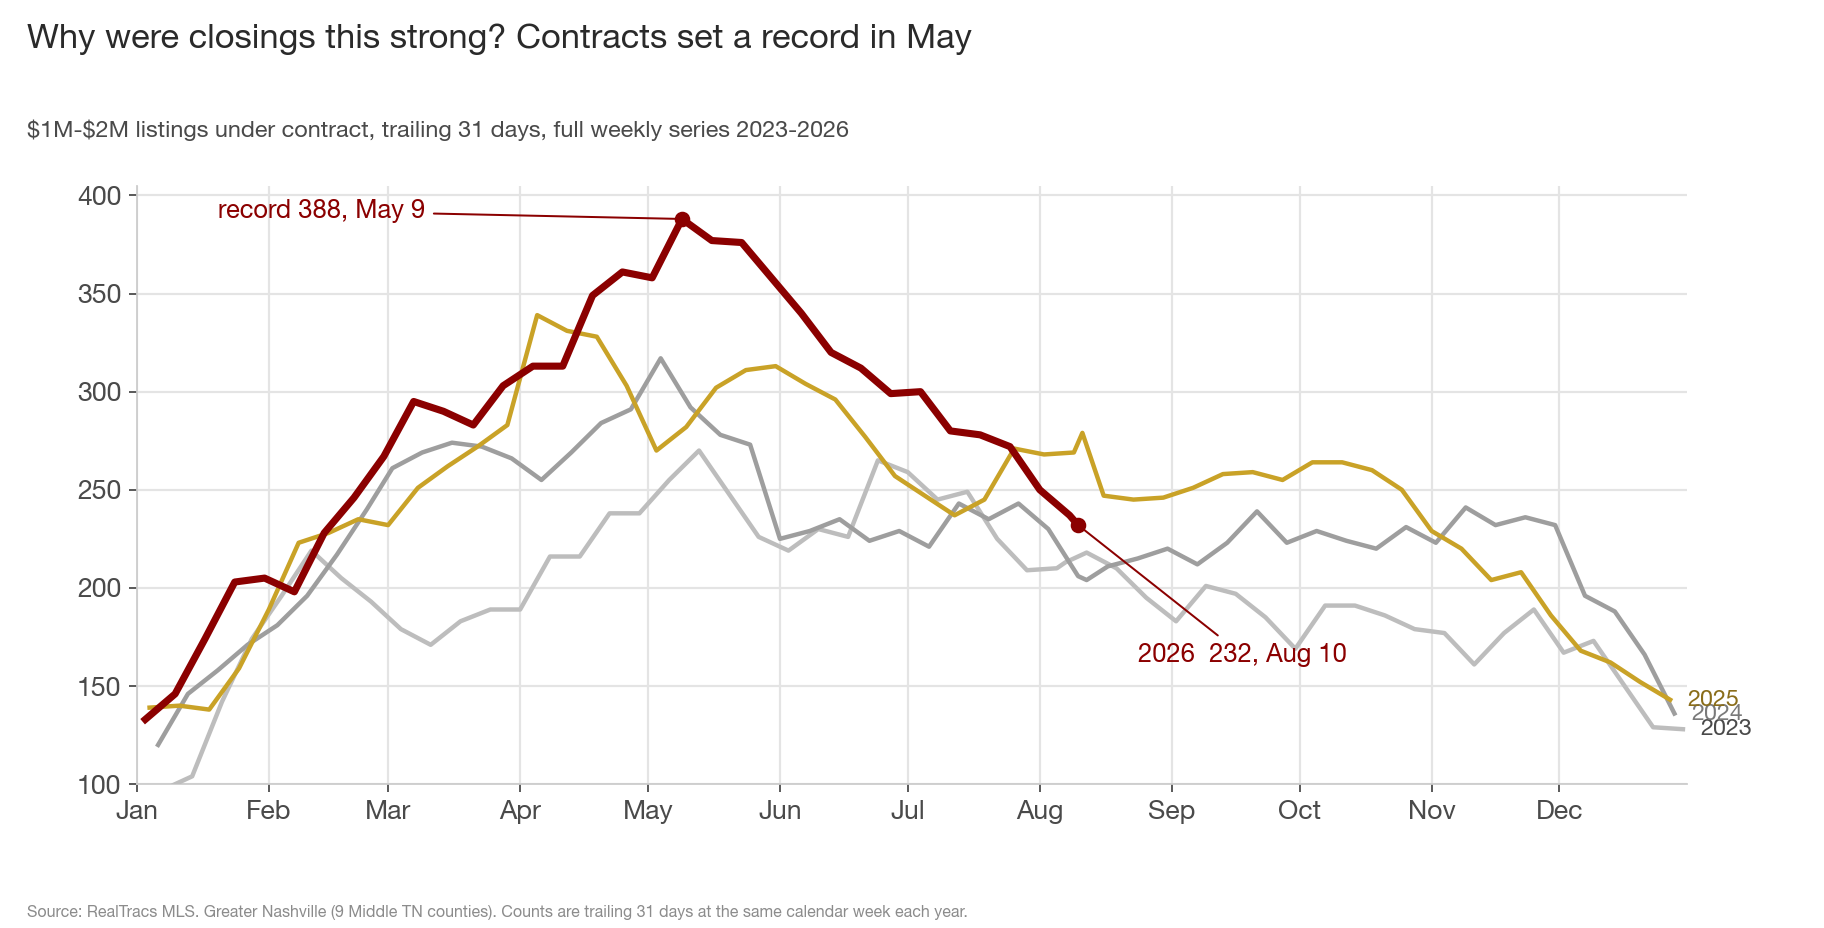
The week of May 9, 388 $1M-$2M listings were under contract, the highest weekly count for the band in the four years of data, 37.6% above the same week of 2025. Closings lag contracts by 60 to 90 days, and that surge is what closed in July and early August: the June 13 closed reading of 387 was also the band's highest of the four years.
5. How fast is demand cooling? Contracts fell 27.5% since mid-June, twice any prior year
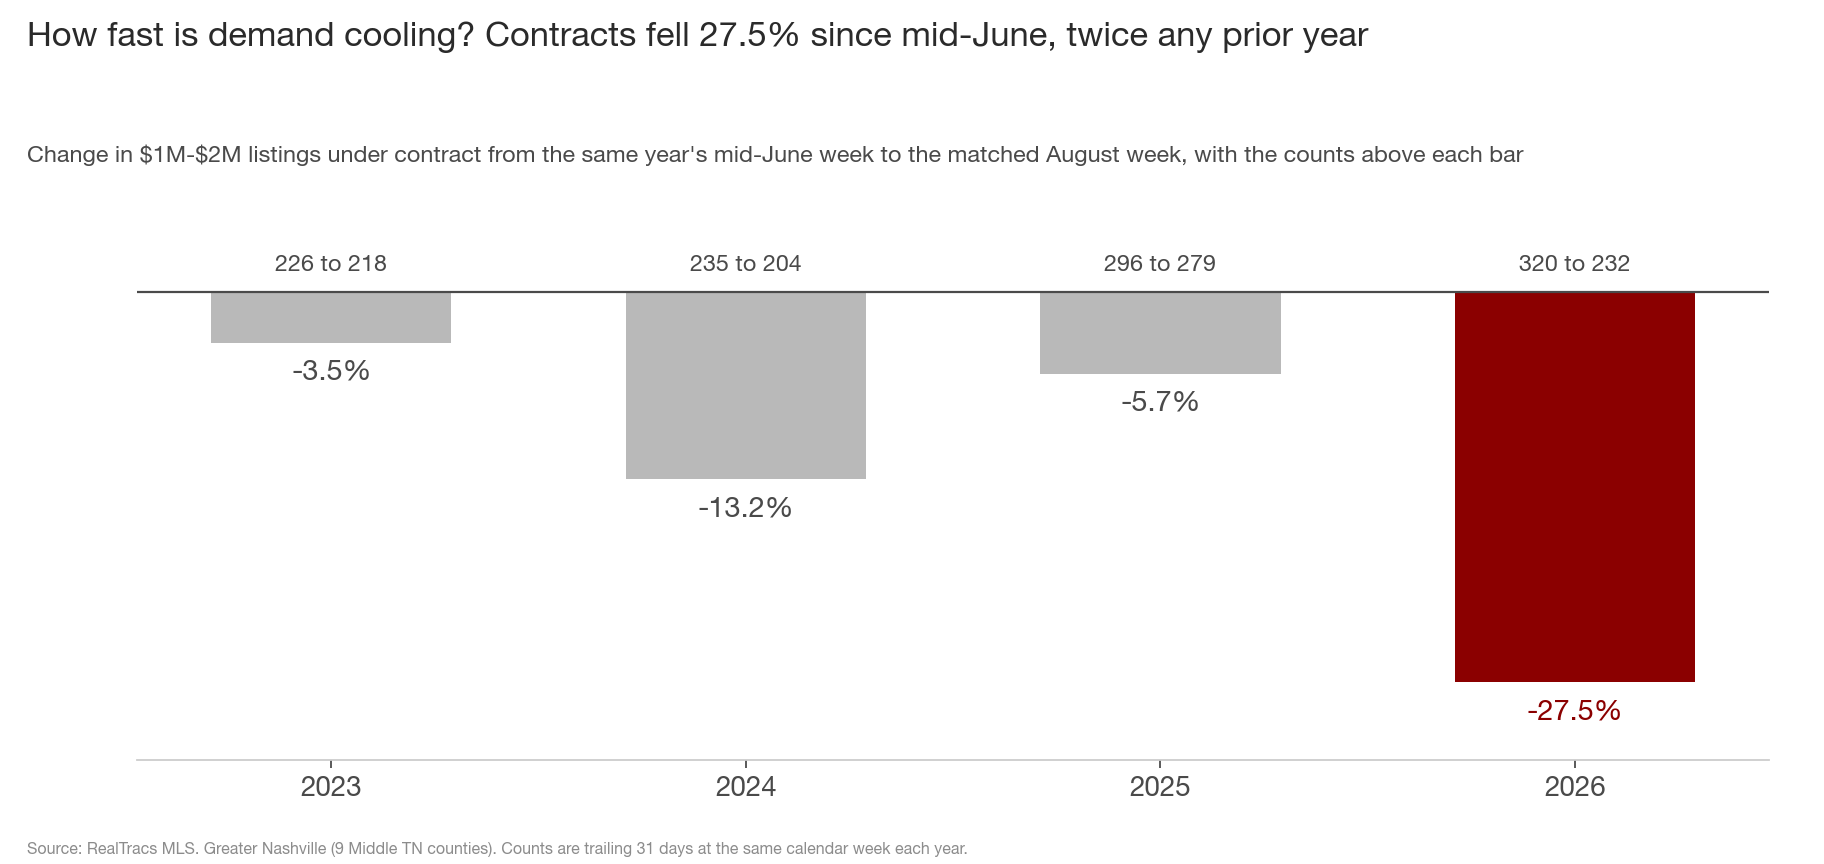
From mid-June to now, the band's contract count fell 27.5% (320 to 232). The same stretch of 2024 fell 13.2%, 2025 fell 5.7% and 2023 fell 3.5%. From the May 9 record the drop is 40.2%. The count crossed below 2025 on August 1, and the current gap of -47 is the largest of the year.
How long has it been negative? Three readings, covering nine days, and that on its own is a short stretch: the same comparison dipped negative in the first January reading, once in February, and for two readings in early April, and recovered each time. On the four-year chart in section 4, the 2026 line also still sits above where 2024 and 2023 were in mid-August. A week or two below last year is not by itself a signal. The reason to watch this stretch is the pace of the decline since mid-June and the supply sitting behind it.
The level is still high by prior-year standards: the count is 13.7% above 2024 and 6.4% above 2023 at the same week. And last August's 2025 count was itself 37% above 2024, so part of the year-over-year decline is a strong base. What changed is the speed of this year's own decline.
6. Are sellers reacting? Not yet: supply near its high, cut share the lowest in four years
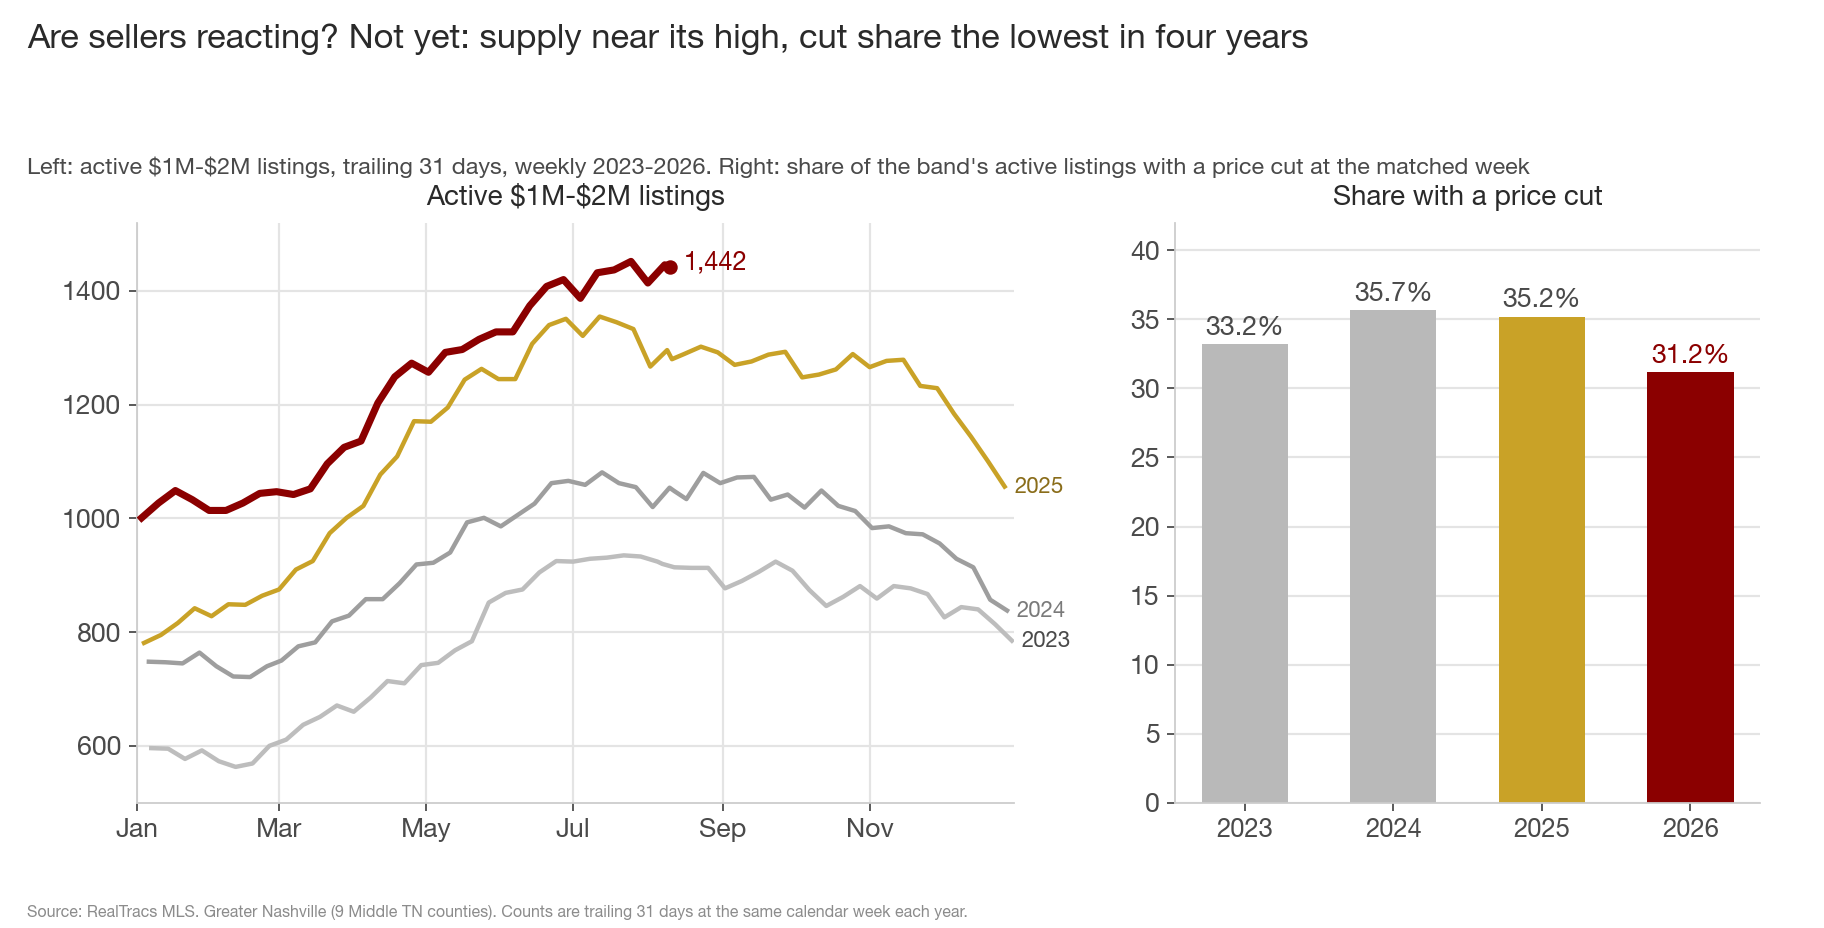
Active $1M-$2M listings stand at 1,442, within 10 of the band's four-year high of 1,452 set July 25, and +37.6% above the same week of 2024. Active listings per contract, a feels-like months of supply, reached 6.2, against 4.6 last year and 5.1 in 2024, and it was 5.1 five readings ago. The share of those listings with a price cut is 31.2%, the lowest at this week in the four years (35.2% a year ago) and the lowest of the six bands this week, 0.2 points below $2M+.
7. Where are the extra closings? Williamson and Davidson are the entire increase
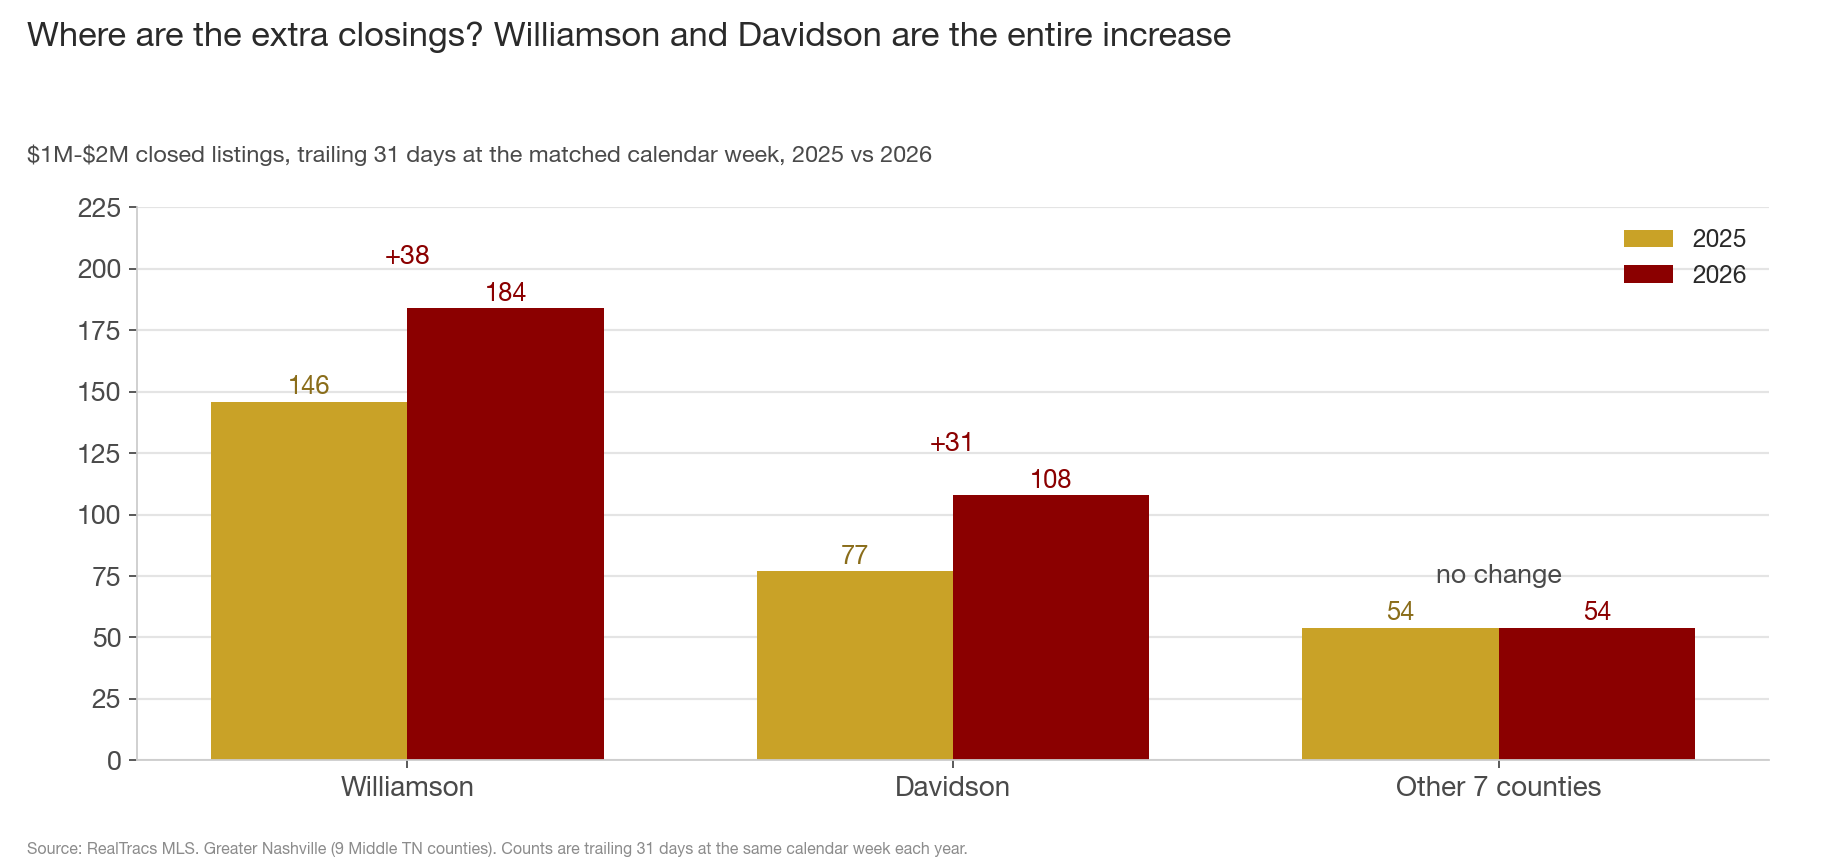
Williamson closed 184 (+38) and Davidson 108 (+31); together they are the metro band's entire 69-closing increase, while the other seven counties closed 54 in both years. The contract decline is also concentrated: Williamson is at 119 against 154 last year, 35 of the metro's 47-contract drop. By seller type, new-build contracts in the band fell from 73 to 47, down about a third, while resale fell 10.2% (206 to 185).
8. Is the slowdown spreading above $2M? No, both sides are four-year highs
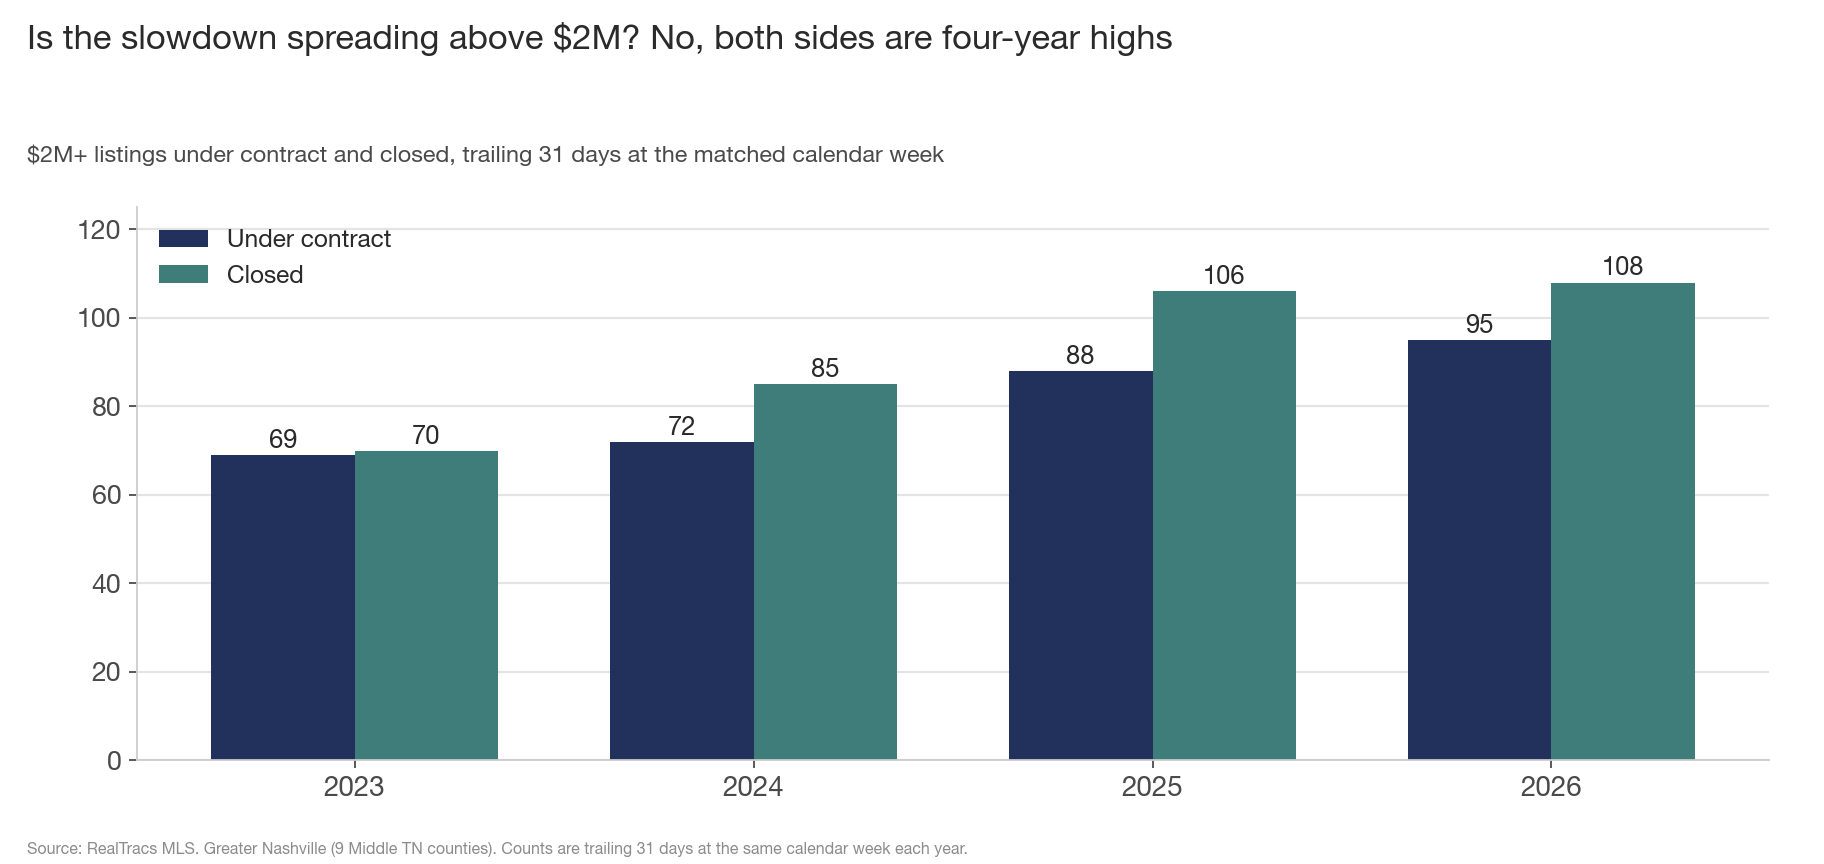
$2M+ contracts stand at 95, up 8.0% from last year, +31.9% vs 2024 and +37.7% vs 2023, the highest for this week in the data. Closings there are 108, also a four-year high for the week. The cooling stops at $2M.
What this adds up to
- $1M-$2M closings are up 24.9%, the largest gain of the six bands ($2M+ is next at +1.9%), and it holds against every prior year.
- The year through July says the same: 1,937 closings, the most of the export's six covered years, with $2M+ growing even faster at +32.3%.
- The growth does not move the median price ($478,900, +0.8%): the extra $1M+ closings are under 2% of a market whose volume peaks near $375K. The 90th percentile price is up 9.8%; the typical home is flat.
- Those closings came from a record spring: 388 contracts the week of May 9.
- The contract count has since fallen 27.5%, twice the steepest mid-June-to-August decline of the prior three years, and is below 2025 for three straight readings. Three readings is a short stretch, and earlier dips this year recovered; the decline speed is what sets this one apart.
- Supply has not adjusted: 1,442 actives near the band's high, 6.2 months of feels-like supply, and the lowest cut share of the six bands at 31.2%.
- $2M+ is not slowing; both contracts and closings there are four-year highs for the week.
A buyer reading the band's closing numbers is looking at May's market. A seller listing between $1M and $2M today is competing with near-record inventory for a contract count that has fallen every week but one since early May. Williamson sellers, who hold the largest share of the band, face the sharpest contract decline.
What to watch: closings follow contracts by 60 to 90 days, so the August contract crossing points to $1M-$2M closings at or below 2025 by mid-October. On the seller side, if actives hold near 1,450 while contracts stay in the low 230s, the band's cut share should climb from 31.2% toward last year's 35% by fall. If instead contracts rebound the way 2025's did in late August, this was a seasonal pause in a still-strong band.
Data through week ending 08-10-2026, Greater Nashville (9 counties: Davidson, Williamson, Rutherford, Wilson, Sumner, Maury, Dickson, Cheatham, Robertson). Source: RealTracs MLS. The figures in sections 2 and 3 are from the RealTracs MLS closed-sales export, closings January 1 through July 31 of each year; the export's $1M+ records begin in 2021.