The latest migration data from Redfin makes Nashville's place in the national housing market unusually easy to see. Redfin's Q1 2026 numbers show the typical house hunter looking to move here comes from a metro where the typical home is worth about $811,000 (Los Angeles, the single biggest source, sits at $1.03 million), while the typical Nashvillian looking to leave is headed for a Tennessee metro where homes run about $340,000 (Knoxville, the biggest single outflow, at $369,000). Nashville itself, at a Zillow-typical $463,000, has become the middle rung of a price ladder. It is cheap enough to pull Californians in and expensive enough to push Tennesseans out.
That sorting is the whole story. This post lays out who is moving in and who is moving out, the price gap that pulls the traffic in both directions, the income those movers bring, where Tennessee sits in the national picture (the No. 4 destination state), and how the same affordability pressure is now showing up inside our own market's price tiers.
A note on the data before we start: the migration figures are from Redfin, which counts a user as a potential migrant when they search homes in a metro other than their own. It measures search intent rather than completed moves, and it covers the Nashville metro area, which is broader than the nine counties our weekly market data tracks. It is the best read available on which direction housing demand is leaning, and the direction here is striking.
1. Who is moving in, and who is moving out?
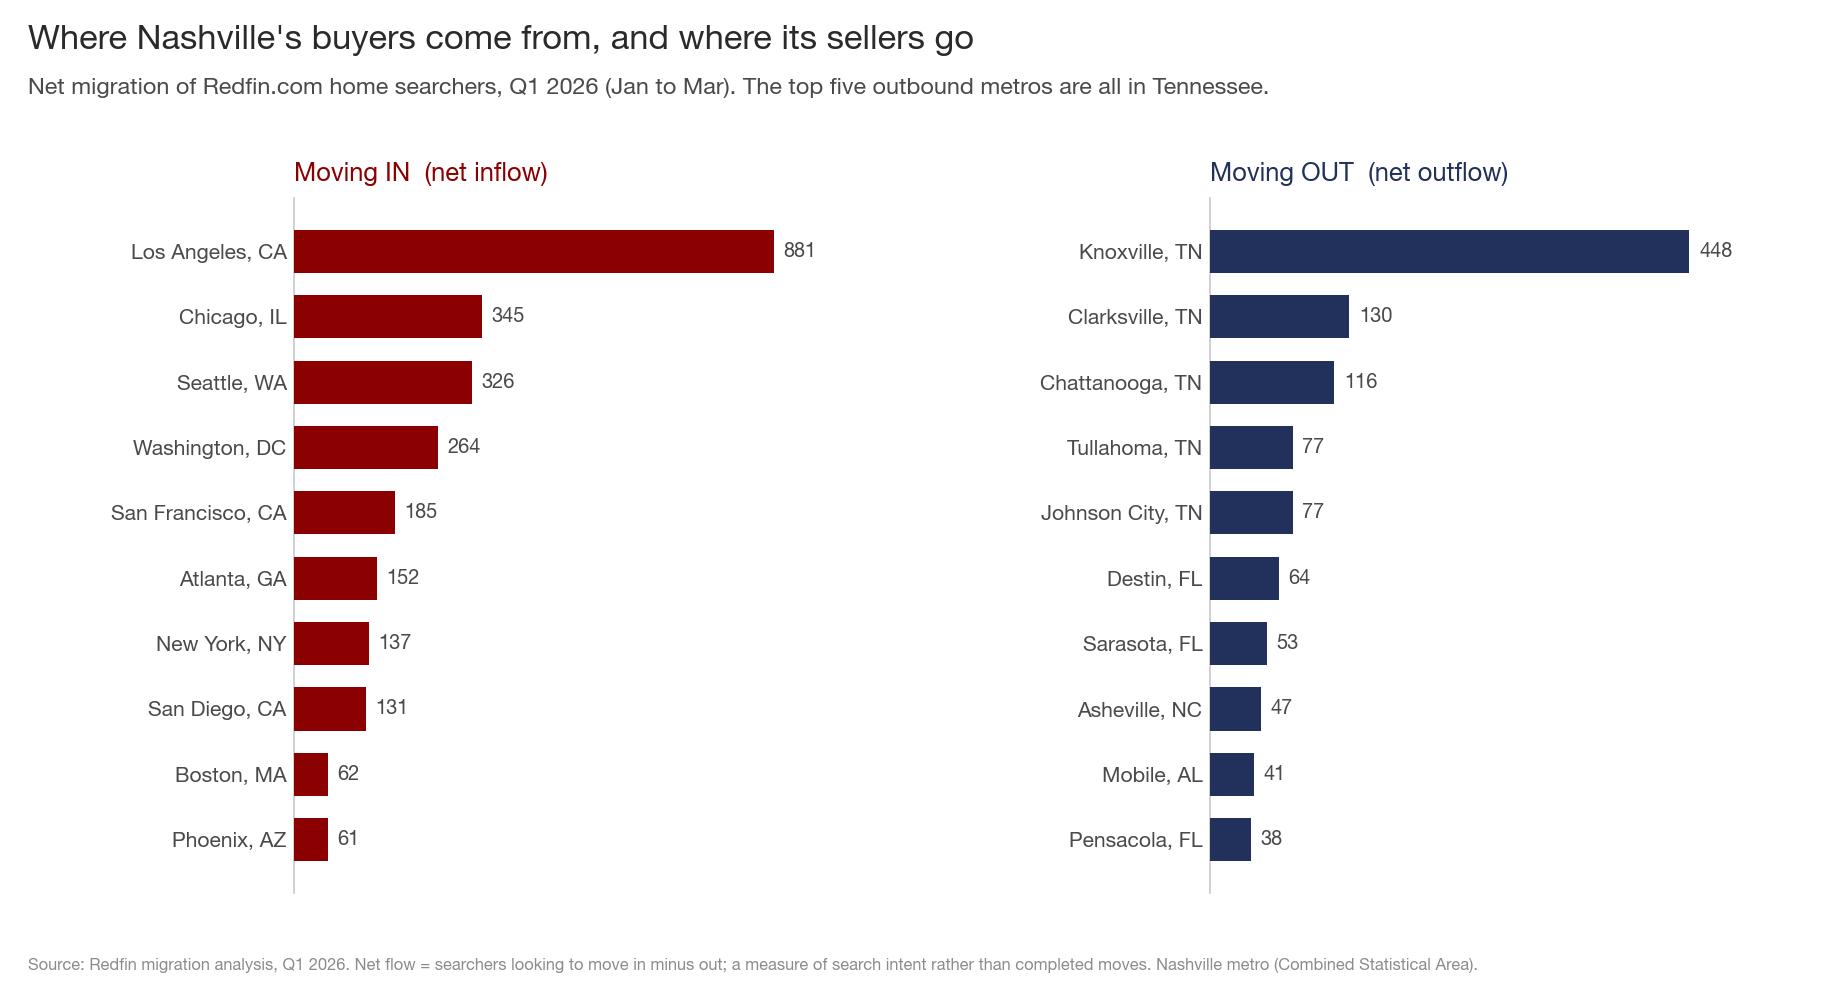
The two columns barely overlap geographically. People moving into Nashville come from across the country, and almost entirely from big, expensive metros: Los Angeles leads at a net +881 searchers, followed by Chicago, Seattle, Washington, San Francisco, Atlanta, New York, San Diego, Boston, and Phoenix. This is the familiar story of the last decade. Nashville is a release valve for the priciest coastal job centers, the same metros (New York, Seattle, Los Angeles, the Bay Area) that top Redfin's national list of places people are leaving.
People moving out of Nashville tell a different and less-told story. The top five outbound destinations are all in Tennessee: Knoxville (+448), Clarksville (+130), Chattanooga (+116), Tullahoma (+77), and Johnson City (+77). The single largest outflow from Nashville, Knoxville at +448, is bigger than every inbound source except Los Angeles. People arrive from two time zones away and leave for two hours down I-40.
The Florida names lower in the outbound column (Destin, Sarasota, Pensacola) are a separate, older story: the beach-and-retirement pull that has drawn Tennesseans south for decades. The new pattern worth watching is the Tennessee one, and to understand it you have to look at price.
2. Nashville is the middle rung of the price ladder
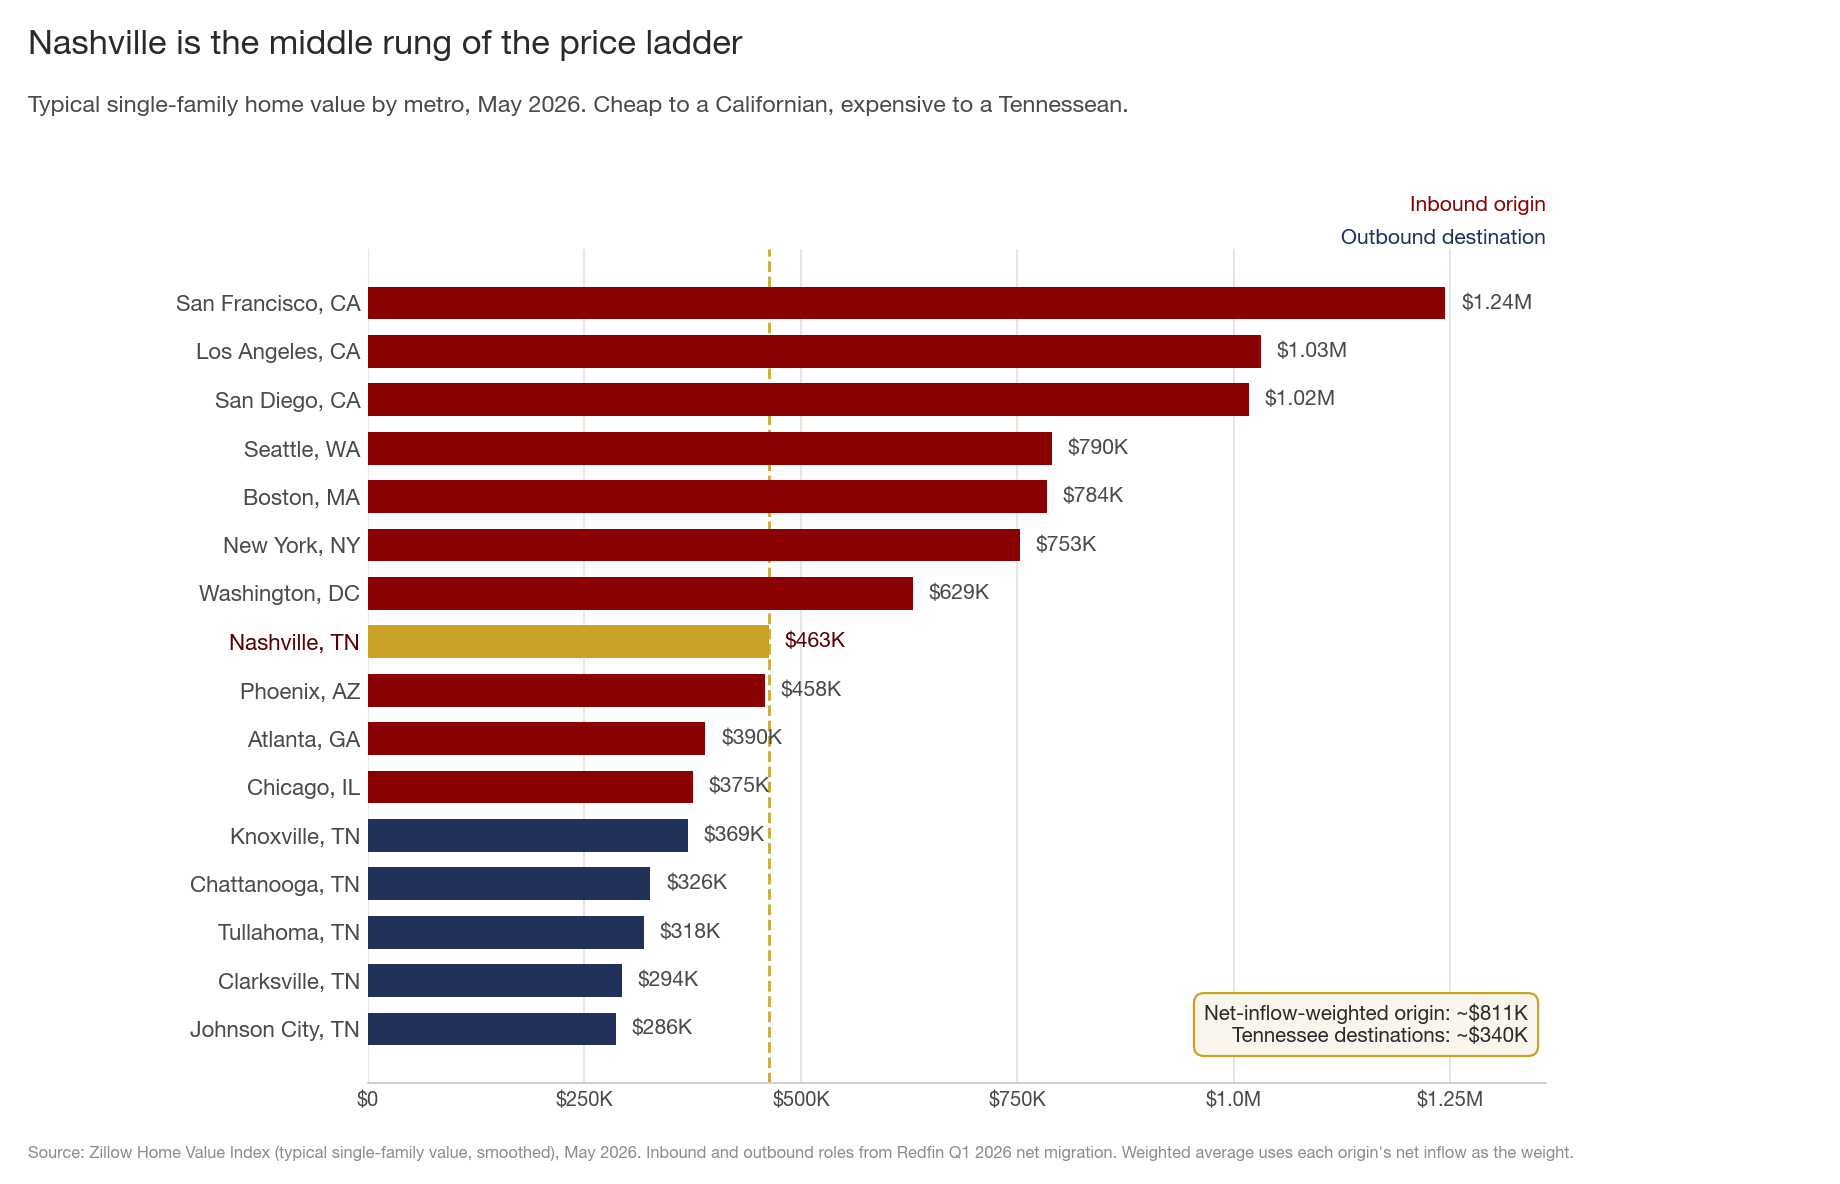
Sort every metro in the migration data by the cost of a typical home and Nashville lands almost exactly in the middle. Weighted by how many searchers each origin actually sends, the typical metro feeding buyers into Nashville carries a home value near $811,000, about 75% more than Nashville's $463,000. To someone selling a normal house in Los Angeles or San Diego (a million dollars and change) or Seattle ($790,000), Nashville reads as a discount with a tax cut attached, since Tennessee has no state income tax.
Run the ladder the other way and the outbound flow makes just as much sense. The Tennessee metros pulling people out of Nashville average about $340,000, roughly 27% below Nashville's typical value. For a household priced out of a move up here, Knoxville at $369,000 or Clarksville at $294,000 is the same discount, one rung down, that Nashville offers a Californian.
Two honest caveats. First, a few inbound metros are actually cheaper than Nashville. Chicago ($375,000) and Atlanta ($390,000) both sit below it, and Phoenix ($458,000) is essentially even. They are the exceptions, and the dominant flow, led by Los Angeles, comes from far costlier places. Second, two different Nashville numbers appear in this post because they measure different things. The $463,000 on the ladder is Zillow's typical single-family value, the figure I use to compare metros apples to apples. Our own RealTracs data puts the single-family median sale price across the nine-county region at $540,000 this week. Both say the same thing: by regional standards, Nashville is now an expensive place to buy.
3. Chicago sends wealth; Atlanta sends middle incomes
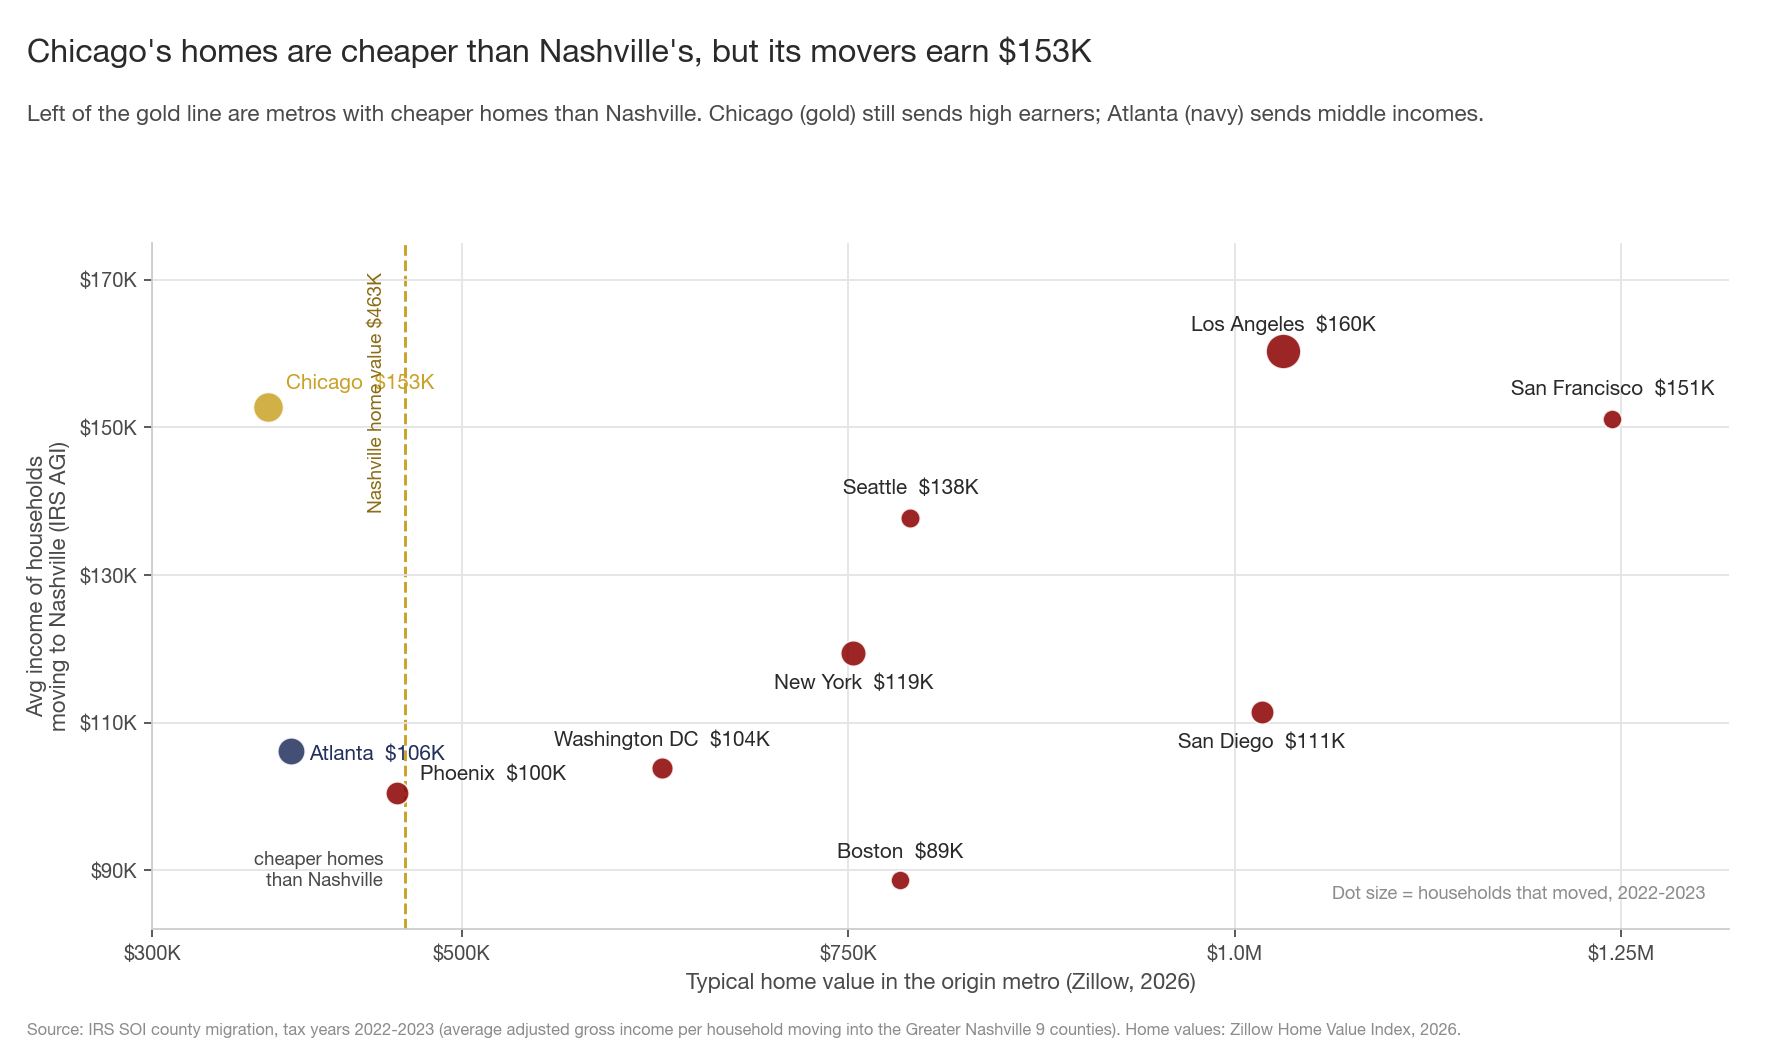
The price ladder leaves a question open. Chicago and Atlanta, two of the biggest inbound metros, have cheaper homes than Nashville, so are they sending wealth or just people? Tax records answer it, because they show the income of the households that actually moved.
The average household that moved from Chicago to Greater Nashville in 2022-2023 reported $153,000 in income, second only to Los Angeles ($160,000) among the ten big metros feeding the city. These are affluent Chicagoans leaving a high-tax state for one with no income tax. The cheaper Chicago home prices are misleading: the houses cost less than Nashville's, but the people buying them are among the highest earners moving here. Atlanta is the opposite. Its movers brought $106,000, middle of the pack, in line with Atlanta's more affordable housing.
Across all ten metros, the highest-income movers come from Los Angeles, Chicago, San Francisco and Seattle, at $138,000 to $160,000. All four clear the roughly $117,000 that the average household already living in the nine counties reports, though that local figure is a mean (lifted by ultra-wealthy Williamson County) rather than a median. Two limits keep this honest: the IRS numbers are for tax years 2022-2023, about three years behind the home-search data in the rest of this post, and a handful of very high earners can pull a mean up. Even so, the direction matches 2026, when Los Angeles and Chicago are again the top two origins. Whether the newest movers are quite this affluent will not show up until the IRS releases 2025-2026 data, around 2028.
4. Tennessee is the No. 4 destination state
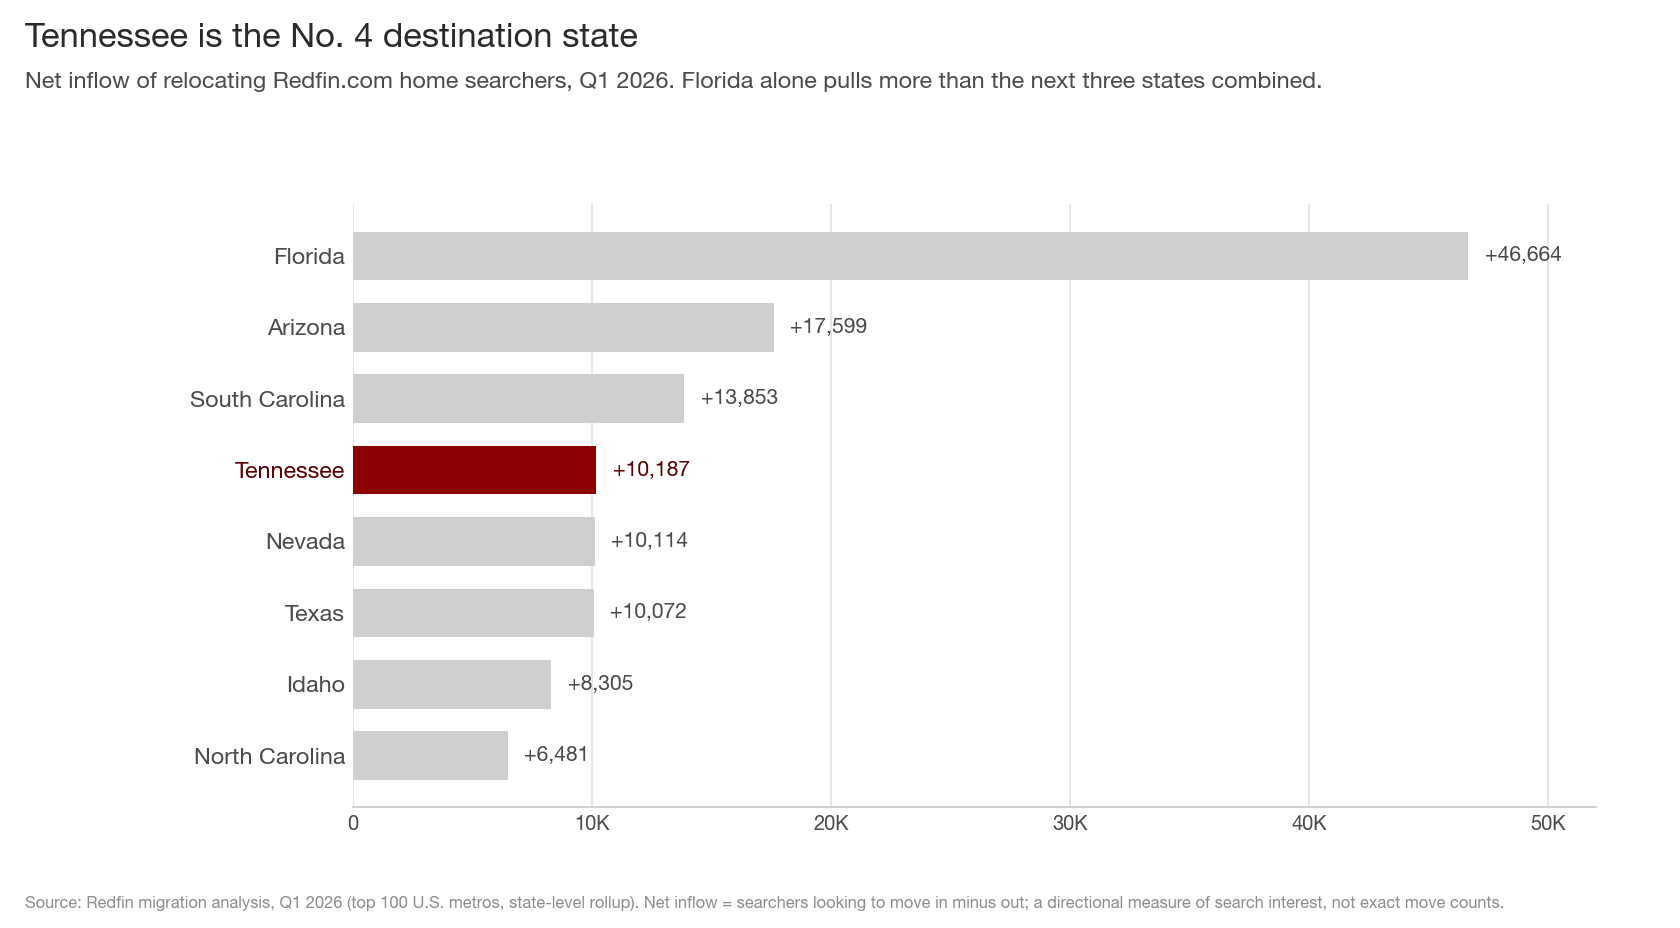
Zoom out to the state level and Tennessee is the No. 4 destination in the country for relocating house hunters, at a net +10,187, behind only Florida, Arizona, and South Carolina. Florida alone (+46,664) pulls more searchers than the next three states combined, so this is a Sun Belt pattern and Tennessee is near the front of it.
A word on how to read these numbers. Redfin's migration figures come from search activity, so they are best treated as directional: they show the rank and the trend of demand more reliably than any exact head count. On that basis, interest in Tennessee is strong and broad, and nationally the share of house hunters looking to relocate reached a record 19.1% this quarter, up from 18.9% a year earlier and the highest since Redfin's records begin in 2021. Relocation interest is running high.
Our own market points the same way. The tier where out-of-state, equity-rich buyers concentrate, $1M to $2M, is up +21.3% year over year, the fastest-growing band in the metro, and overall demand is running about +2.7% ahead of last year. None of that reads like weakening demand. If the high end keeps growing, it points to transplant demand that is still building. (The full national report is here.)
5. Fewer homes sell under $300K now, and more sell over $1M
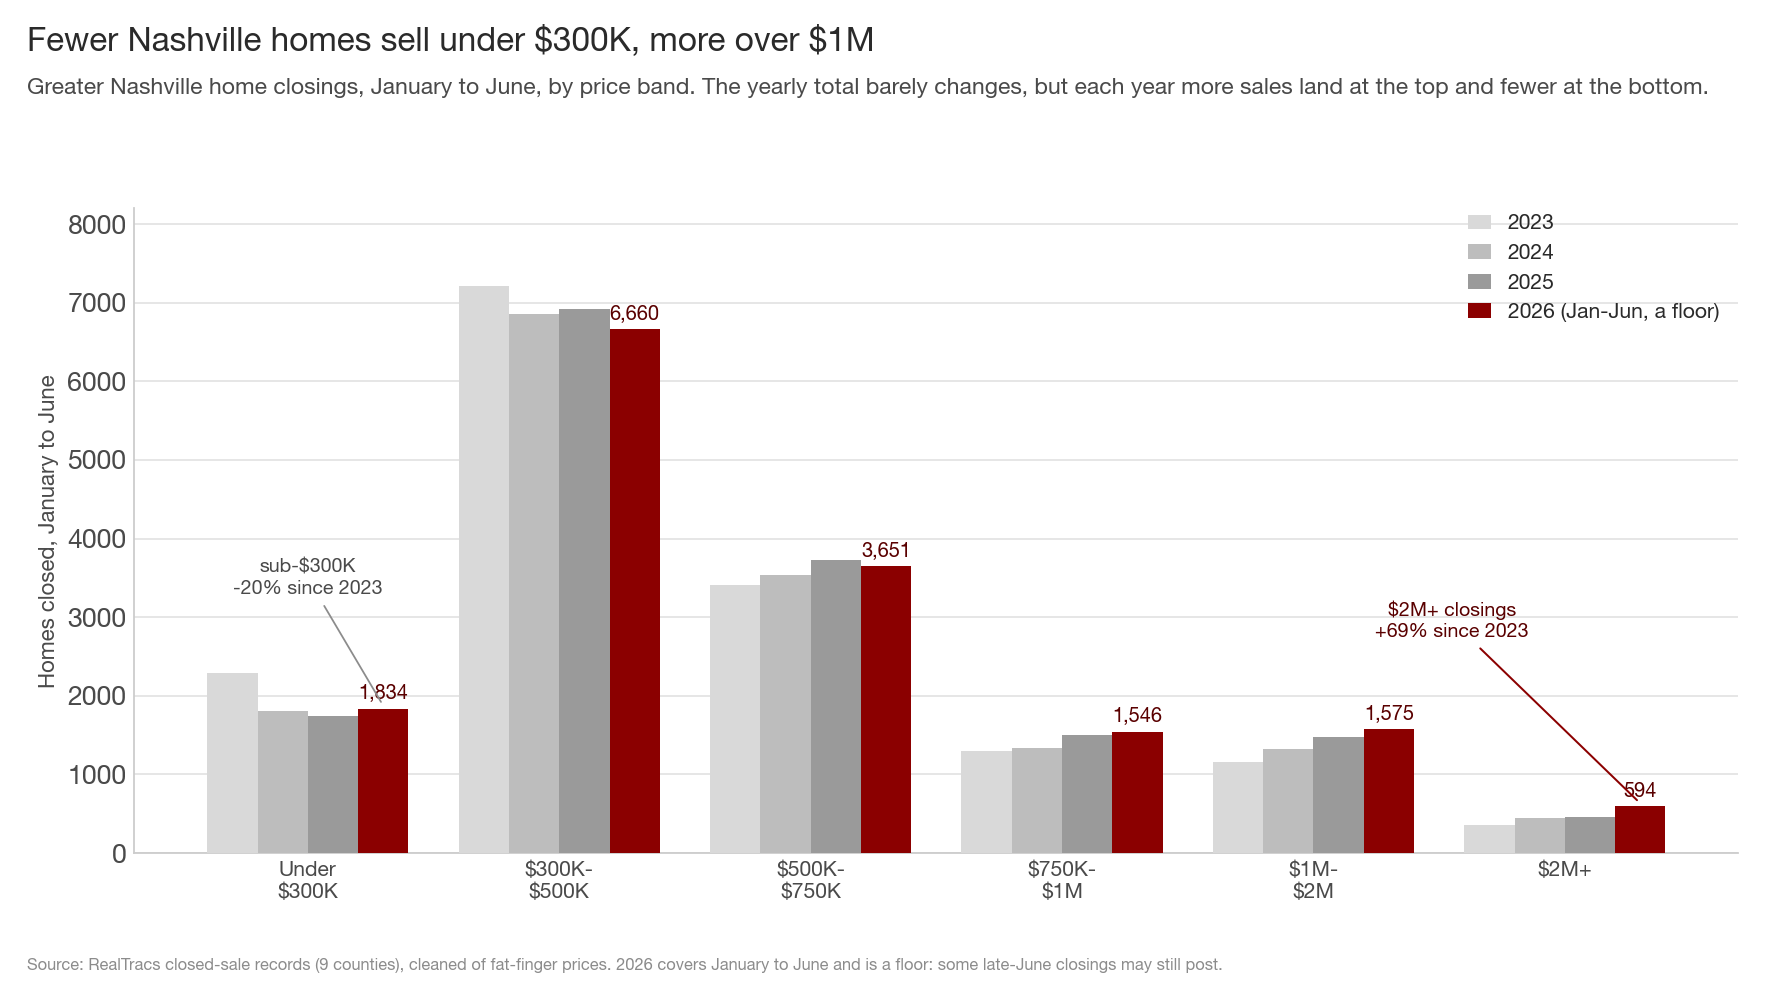
The same price gap shows up in what actually sells here. Count every home that closed in the first half of the year and sort it by price. The biggest band is still $300K to $500K, with 6,660 closings through June. But the yearly total barely moves (first-half closings have stayed between about 15,300 and 15,900 for four years straight), and inside that flat total, more of the sales keep landing at higher prices. Since 2023, closings under $300K are down 20%, while sales between $1M and $2M are up 35% and sales over $2M are up 69%. The more expensive the band, the faster it grew.
In the first half of 2026, 594 homes sold for more than $2M, the most in any first half on record and 31% more than last year. Go back to the 2021 buying frenzy and the change is bigger still: homes selling under $300K have dropped from about 7,000 in a first half to 1,834. Nashville has gotten too expensive for as many low-priced sales, and it pulls in enough high-end buyers to lift the top. The people priced out of the middle are the same ones showing up in the Knoxville column.
One caveat on the 2026 bar. It covers January through June and is a floor, because some late-June closings take a few weeks to post. If anything it undercounts the current year, so the high-end numbers here are the conservative version.
What this adds up to
Five threads, in order of how settled they are:
- Nashville is a net importer of expensive-metro demand. Los Angeles (+881) leads a list of mostly costly coastal origins, the spillover from the same job centers topping the national list of places people are leaving.
- Nashville is a net exporter to cheaper Tennessee. The top five outbound destinations are all in-state, led by Knoxville (+448), and every one is cheaper than Nashville. This is the affordability story that gets less attention.
- Price explains the direction in both lanes. Buyers arrive from metros averaging ~$811K and leave for ones averaging ~$340K, with Nashville at $463K in the middle. The price gap is what drives it.
- The money moving in is larger than home prices imply. Households relocating from Chicago earned $153,000 on average and from Los Angeles $160,000 in 2022-2023, even though Chicago's homes cost less than Nashville's. That is wealth relocating, and the IRS income data lags about three years behind the search figures.
- Tennessee ranks fourth nationally, and the demand is real. Net inflow is +10,187, and locally it shows up most at the high end, where equity-rich transplants buy ($1M to $2M contracts +21.3%). Read Redfin's figures as directional, but the direction points up.
For sellers, your buyer pool splits in two: equity-rich transplants at the top, locals and first-time buyers on a budget at the bottom, and a thinner field for the ordinary move-up house in between. For buyers priced out of a move up, the fallback is the cheaper Tennessee metros your neighbors are already leaving for. For builders, demand holds up at the entry level and the upper-middle, while the ordinary move-up middle that much of recent product targets is the weak spot.
The falsifiable part: if Nashville keeps pulling away from Knoxville and Clarksville on price, the outbound-to-Tennessee flow should widen in Redfin's Q2 2026 update this fall, and Los Angeles should hold its spot as the top inbound source. In our own closing data, the tell is simple: if sales over $1M keep rising while sales under $300K keep falling, the market is still shifting toward higher prices, and the people priced out are the ones showing up in the outbound column.
Migration flows: Redfin migration analysis, Q1 2026 (January to March), based on Redfin.com users searching across more than 100 metro areas; a measure of search intent rather than completed moves, defined at the metro (Combined Statistical Area) level. Typical home values: Zillow Home Value Index, single-family, May 2026. Mover incomes: IRS Statistics of Income county-to-county migration, tax years 2022-2023 (average adjusted gross income per household). Local market data: RealTracs MLS, Greater Nashville (9 counties: Davidson, Williamson, Rutherford, Wilson, Sumner, Maury, Dickson, Cheatham, Robertson), week ending July 1, 2026.