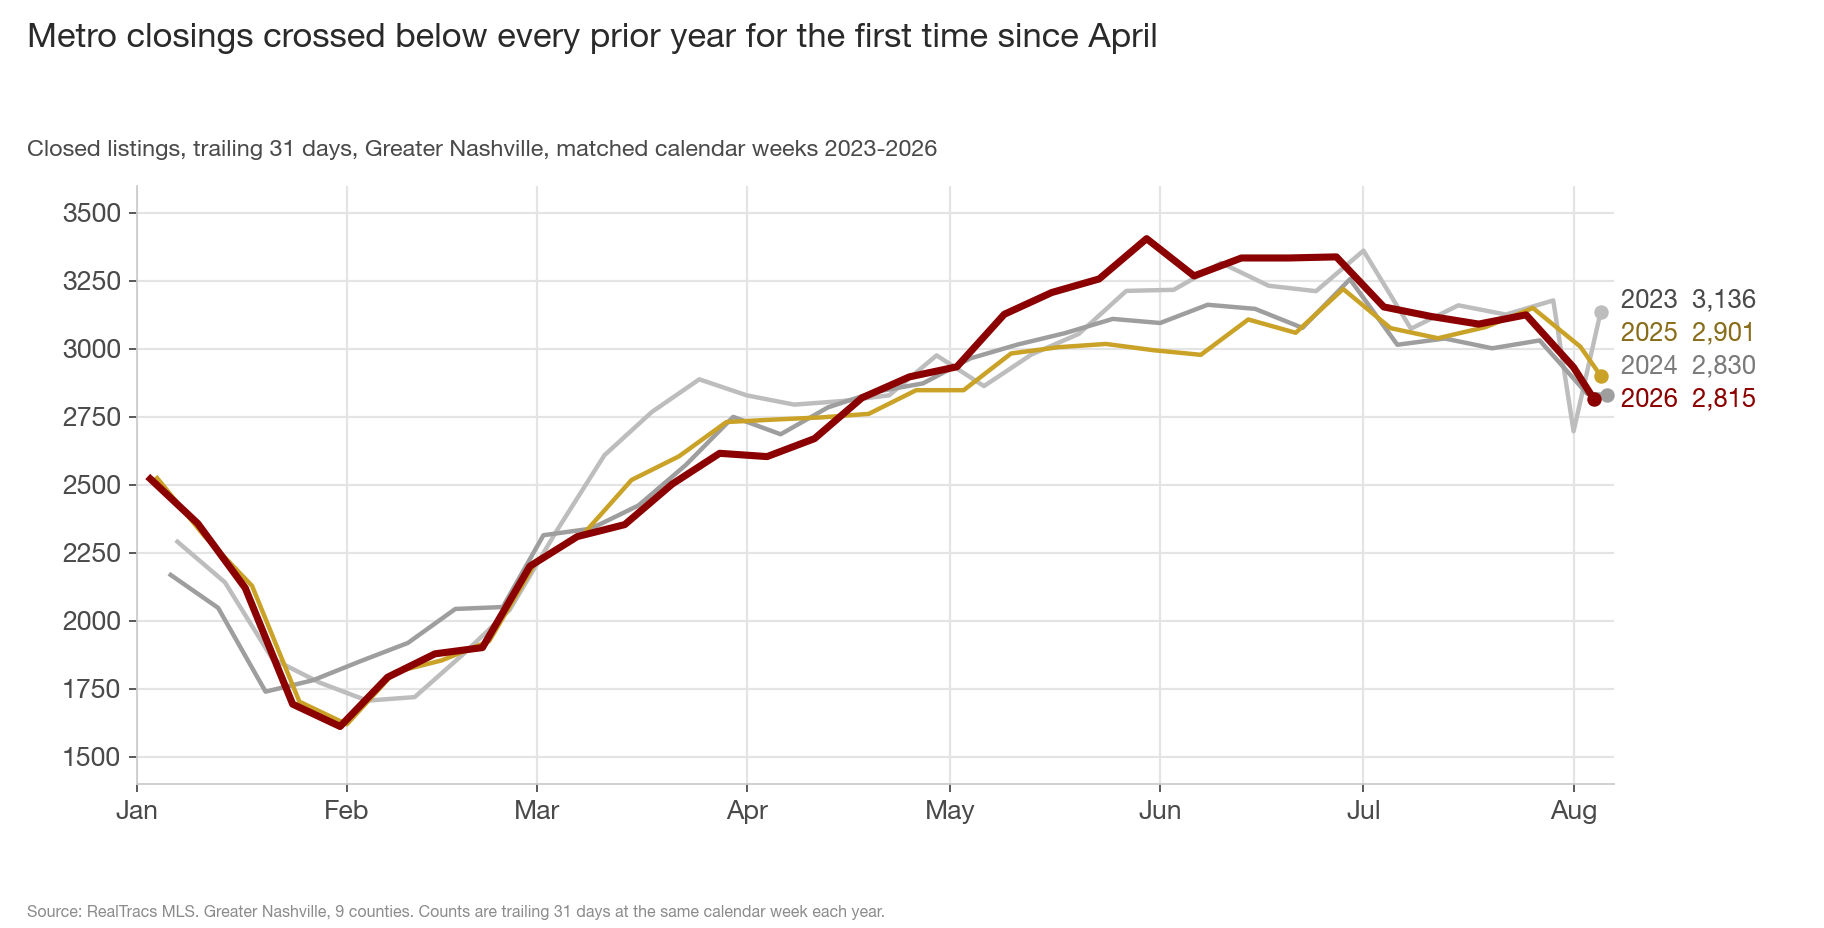
The metro closed 2,815 listings in the trailing 31 days, against 2,901 at the same week of 2025, 2,830 in 2024 and 3,136 in 2023. It is the first week below all three prior years since April 11. The gap is almost entirely new construction: resale closings are 2,209, within 0.2% of last year, while new construction closed 606, the fewest for this point of the summer in the four years of data. New construction is 82 of the 86-closing gap against 2025.
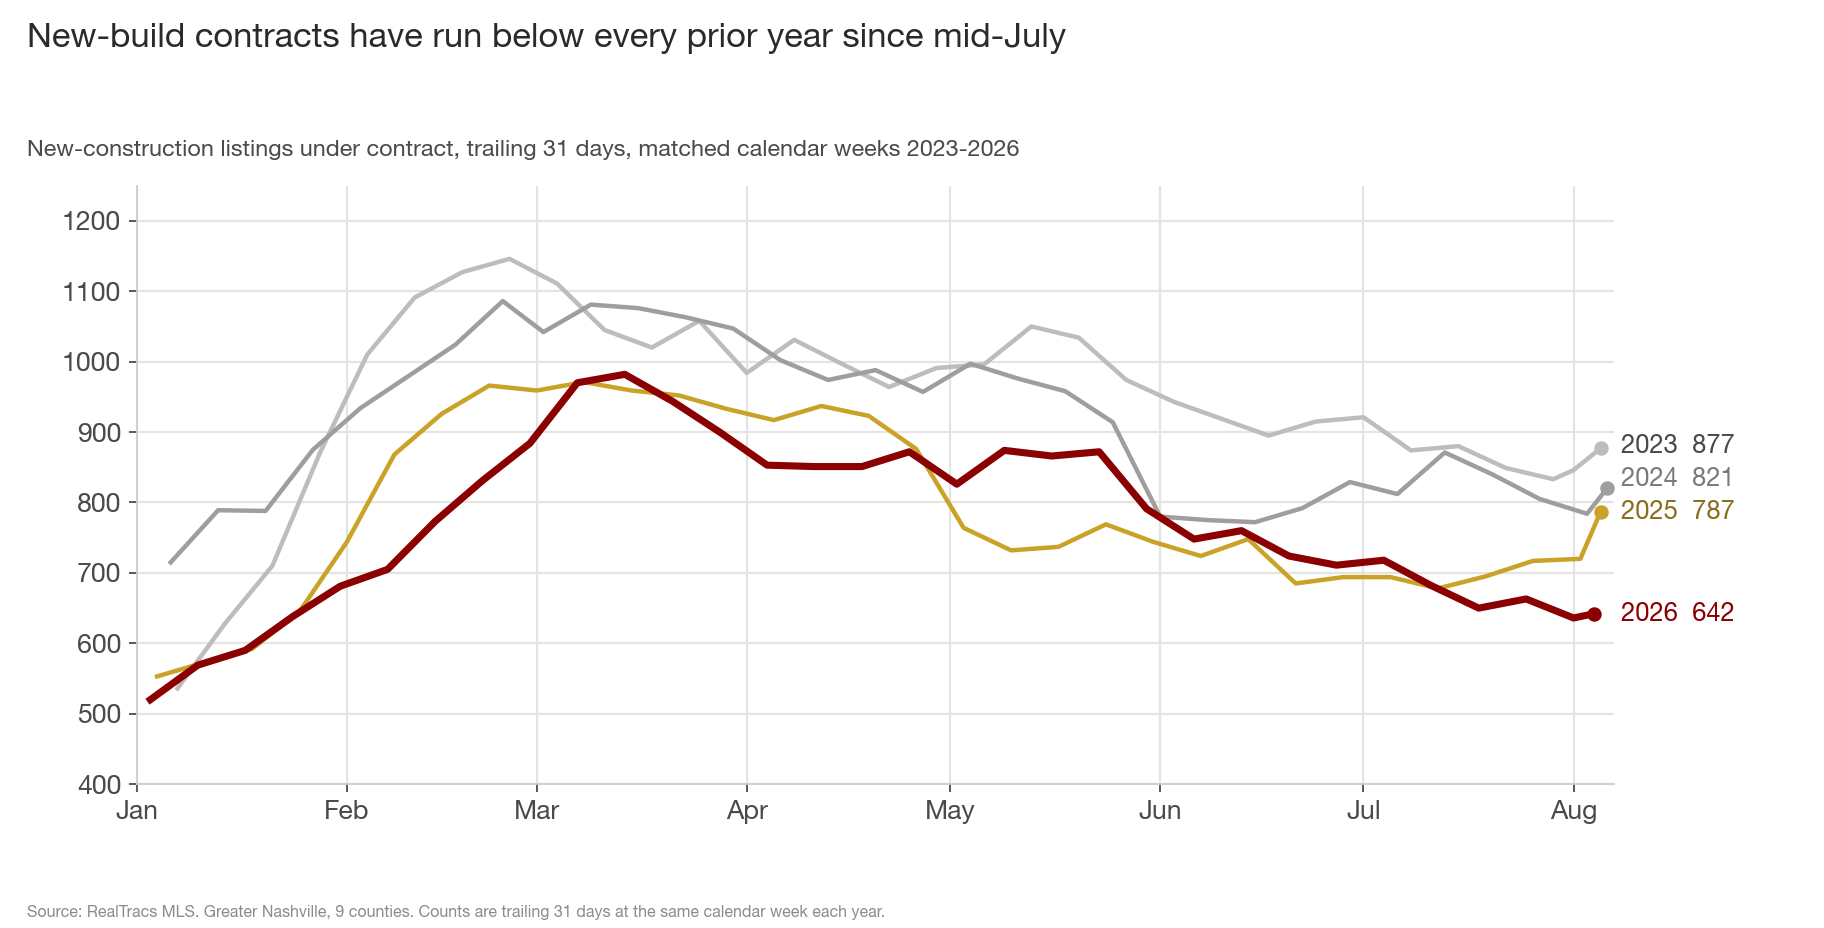
The contracts that become the next 60 to 90 days of closings show the same pattern. New-build contracts have run below every prior year since mid-July, at 642 against 787, 821 and 877. The five charts below cover the crossing, the resale-vs-new split, the contracts, builder pricing, and which counties it is coming from.
1. Metro closings crossed below every prior year for the first time since April
As recently as late May, closings were running 410 ahead of 2025 and 310 ahead of 2024. The year-over-year reading has now been negative for three straight readings: -25 on July 25, -76 on August 1, and -86 now. Against 2024 the count is essentially even, 15 closings lower, and against 2023 it is 10.2% lower.
The move comes from this year's count: closings fell 15.7% from the late-June week, the largest such decline of the four years (2024 fell 13.1%, 2025 fell 9.9%, 2023 fell 6.7%).
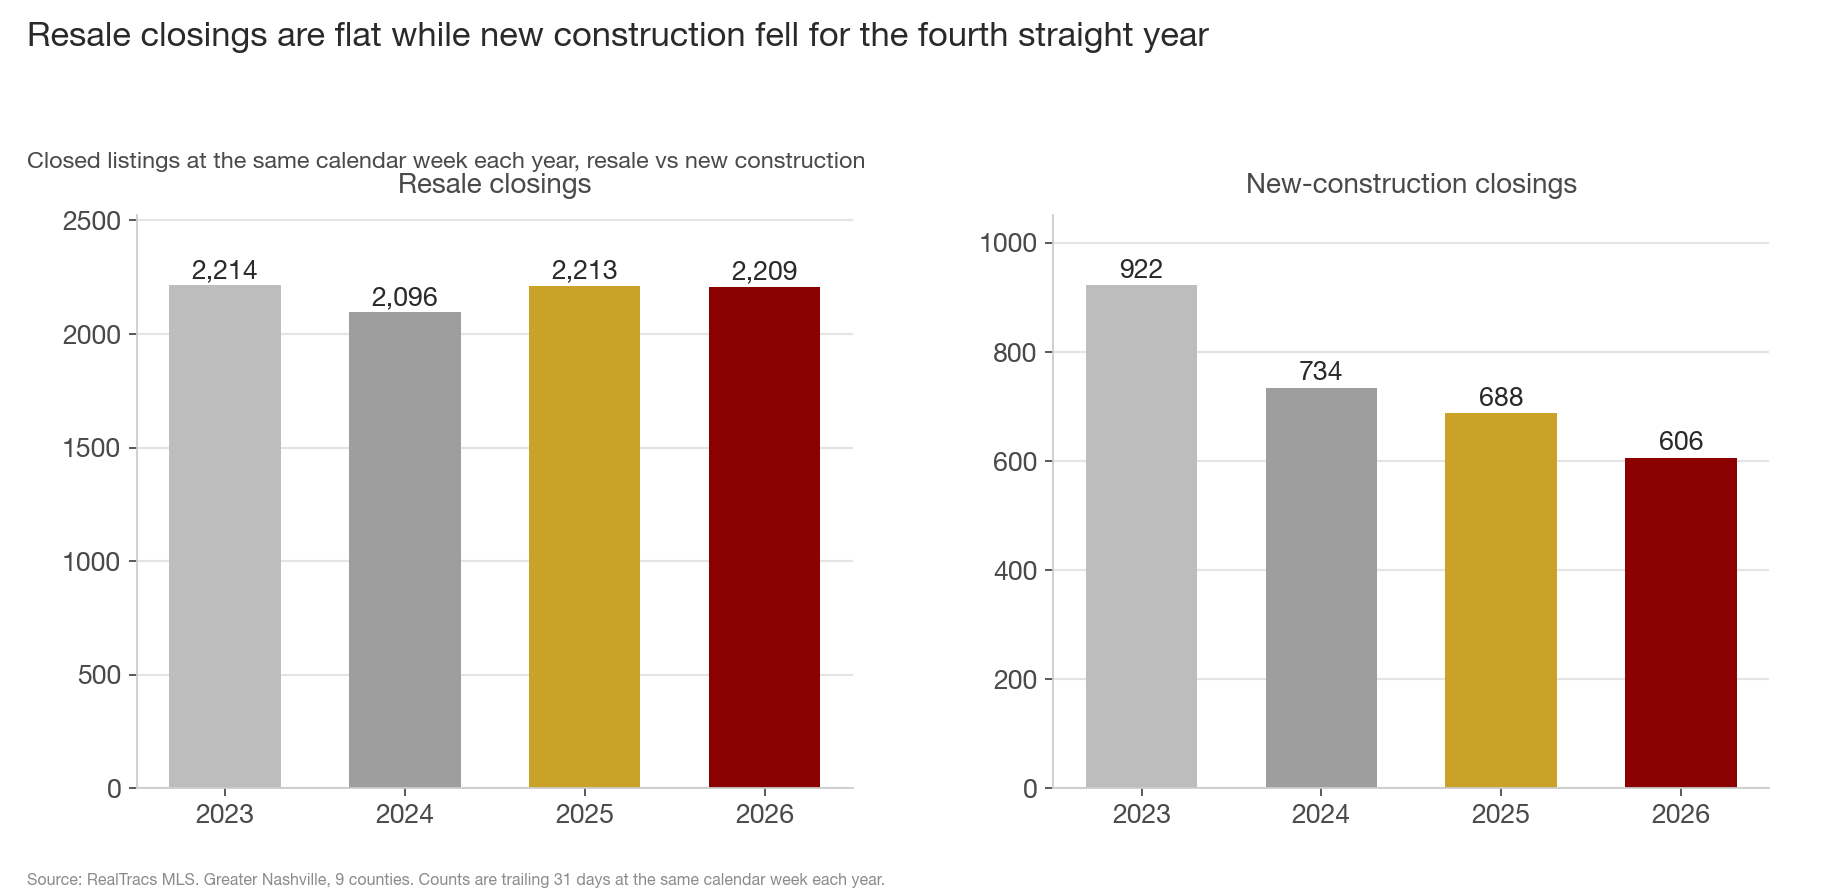
2. Resale closings are flat while new construction fell for the fourth straight year
Resale closed 2,209, against 2,213 last year, 2,096 in 2024 and 2,214 in 2023: within 0.2% of both 2025 and 2023, and 5.4% above 2024. New construction closed 606, down from 688, 734 and 922: 11.9% below last year, 17.4% below 2024 and 34.3% below 2023, the fourth straight year lower at this week. Builders' share of metro closings has fallen from 29.4% in 2023 to 21.5% now.
Within resale, houses closed 41 above last year while condos closed 45 below; both new-build types are down, houses by 58 and condos by 24.
3. New-build contracts have run below every prior year since mid-July
New-construction contracts are at 642, against 787 at the same week of 2025, 821 in 2024 and 877 in 2023: down 18.4%, 21.8% and 26.8%. The count has been below all three prior years in each of the last four readings, the first such run since late April, and no mid-July-to-mid-August week in any prior year had fewer (the prior-year lows for that window are 678, 757 and 833). Builders' share of metro contracts is 24.2%, down from 27.5%, 29.8% and 30.6% at this week in the three prior years.
The June 20 post set a checkpoint: new closings would stay near four-year lows through summer unless new contracts moved above roughly 790. Contracts instead fell to 642, and closings are at 606.
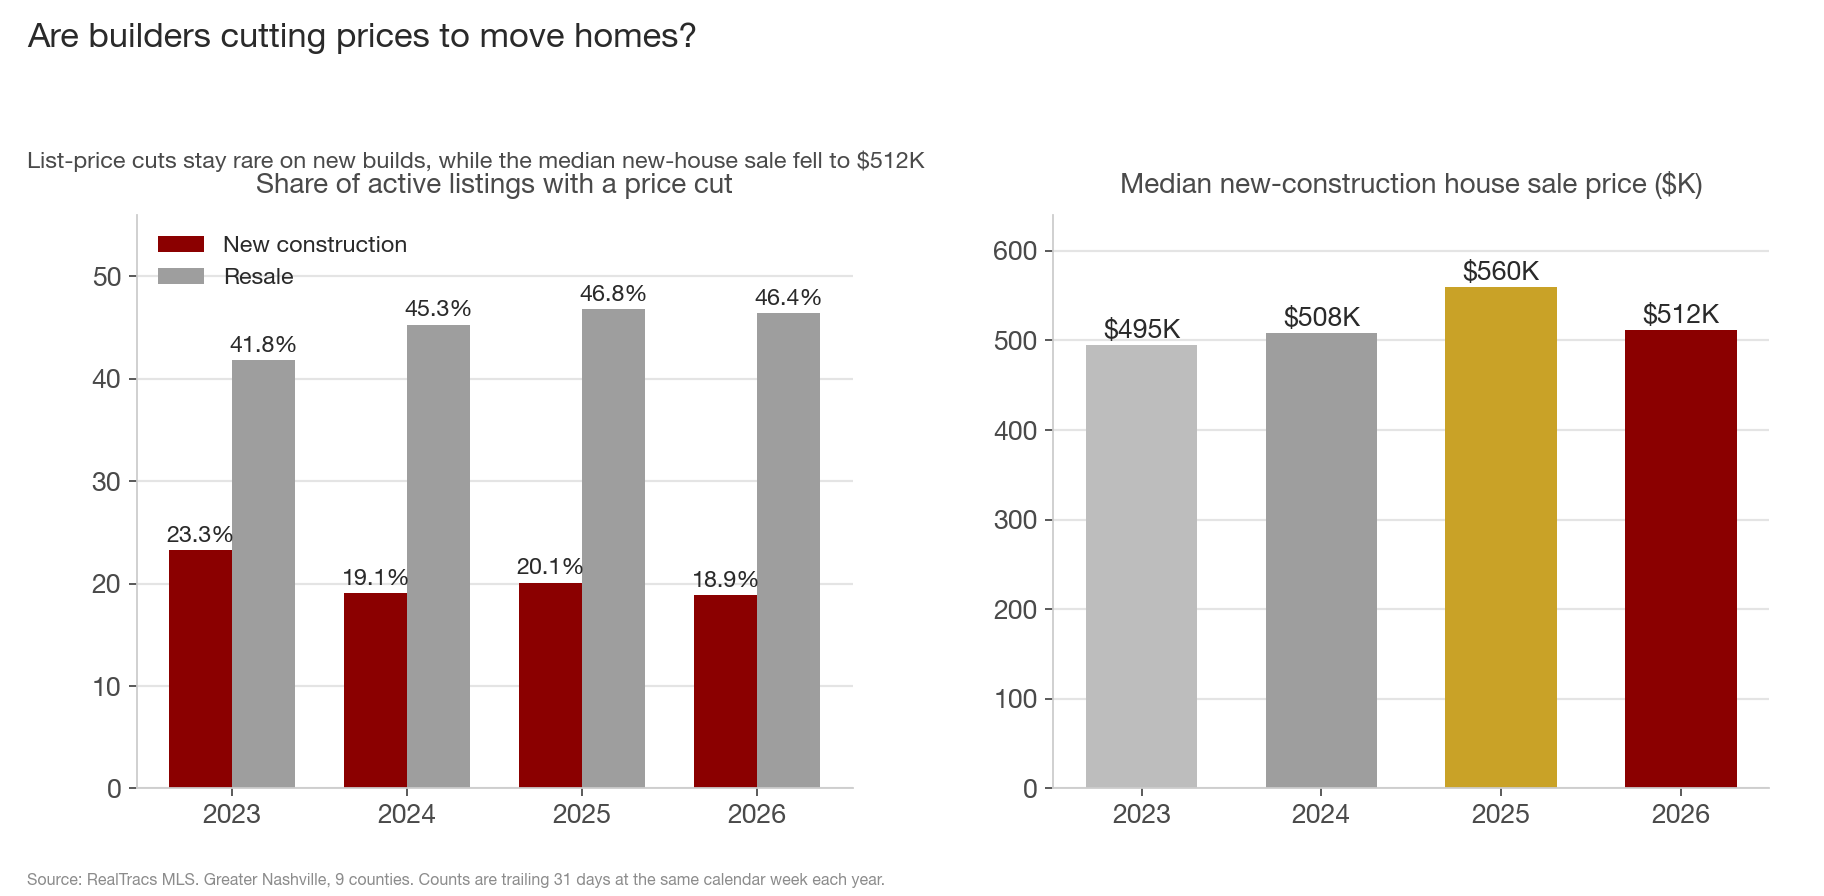
4. Are builders cutting prices to move homes?
Not on list prices. 18.9% of active new-construction listings have cut price, the lowest share of the four market segments (resale is at 46.4%, houses overall 39.7%, condos 39.9%) and below last year's 20.1%. Unsold new-build listings are flat at 2,967 against 2,965 a year ago, which puts new-build active listings per contract at 4.6, from 3.8 last year and 3.1 in 2024, because the contract count fell.
Closed prices did slip. The median new-build sale is $485,000, down 5.8% from $515,000 last year. For new houses specifically, the median is $512,000 against $560,000 last year, back near 2024's $508,000, and price per square foot is $234 against $245.
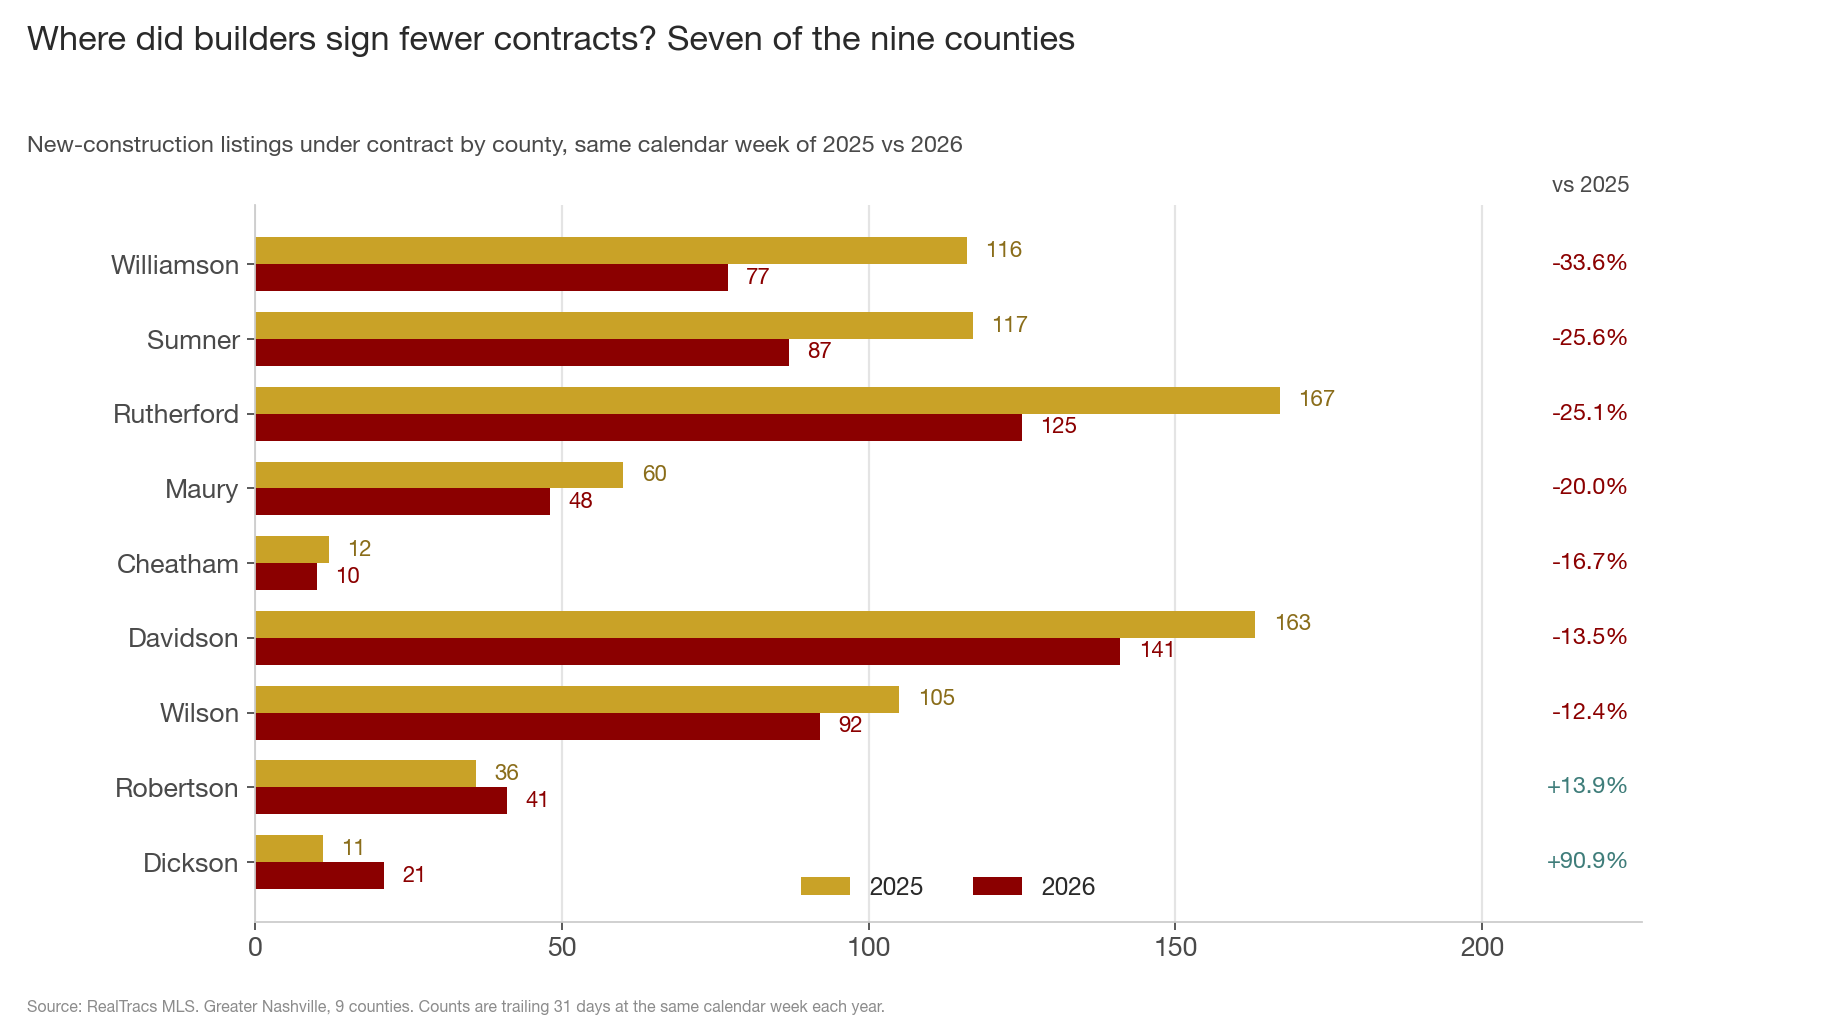
5. Where did builders sign fewer contracts? Seven of the nine counties
Against last year, new-build contracts are down in seven of the nine counties, and against 2024 they are down in eight. Williamson has the largest percentage drop, -33.6% (116 to 77). Rutherford has the largest count drop, -42 (167 to 125), consistent with the July 31 post on that county. Sumner is down 25.6%, Maury 20.0%, Davidson 13.5%. The two gains are small: Dickson added 10 contracts (11 to 21) and Robertson 5 (36 to 41). Dickson also closed 29 new builds against 8 last year, which is most of why its total closings (87, from 70) show the largest percentage gain of the nine counties this week.
What this adds up to
- Metro closings are 2,815, below all three prior years for the first time since April 11, after running 410 ahead of 2025 in late May.
- Resale closings are within 0.2% of last year; new construction is 82 of the 86-closing gap and down 34.3% from 2023.
- New-build contracts have run below every prior year since mid-July, at 642, the fewest for mid-July-to-mid-August in the data.
- Builders are not cutting list prices (18.9% cut share, lowest of the four segments), but the median new house closed at $512,000 against $560,000 last year.
- The contract decline covers seven of nine counties, led by Williamson at -33.6%.
The June 20 post found builders closing the fewest homes in four years and holding price. Six weeks later the same pattern covers the demand side: both contracts and closings are below every prior year, and the pullback now covers most of the metro instead of mainly Davidson. Resale volume is flat against last year on 12.9% more active listings, while new construction has fewer contracts and fewer closings than any prior year.
For buyers of new construction, 4.6 active listings per contract is the highest for this week in the four years of data, and the price section shows the homes builders closed were cheaper than last year's even while list prices held. For builders, the June checkpoint stands: contracts needed to reach roughly 790 to bring closings back up, and the count is 642. For anyone reading the metro closing total this fall, the resale-vs-new split is the number to check before treating a negative week as a market-wide slowdown.
What to watch: contracts signed now close in roughly 60 to 90 days. If new-build contracts stay under last year's 787, new closings should stay below last year's level (688) through September, and the metro total should stay below 2025 unless resale volume rises. If new contracts move back above the high-700s, this July's dip was noise. Check the count in early September.
Data through week ending 08-04-2026, Greater Nashville (Davidson, Williamson, Rutherford, Wilson, Sumner, Maury, Dickson, Cheatham, Robertson). Counts are trailing 31 days at the same calendar week each year. Source: RealTracs MLS.