Overall single-family price cuts are flat versus last year: 39.5% of listings now, 40.3% then. The flat average hides the move. Cuts shifted to the cheapest houses: 53.8% of under-$300K listings have cut price, up from 44.4% a year ago, while the middle of the market eased. The five charts below show where the cuts moved.
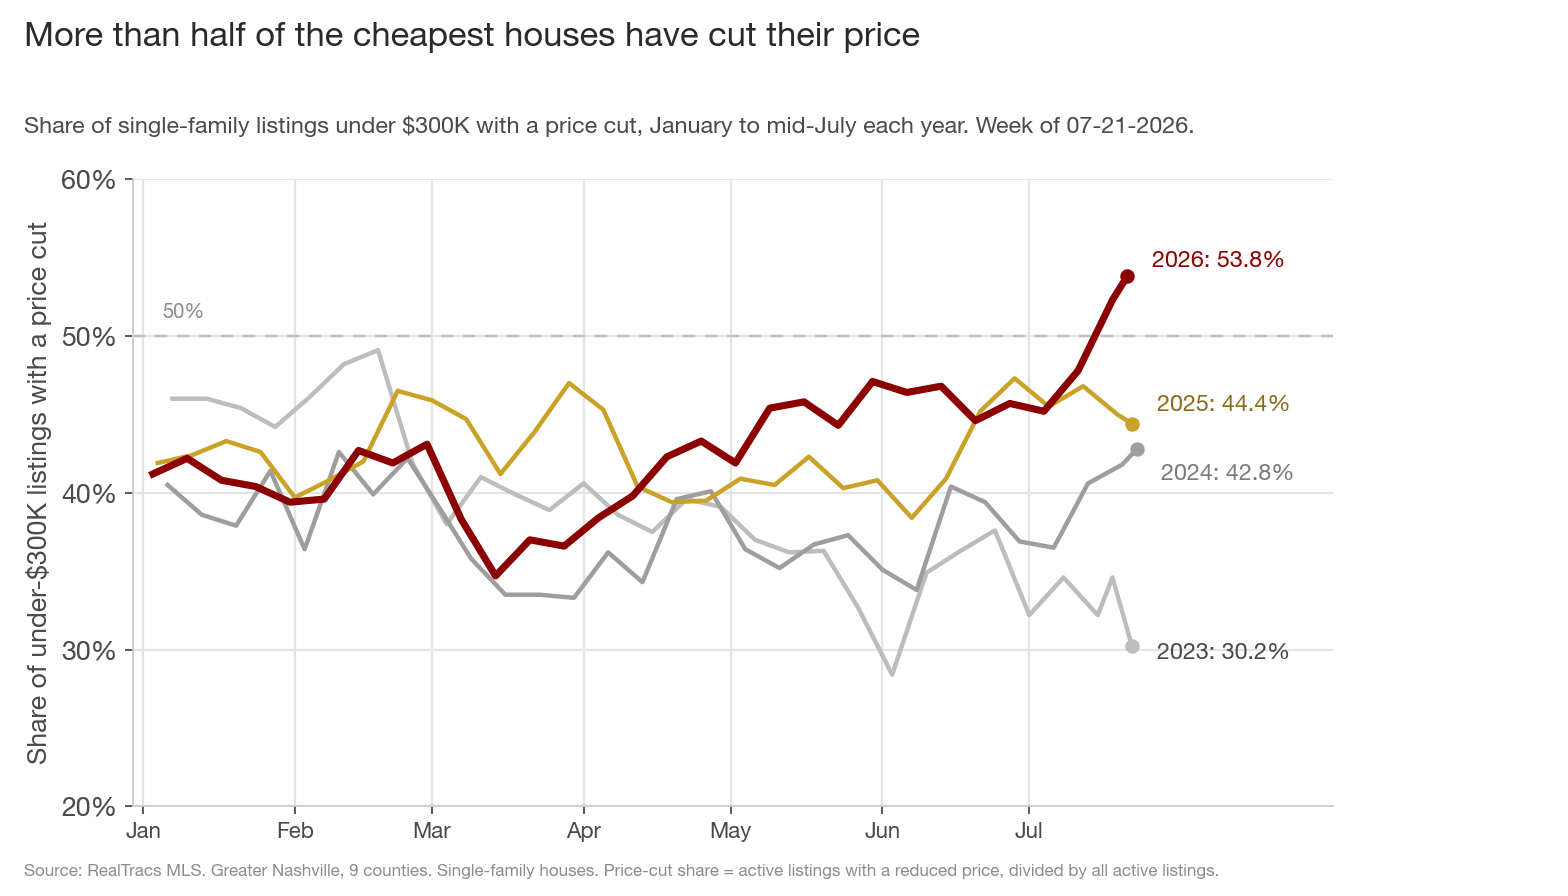
1. More than half of the cheapest houses have cut price
The under-$300K cut share climbed every year: 30.2% in 2023, 42.8% in 2024, 44.4% in 2025, 53.8% now. This is the first year above half by midsummer. In 2024 and 2025, the low 50s only arrived at the autumn peak. Single-family houses only; condos are excluded.
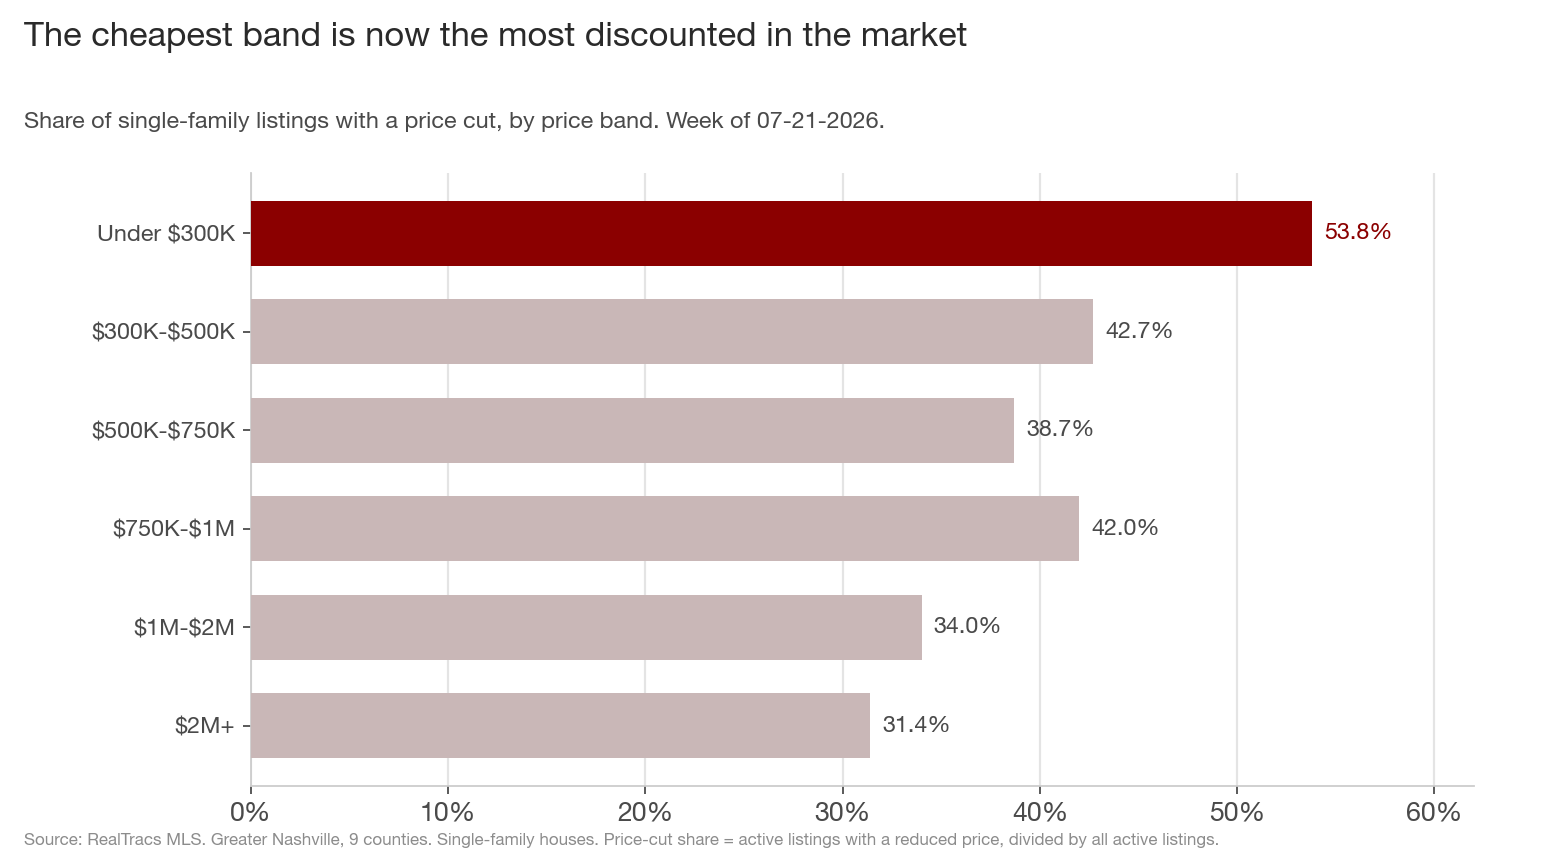
2. The cheapest band is now the most discounted in the market
Under $300K leads all six price bands at 53.8%. The next band, $300K-$500K, is 42.7%, eleven points lower. The $2M+ band cuts least at 31.4%.
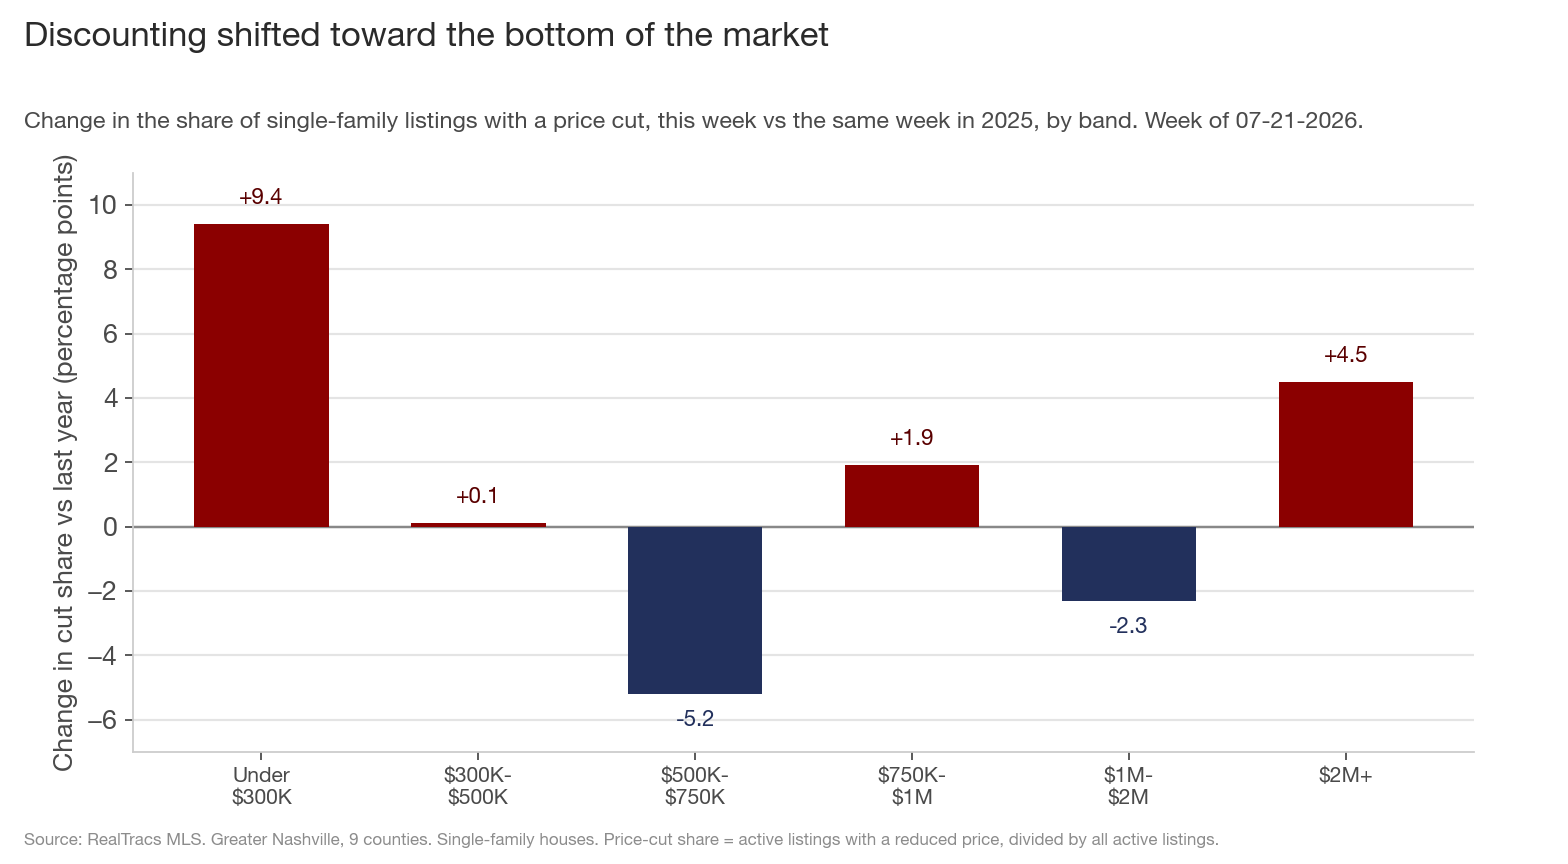
3. The discounting shifted toward the bottom of the market
Change versus the same week last year: under $300K rose +9.4 points, by far the largest move. The middle fell: $500K-$750K -5.2, $1M-$2M -2.3. The rise at the bottom offset the decline in the middle, which is why the overall number looks flat.
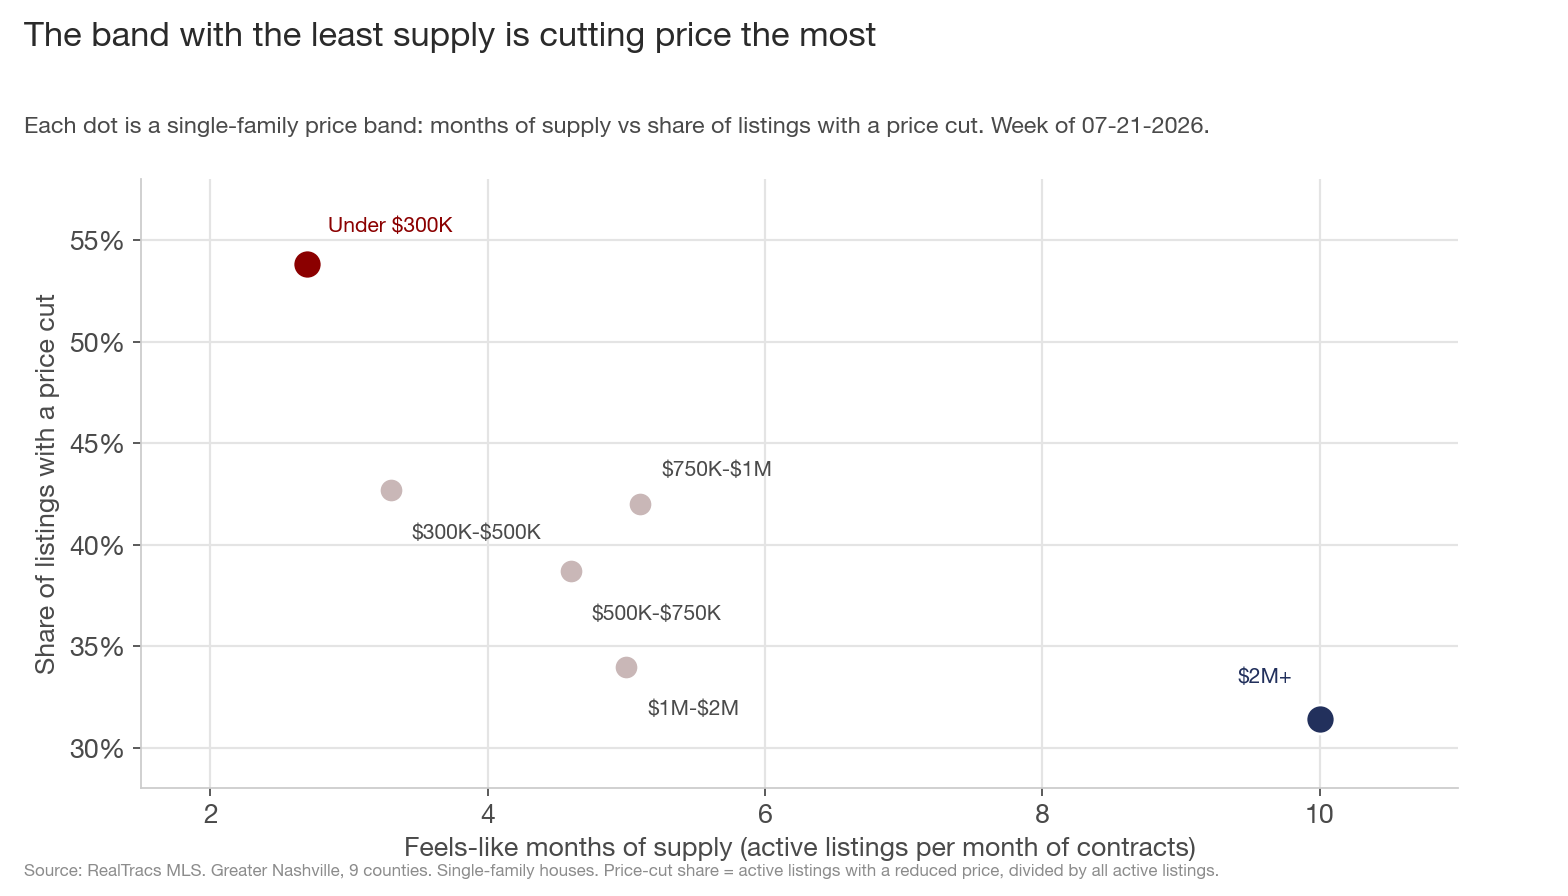
4. The tightest supply, and the deepest cuts, sit at opposite ends
Under $300K has the least supply of any band, a feels-like 2.7 months (active listings divided by monthly contracts), and the deepest cuts. $2M+ has the most supply, 10 months, and the fewest cuts. Oversupply would slope this chart the other way. This is affordability: the buyers for the cheapest houses are the most stretched, so a listing priced even slightly high sits, and the seller cuts.
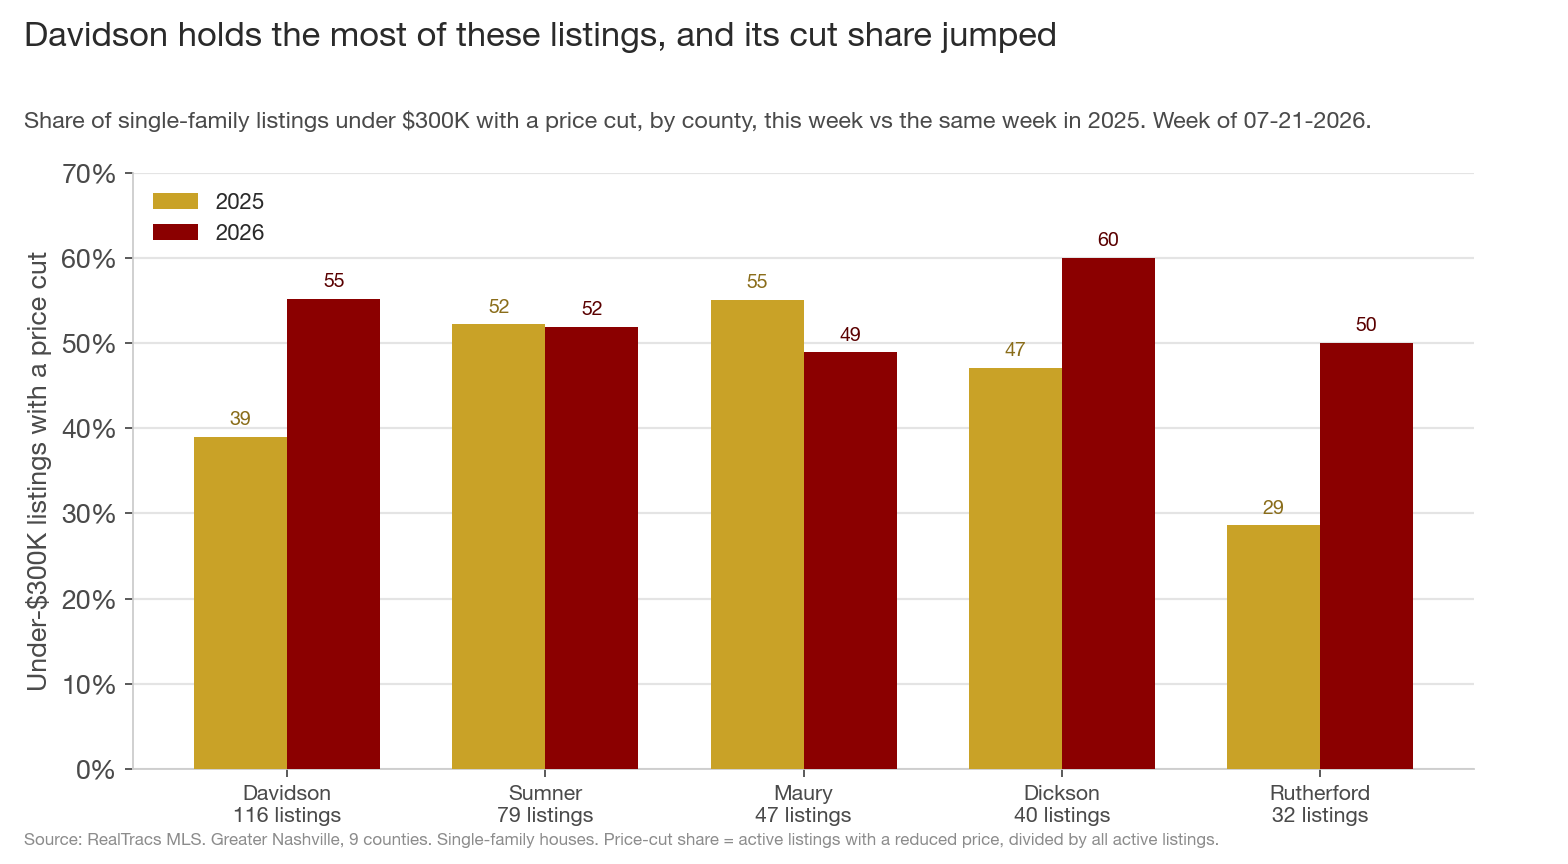
5. Davidson holds the most of these listings, and its cut share jumped
Davidson has 116 under-$300K houses for sale, the most of any county. Its cut share went from 39.0% to 55.2%. Rutherford rose from 28.6% to 50.0% and Dickson from 47.1% to 60.0%, while Sumner and Maury held about flat or eased.
What this adds up to
- Overall single-family price cuts: flat at 39.5%.
- Under $300K: 53.8% cutting, up 9.4 points, the most-discounted band and the first above half by midsummer.
- The middle eased: $500K-$750K at 38.7%, $1M-$2M at 34.0%.
- The cheapest band has the least supply (2.7 months) yet the deepest cuts, which points at buyer affordability.
- Davidson holds the most of these listings (116) and its cut share jumped from 39.0% to 55.2%.
Sellers under $300K: more than half of your competition has already lowered its price, so pricing right on day one matters more than it did a year ago. Buyers: the cheapest listings are more negotiable than the flat headline number suggests.
What to watch: price cuts normally rise into fall. If the under-$300K share keeps climbing from 53.8% while the middle stays soft, the overall single-family number rises with it. If it flattens here, the seasonal top came early at the bottom of the market.
Data through week ending 07-21-2026, Greater Nashville (9 counties: Davidson, Williamson, Rutherford, Wilson, Sumner, Maury, Dickson, Cheatham, Robertson). Source: RealTracs MLS.