Realtor.com's June housing report produced a headline that traveled fast: "The national median home asking price fell 2.5% in June to $430,000, the steepest annual decline in [Realtor.com] data history, saving the typical buyer more than $1,500 a year compared with June 2025." That is a real number from a real dataset (their monthly records go back roughly nine years), it was the eighth straight month of annual list-price declines, and the full report is framed around buyers finally getting their summer. The natural reading is that homes are getting cheaper.
Here is the problem with that reading: a median is a composition statistic. The median asking price falls when sellers cut prices, and it also falls when the mix of what is listed shifts toward cheaper kinds of homes, with no individual home changing price at all. From the outside the two look identical. Greater Nashville's data this week separates them about as cleanly as I have seen, because our own affordable tier is booming on paper (under-$300K listings are up 26.4% year over year, the biggest jump of any price band) while the thing most buyers picture when they hear "affordable home", a detached house, keeps quietly vanishing from it.
Five numbers tell the story, so this post has five charts: where the inventory growth is, what actually sells under $300K, what happened to the detached starter house, what is piling up instead, and how fast each product type actually moves.
1. Nashville's fastest-growing price tier is its cheapest
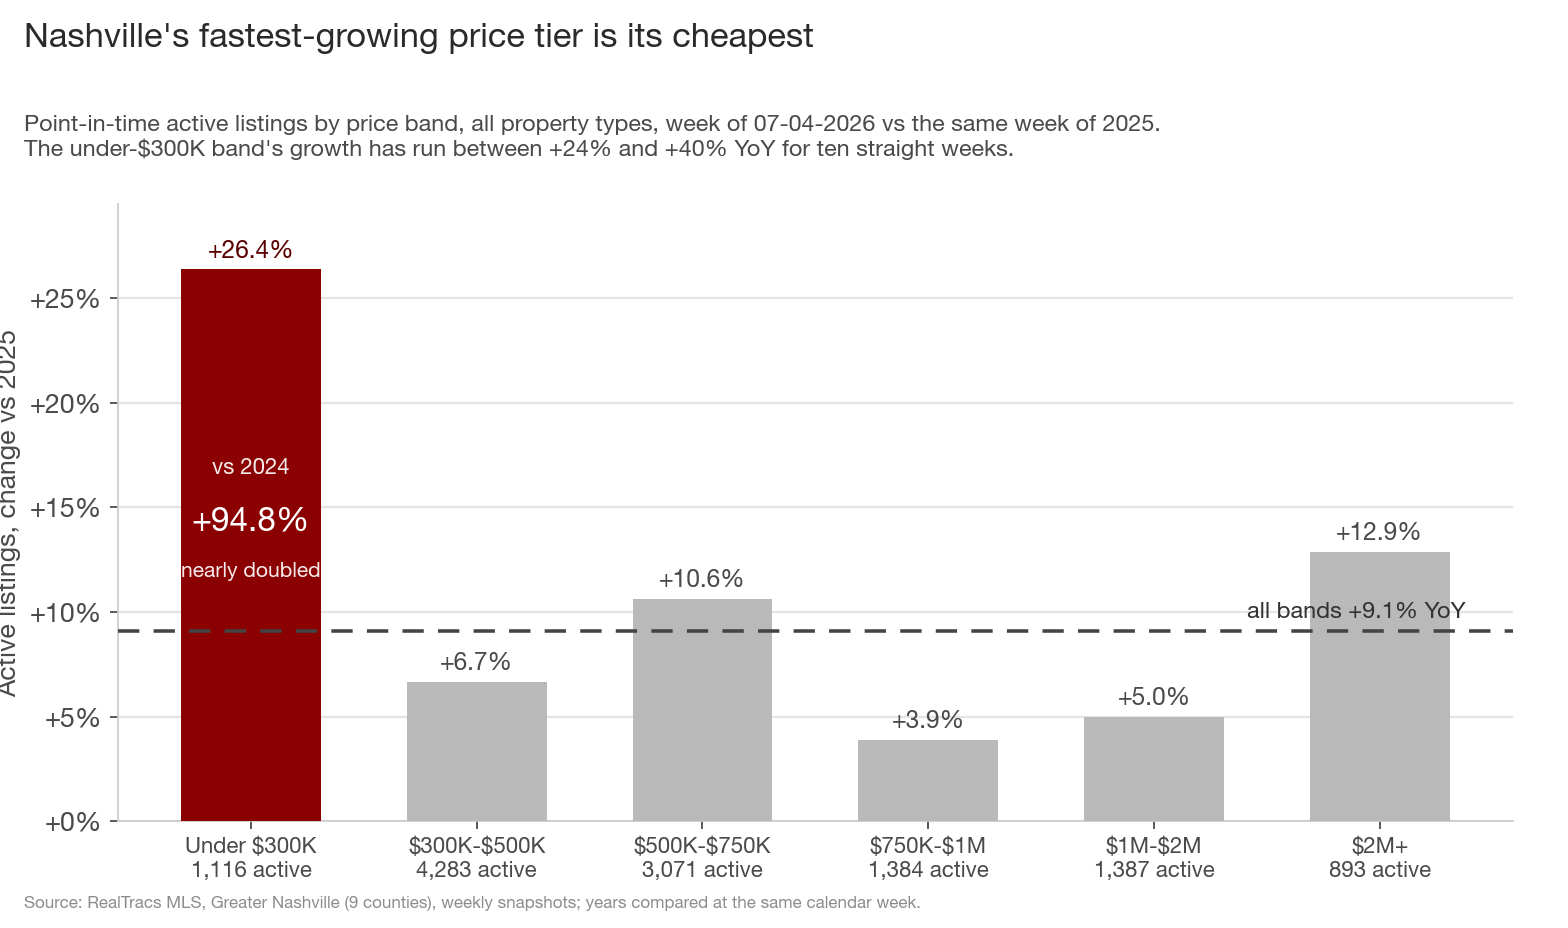
Greater Nashville has 12,183 active listings this week, up +9.1% from a year ago. The growth is lopsided. Under-$300K listings are up +26.4% (883 to 1,116), roughly three times the market-wide pace and the biggest jump of the six price bands I track; the next closest is $2M+ at +12.9%. Against 2024 the tier is up +94.8%, nearly double in two years. And the trend is durable: the band's YoY growth has printed between +24% and +40% for ten straight weeks.
That growth is quietly rebalancing the whole inventory pool. The under-$300K tier was 6.9% of all Greater Nashville listings two years ago, 7.9% a year ago, and is 9.2% now.
Watch what that does to the metro's headline number. Nashville's all-property median asking price is $542K, down 1.5% from $550K a year ago. The single-family median asking price is $600K, exactly flat, a 0.0% change. Condos, which I always break out separately, sit at $375K, down 1.3%. When the fastest-growing slice of your inventory is the cheapest slice, the blended median drifts down even while the single-family number holds still. To be clear, Nashville is nowhere near the national 2.5% decline; the national report is the hook here, and Nashville is the case study. But the direction of our own dip comes from the same arithmetic, and the next four charts show the mechanism up close.
2. What actually sells under $300K? Less and less often a detached house
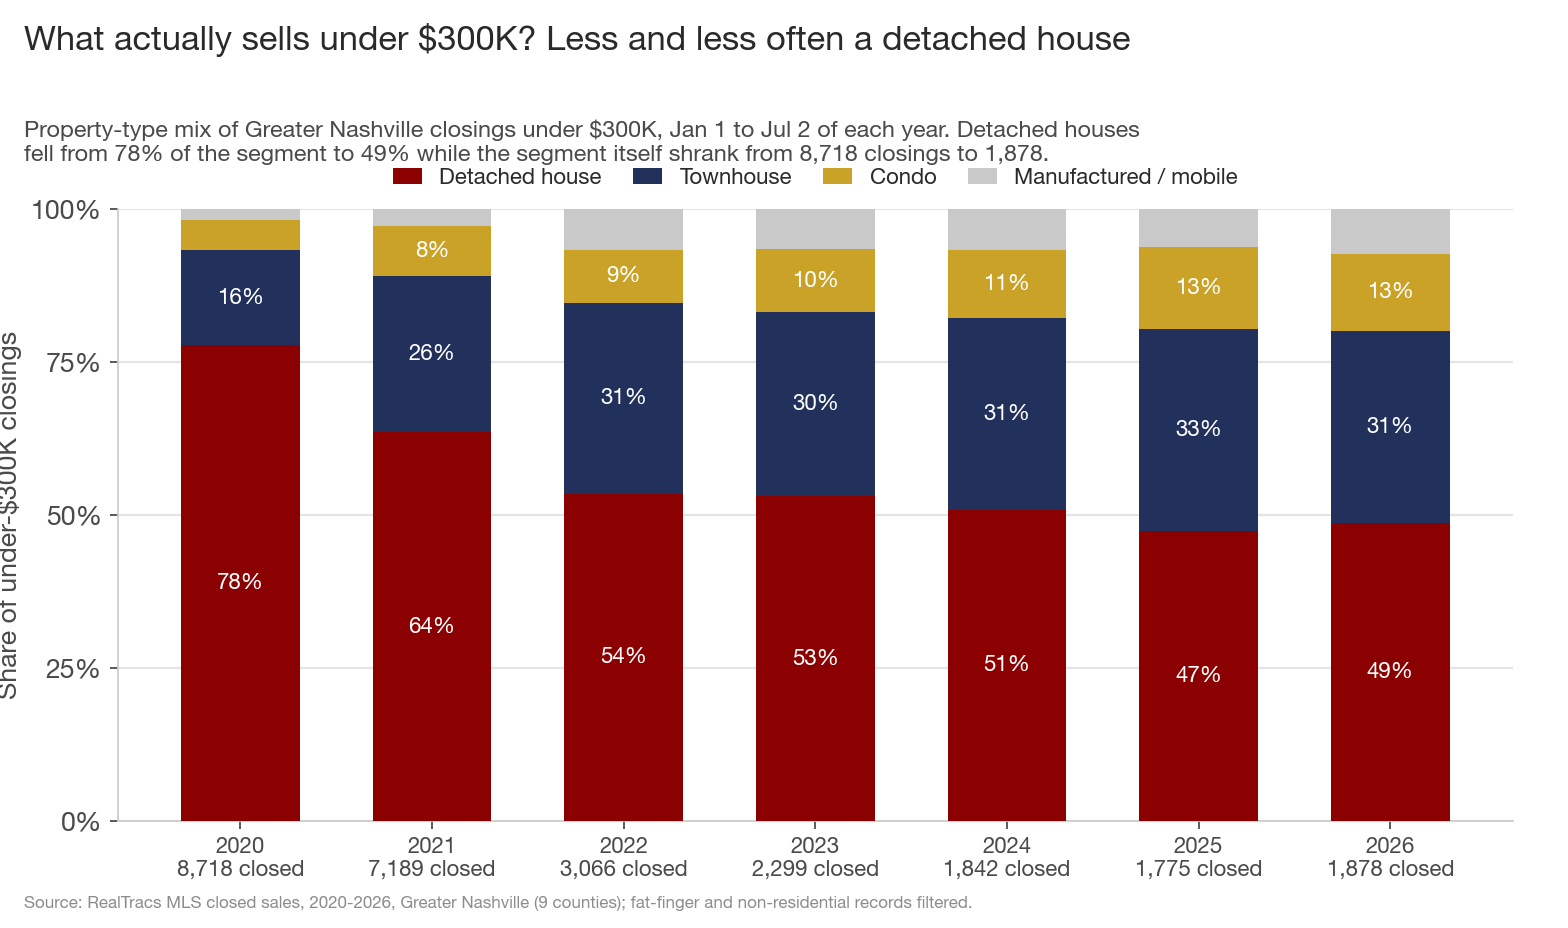
Take every closing under $300K in the nine counties, first half of each year (January 1 to July 2, so partial-year 2026 compares apples to apples with prior years), and sort it by property type. In the first half of 2020, 78% of under-$300K sales were detached houses. That share has fallen almost every year since and sits at 49% in 2026. Townhouses went from 16% to 31% of the segment, condos from 5% to 13%, manufactured and mobile homes from 2% to 7%. The segment itself collapsed around the mix shift: 8,718 under-$300K closings in the first half of 2020, 1,878 in the first half of 2026, down 78%.
Two honest caveats before anyone reads that as pure demand destruction. First, 2020 and 2021 were sub-3% mortgage years, and cheap money pulled enormous volume through the affordable tier; some of the decline since is simply that world ending. Second, $300K in 2020 and $300K in 2026 are different lines: six years of appreciation lifted thousands of homes that would have sold under the line in 2020 permanently above it. Part of the "collapse" is the line standing still while prices moved. Both caveats shrink the segment as a whole, while the rotation toward attached product within it is a separate fact that needs its own explanation.
For that, compare the sales counts by type: detached sales fell 87% from 2020 (next chart), while condo-plus-townhouse sales fell a milder 54% (1,787 to 826). Everything shrank; houses shrank fastest.
3. Under-$300K detached-house sales are down 87% since 2020
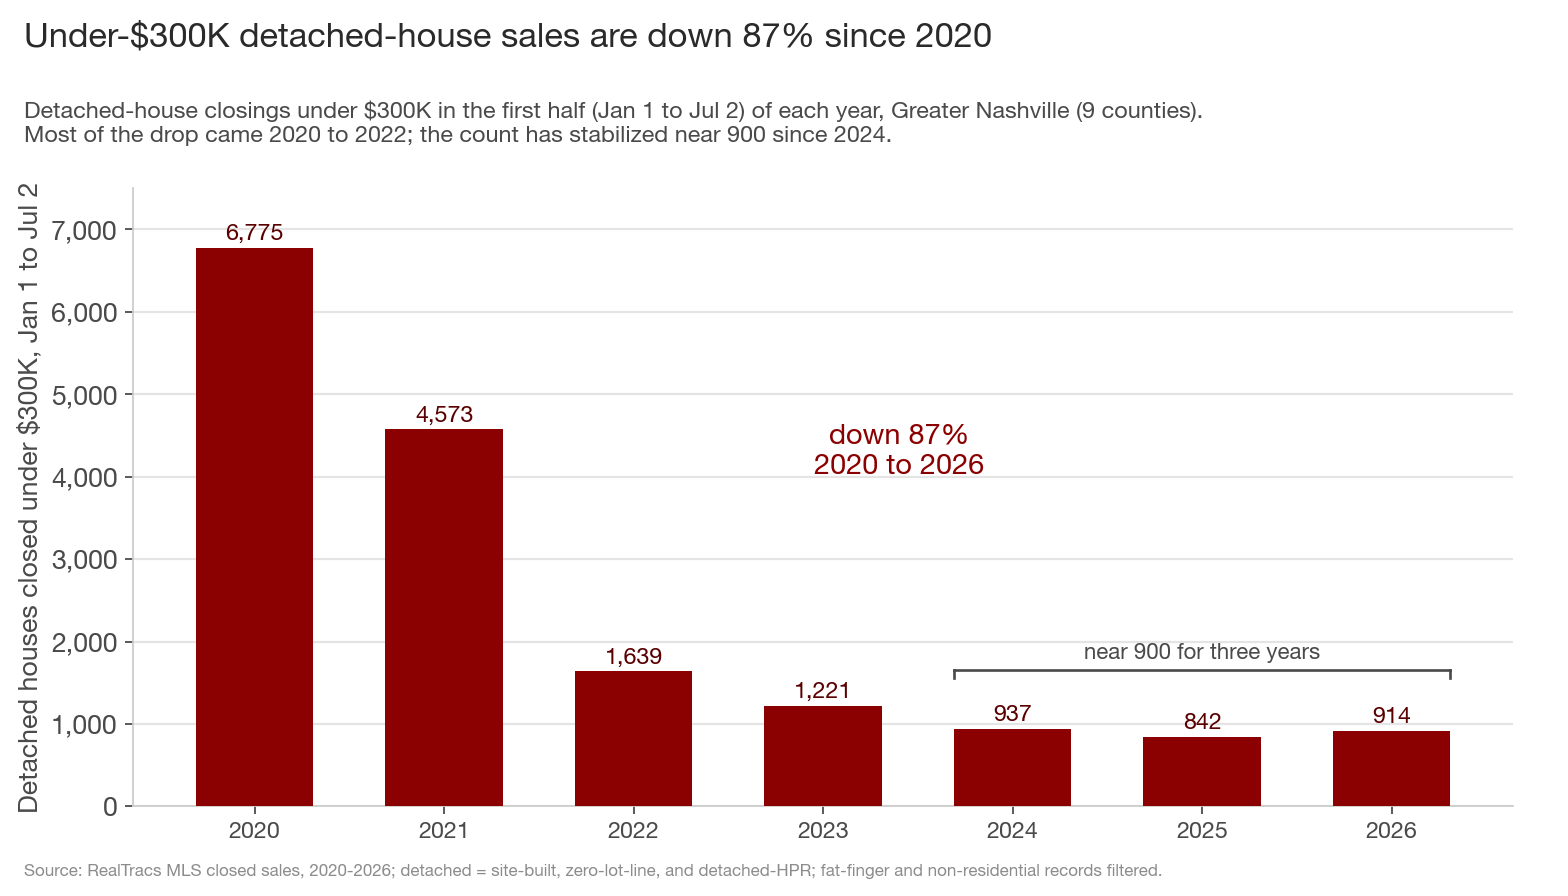
Here is the traditional affordable starter house on its own. Greater Nashville closed 6,775 detached houses under $300K in the first half of 2020. This year: 914, a drop of about 87%. Nearly all of the collapse happened from 2020 to 2022 (6,775 to 1,639) as appreciation repriced the tier, and since 2024 the count has stabilized in a narrow band around 900 (937, then 842, then 914).
That stabilization matters. It suggests roughly 150 detached houses a month is what this metro's geography and price structure can still produce under $300K: the outer-county stock, the small, the dated, the odd lot. It is a floor for now, and one of the falsifiable things I will be watching is whether it holds through the second half or resumes falling.
I wrote earlier this week about under-$500K homes becoming a minority of all closings for the first time. This is the same migration seen from its far end: the under-$300K house is where the ladder's bottom rung used to be, and in unit terms it is 87% gone.
4. What's piling up under $300K is attached inventory
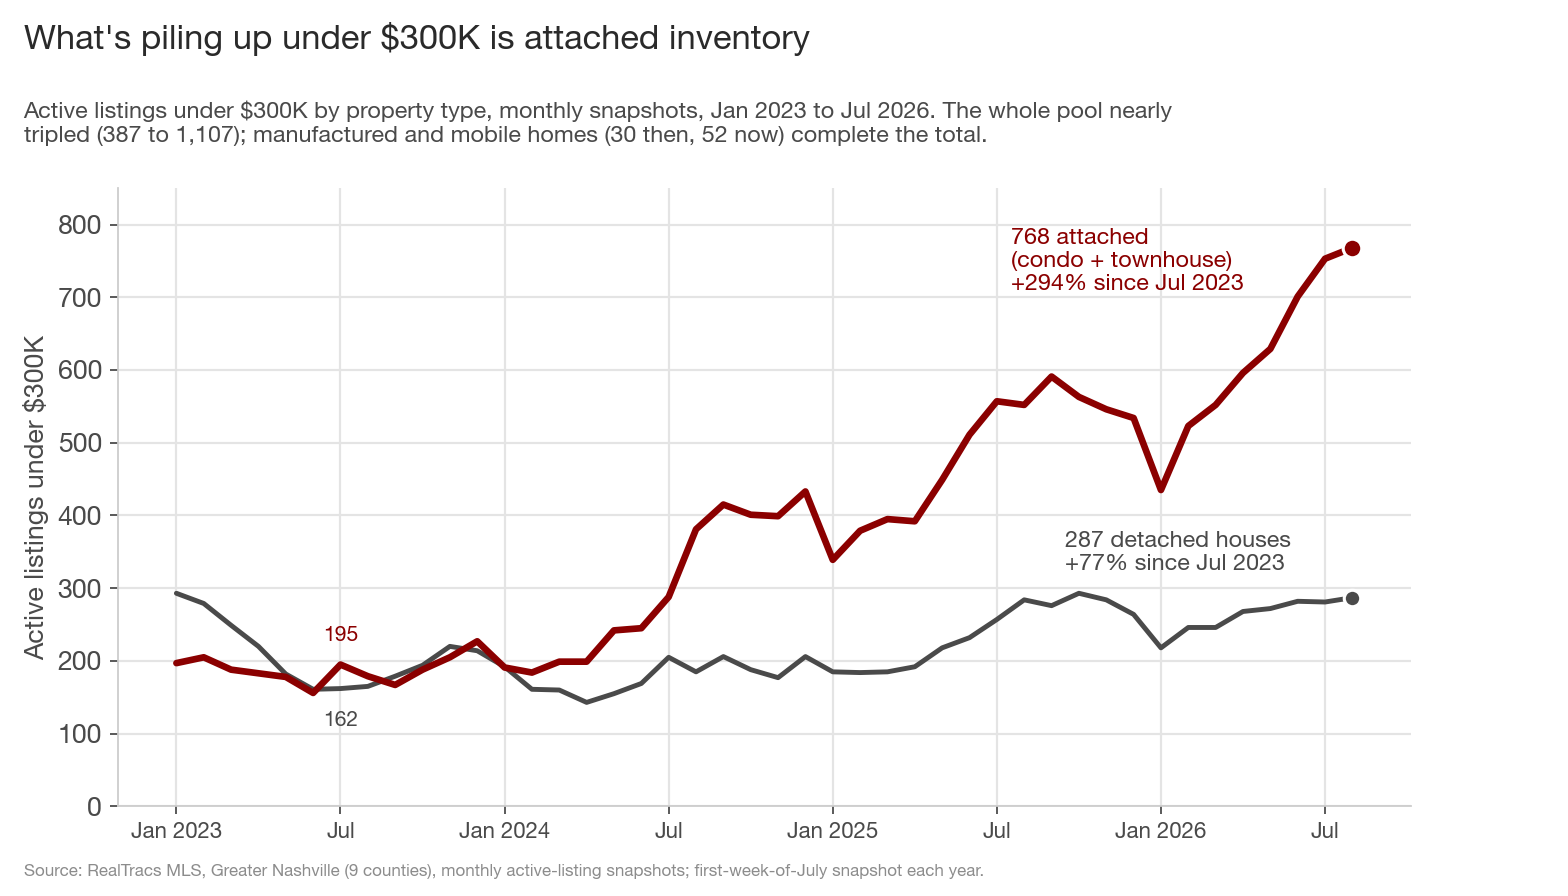
Now flip from what sells to what sits on the market, because that is where the "affordability is improving" impression comes from. The under-$300K active pool has nearly tripled since July 2023, from 387 listings to 1,107 at the July 3 snapshot. Break the growth out by type and it is overwhelmingly attached product: active condo listings went from 61 to 307 (+403%), townhouses from 134 to 461 (+244%), while detached houses went from 162 to 287 (+77%). Three years ago 42% of under-$300K listings were detached houses; today it is 26%, one listing in four.
This is the low-priced end of the condo glut I have been tracking all spring. The metro condo market crossed into buyer's-market supply back in May, and condo actives are up 23% YoY market-wide vs +5.8% for single-family; under $300K, condo actives are up 28% at the July snapshots, faster than the condo market overall. So the tier that looks healthiest on an inventory dashboard, the same tier whose growth pulls the metro median list price down, is mostly small attached units accumulating.
5. Under $300K, houses sell in about 2 months while condos sit for 8
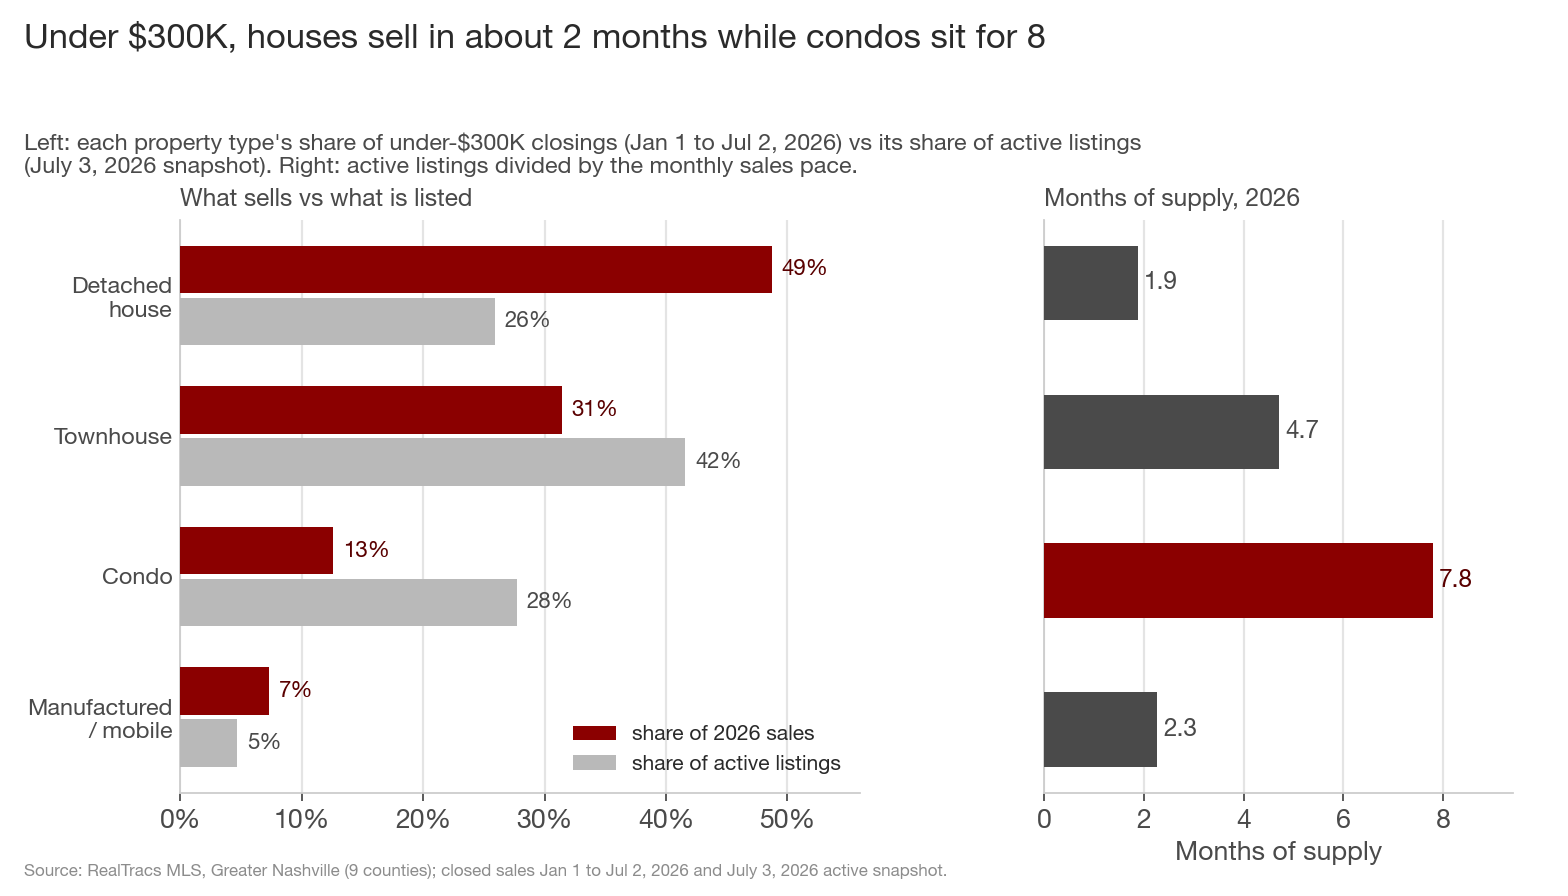
Put the two lenses side by side, what sold (a first-half flow) vs what is listed (a point-in-time stock), and the mismatch is the story. Detached houses are 49% of 2026's under-$300K sales but only 26% of its listings. Condos are the mirror image: 13% of sales, 28% of listings, sitting on the shelf at more than twice the rate they sell. Townhouses lean the same way, 31% of sales vs 42% of listings.
Convert that to months of supply (active listings divided by the monthly sales pace) and the affordable market splits in two. Detached houses under $300K: 1.9 months of supply, up from a scarcity-level 0.8 months in mid-2023 but still firmly seller's-market fast. Townhouses: 4.7 months, balanced tipping soft. Condos: 7.8 months, deep in buyer's-market territory. The cheap detached house remains genuinely scarce and still clears in roughly two months, while the product stacking up around it waits five to eight.
This is why the under-$300K shelf looks so different depending on who is looking. A dashboard sees 1,107 affordable listings, up 26% on the year, and calls it improving affordability. A buyer who specifically wants a detached house sees 287 of them across nine counties, competing with everyone else who wants the same scarce thing, and the rest of the shelf is a different product with different fees, different space, and a very different resale picture right now.
What this adds up to
- Under-$300K is Greater Nashville's fastest-growing price tier: active listings +26.4% YoY and +94.8% vs 2024, about three times the market pace.
- The growth is attached product: since July 2023, condo actives are +403% and townhouses +244%, vs +77% for detached houses. Only 1 in 4 under-$300K listings is a detached house now, down from about 2 in 5 three years ago.
- The affordable detached house barely exists as a flow anymore: first-half sales fell from 6,775 (2020) to 914 (2026), down 87%, and have held near 900 for three years.
- The houses that do list still clear at 1.9 months of supply, while under-$300K condos sit at 7.8.
- Nashville's all-property median asking price is down 1.5% while the single-family median is exactly flat at $600K. The dip measures a cheapening mix more than cheapening homes.
Which brings it back to the Realtor.com headline. The 2.5% national decline is real, and some of it is surely genuine price cutting, concentrated in the soft West and South markets their own report points to. But Nashville shows how much of a falling median can be composition: our affordable tier is expanding at three times market pace while containing fewer and fewer of the homes affordability-minded buyers actually mean. Nationally I can only offer the mix shift as a hypothesis worth checking; locally the arithmetic is settled. A buyer open to an attached home under $300K genuinely does have improving options and leverage here: more listings, longer sits, sellers with 7.8 months of competition behind them. A buyer holding out for a detached house under $300K is shopping a 287-listing market that clears in about two months, and the falling blended median has done nothing to widen their menu.
What to watch over the next 60 days: whether under-$300K detached sales hold their roughly-900-per-half-year floor, which is about 150 a month (I expect they do); whether under-$300K condo months of supply pushes past 9 by Labor Day (7.8 at the July snapshot); and whether the under-$300K share of all active listings crosses 10% (9.2% now, 6.9% two years ago). If detached months of supply instead jumps toward 4 while the condo number falls, the two-market split this post describes is breaking down and I will revisit it.
Data through the week ending 07-04-2026 for weekly inventory, price bands, and median list prices; closed-sale windows are January 1 to July 2 of each year; property-type snapshots of active listings are first-week-of-July, with the 2026 snapshot on July 3 (weekly band counts and the property-type snapshot are pulled on adjacent days, so tier totals can differ by a few listings). Greater Nashville, 9 counties: Davidson, Williamson, Rutherford, Wilson, Sumner, Maury, Dickson, Cheatham, Robertson. Detached house = site-built, zero-lot-line, and detached-HPR listings; townhouse includes attached-HPR and townhouse condos; fat-finger and non-residential records filtered. Sources: RealTracs MLS; national figures from Realtor.com's June 2026 housing report.