The single-family number set a record this week: the median detached home that closed across Greater Nashville sold for $538,000, the highest weekly reading in the three-plus years of data I track. Inside Nashville proper, the typical Davidson County house sold for $550,000 — also a high. By the sticker-price meter, single-family homes have never been more expensive here.
Here's the part that doesn't fit the headline. Over those same twelve months, the price of an actual square foot of a Nashville single-family home barely moved — up 0.8% metro-wide, and up 0.7% in Davidson, where it's still below the high it set back in 2024. A record median price sitting on top of flat per-foot value is the signature of one thing, and it isn't broad appreciation: it's mix. The single-family homes that are selling got bigger and pricier; the value of the square footage inside them did not.
And there's a second reason I'm keeping single-family and condos in separate columns this week: they are no longer telling the same story. While detached homes set records, condos went the other way — no record, prices flat to falling, and inventory piling up. This post walks the single-family record first, then handles condos on their own.
1. The single-family record is real: $538,000
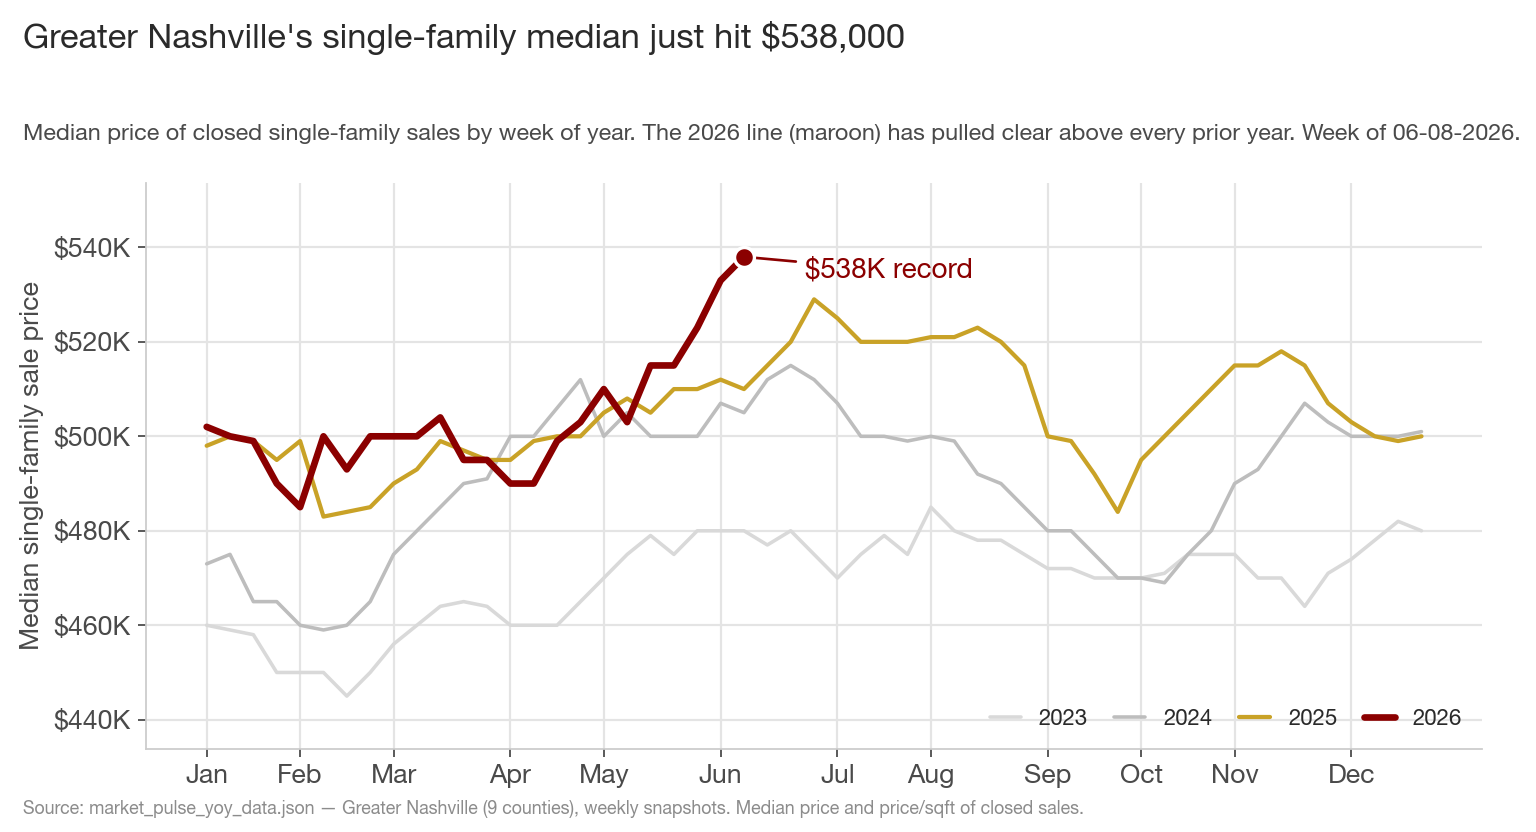
There's no asterisk on the record itself. The metro-wide median single-family closed price printed $538,000 this week — the single highest weekly reading in the data, up 5.5% from $510,000 a year ago and 6.5% above two Junes back. The chart overlays each year by calendar week, and the 2026 line (maroon) has pulled clear above every prior year through the spring. Davidson County's single-family median is $550,000 (+4.8% year-over-year), its own high.
June is always the seasonal peak — summer skews sales toward larger family homes, so the median runs hottest now. But this clears every prior week on file, including the peaks of past Junes. On the single-family sticker-price meter, the market is making new highs.
One honest boundary: my weekly series starts in early 2023, so "record" means the highest in 3½ years of data, not a literal all-time high reaching back to the 2022 cycle peak. The within-record story below holds regardless.
2. The price of a square foot barely moved
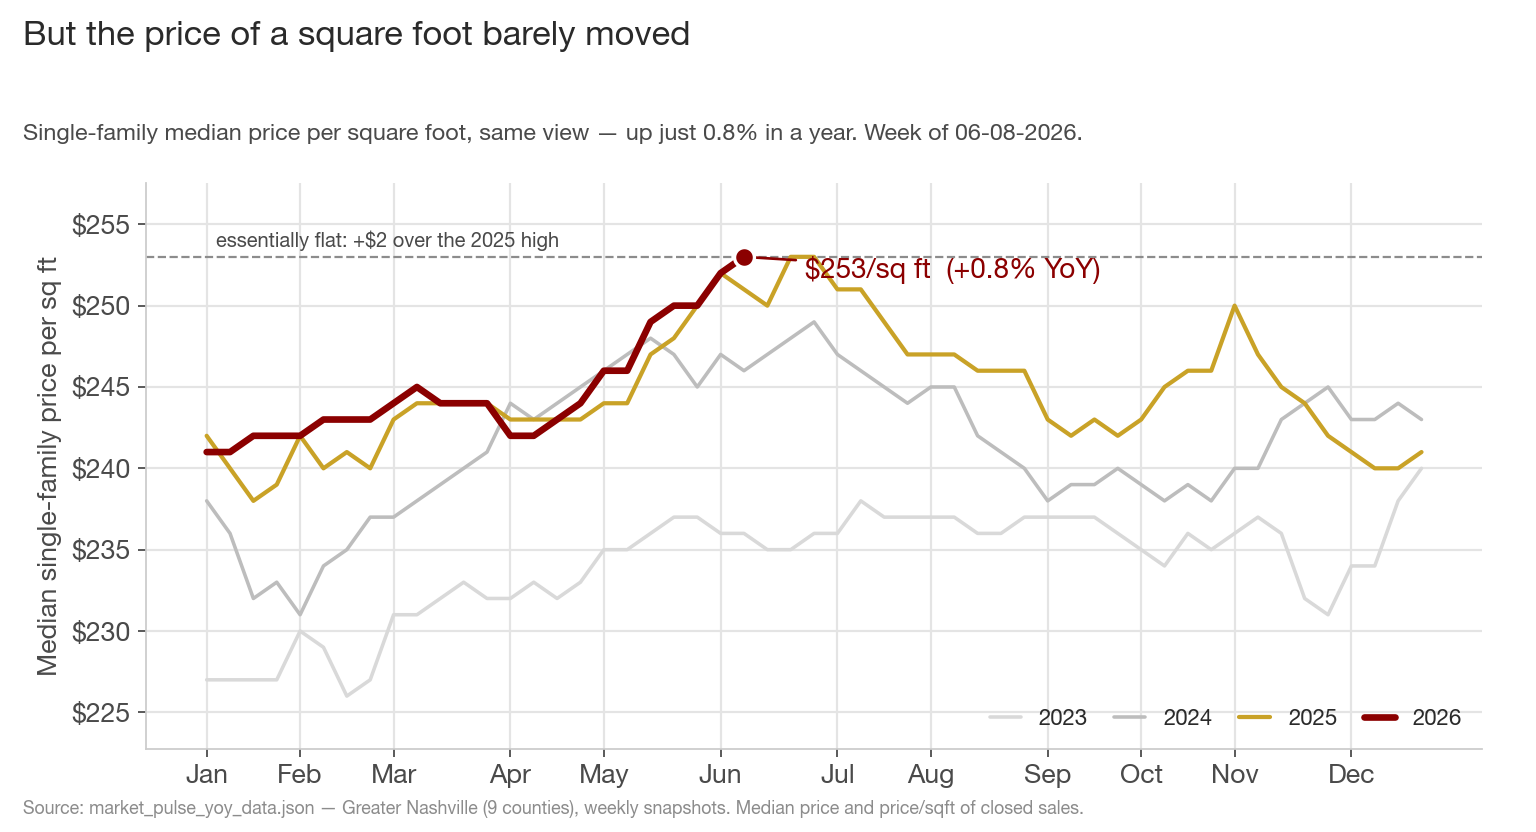
Now the same chart, same overlay — but for single-family price per square foot, the cleaner read on whether the underlying real estate actually got more valuable. And the 2026 line tells a completely different story from Section 1. It isn't pulling away from the pack; it's running flat along the top, essentially tied with 2025: metro single-family price per square foot is $253, up a rounding-error 0.8% in a year — a new high by about two dollars. In Davidson the per-foot figure is $288, up just 0.7%, and still below the $295 it touched in 2024.
This is the tell. If the record median in Section 1 were powered by genuine appreciation — every house worth meaningfully more than last year — per-foot value would be climbing alongside it. It's basically standing still. The two meters have come apart, and when they do, the median is being moved by what's selling, not by how much a given house is worth.
3. Why: the single-family mix tilted up-market
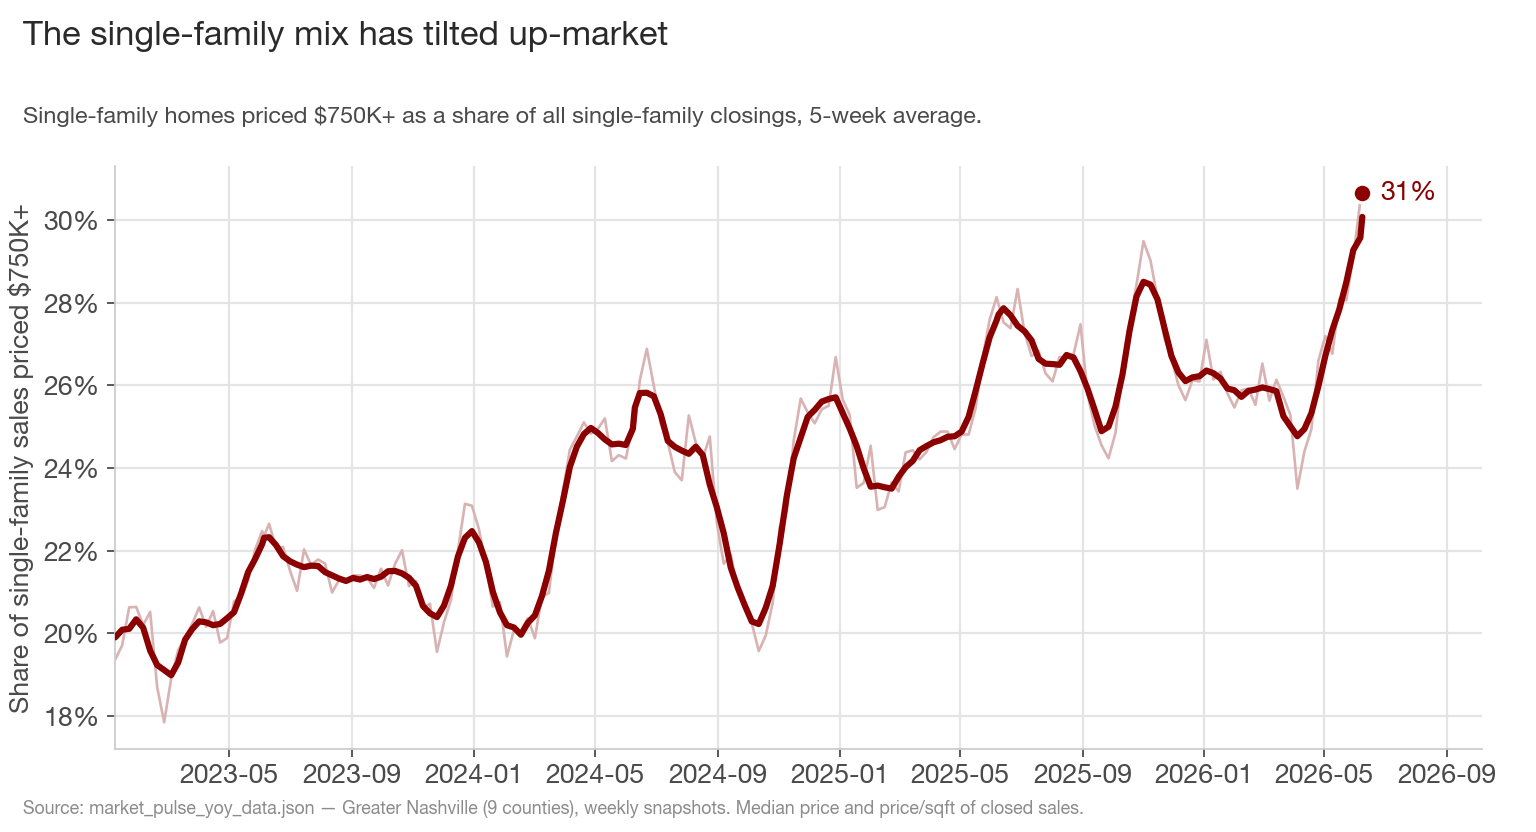
Here's the mechanism. When the share of expensive homes in the sales pool rises, the median climbs even if no individual house got more expensive per foot — you're just averaging over a more expensive set of homes. And that share has climbed. Single-family homes priced $750,000 and up were 28.0% of all SFH closings a year ago; this week they're 30.7% — nearly three percentage points more of the market. In Davidson the shift is bigger: 27.8% to 31.6%. The $1M+ slice rose from 16.7% to 18.2% metro-wide.
You can see it in size, too. Divide median price by median price-per-foot and you get a rough implied size of the typical home selling — and it grew, from about 2,032 to 2,126 square feet metro-wide, a 4.7% jump in the size of the median single-family home sold (and +4.0% in Davidson). Bigger homes, more of them at the top: the median rises, the per-foot number doesn't. The record is, in large part, a size-and-luxury story wearing a market-wide headline.
4. Condos are telling the opposite story
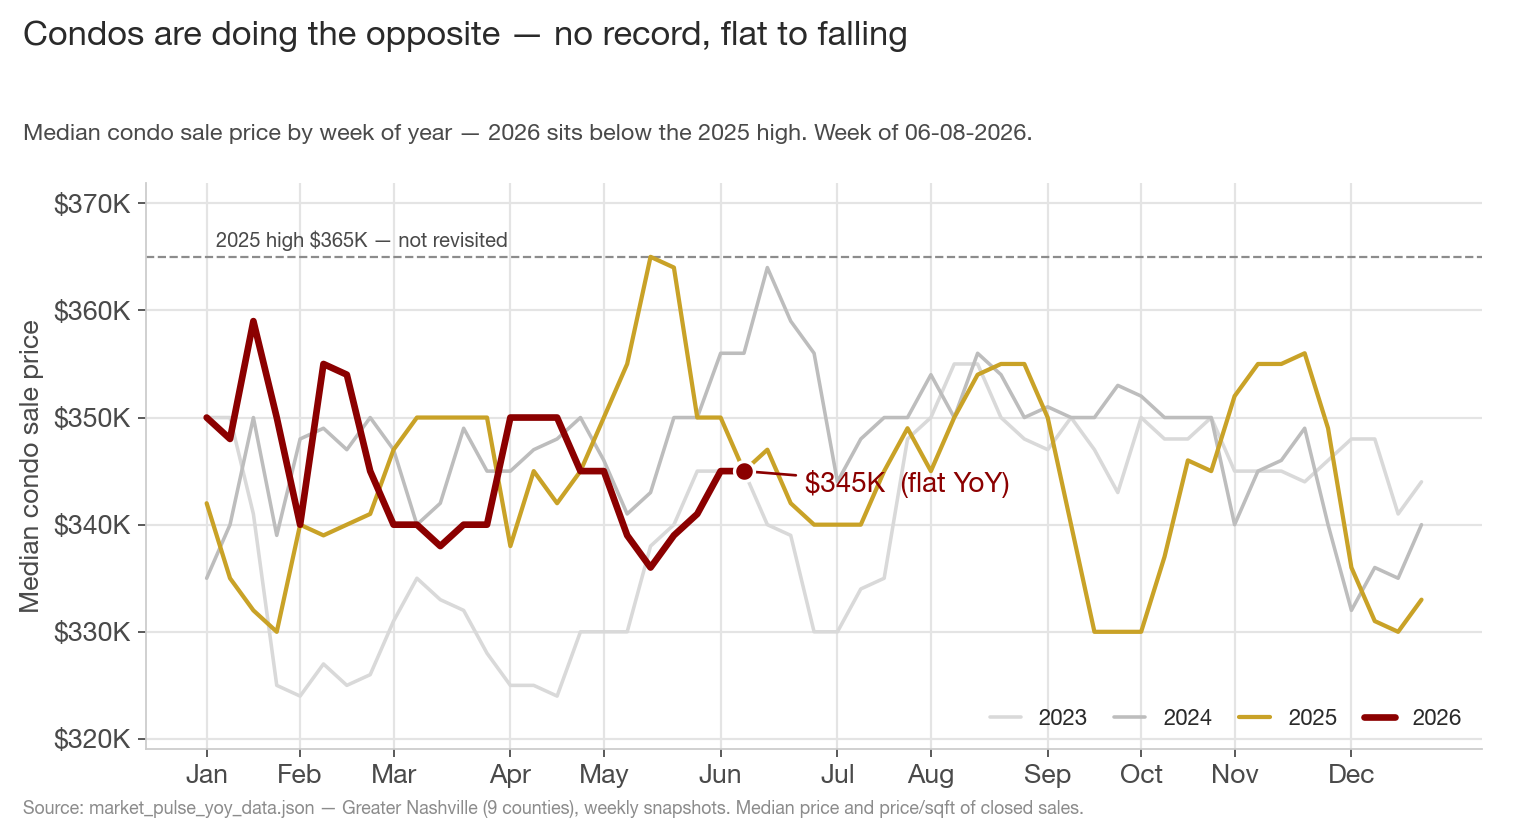
Now condos, on their own — because blending them into a single "all-property" median would have hidden exactly what's interesting. There is no record here. The metro condo median is $345,000, flat (0.0%) against a year ago and down 3.1% over two years; in Davidson it's $350,000, down 6.7% year-over-year. The 2026 line sits well below the $365,000 high it set in spring 2025.
And on a per-foot basis — the meter that single-family homes held flat — condos are outright falling: metro condo price per square foot is $223, down 3.0%, and Davidson condo per-foot is $234, down 12.4% from a year ago, near the bottom of the entire three-year series. The supply side explains the pressure: condo active listings are up 17.4% year-over-year, supply sits at 5.4 months (past the four-month line that marks a buyer's market), and closings are up just 1.9%. Notably, condos are selling bigger units too (implied size up 3–6%), yet the median still can't make headway — per-foot value is falling fast enough to swamp the mix. The same force lifting the single-family median is, in the condo market, being overwhelmed by genuine price softness.
5. Two markets, side by side
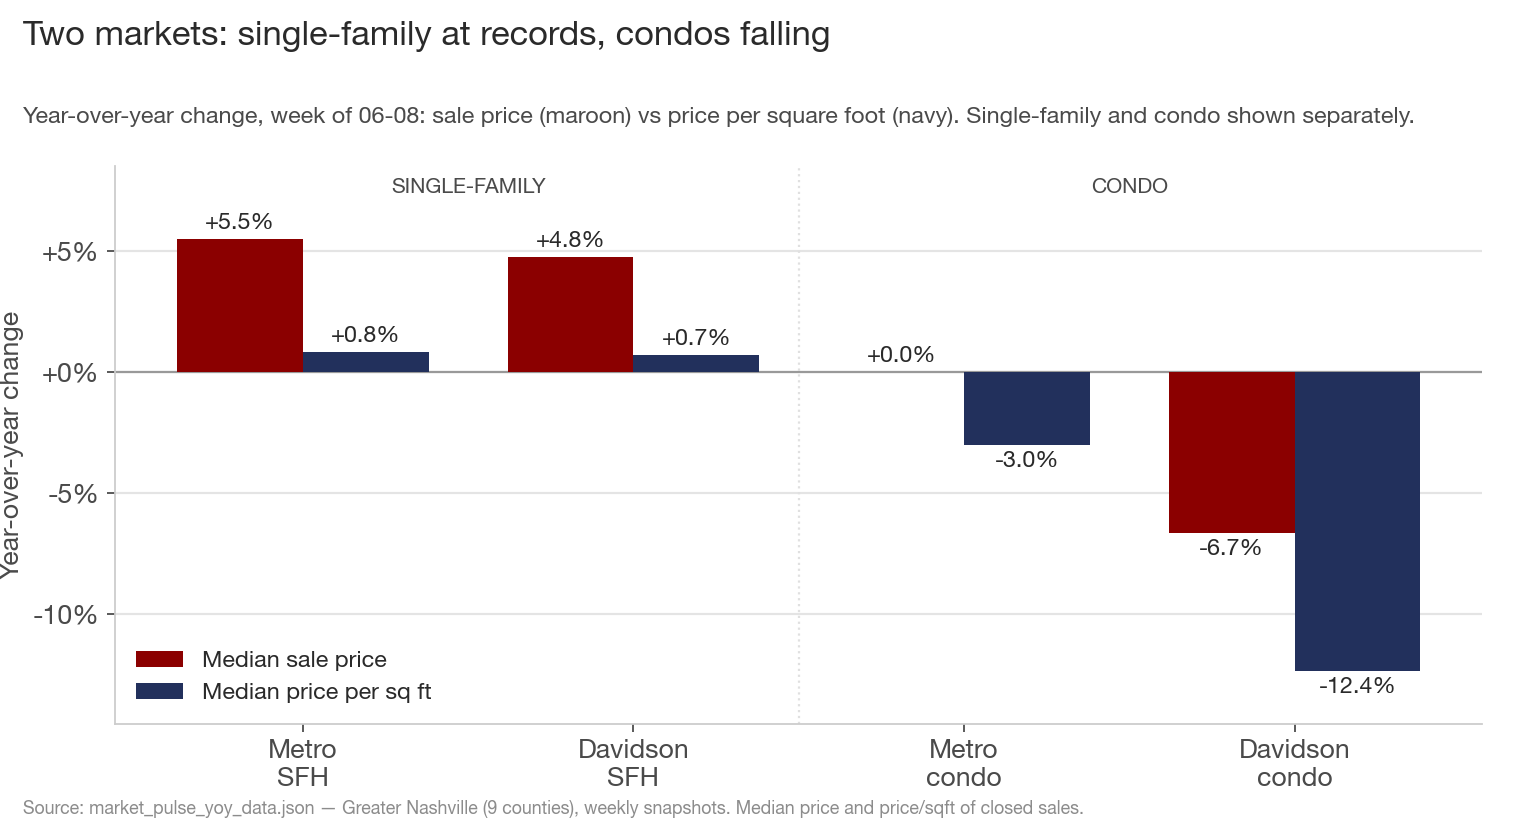
Put the two property types next to each other — separately, never blended — and the split is the clearest it's been. The maroon bars are the year-over-year change in median sale price; the navy bars are the change in price per square foot:
- Metro single-family: price +5.5%, per foot +0.8%
- Davidson single-family: price +4.8%, per foot +0.7%
- Metro condo: price 0.0%, per foot −3.0%
- Davidson condo: price −6.7%, per foot −12.4%
On the single-family side, every maroon bar towers over its navy partner — record sticker prices, flat per-foot value. On the condo side, both bars are at or below zero — falling prices and falling per-foot value. This is why "the Nashville median hit a record" needs a property-type label before it means anything: it's a single-family record, built largely on composition, sitting next to a condo market that's actively repricing down.
What this adds up to
- The single-family record is genuine but narrow. The metro SFH median hit $538,000 and Davidson $550,000 — real highs in the data.
- Per-foot value barely moved. Single-family price per square foot is up just 0.8% metro and 0.7% in Davidson, where it's still below its 2024 peak.
- The single-family gap is composition, not appreciation. Homes $750K+ climbed from 28.0% to 30.7% of SFH closings, and the typical single-family home sold is about 4.7% bigger than a year ago.
- Condos are the opposite market. No record, median flat metro-wide and down 6.7% in Davidson, per-foot down 3–12%, and inventory up 17.4% into buyer's-market territory.
For single-family buyers, the "record prices!" headline overstates how much you've been priced out: on a per-square-foot basis — the number that tracks whether a given house actually got more expensive — detached Nashville is about flat with a year ago. The record is mostly about which homes are trading. For single-family sellers, the flip side is the warning: if your home isn't in the larger, higher-end slice doing the heavy lifting, the metro record isn't your record — per-foot is where your number lives, and per-foot is flat. For condo owners and buyers, it's a different market entirely — prices and per-foot value are both declining while supply builds, and that's a buyer's negotiating position, not a seller's record.
Here's the falsifiable part to watch over the next 30–60 days. If the single-family record is mix-driven rather than appreciation-driven, two things should follow: single-family per-foot value should stay roughly flat even as the median holds its record (if SFH price-per-foot instead breaks decisively higher, real appreciation is back and I'm wrong); and as the seasonal high-end mix cools into the fall and the $750K+ share recedes from 31%, the single-family median should ease back off its record while per-foot barely moves. On the condo side, the tell is per-foot: with supply at 5.4 months and climbing, expect condo price-per-square-foot to keep grinding lower until inventory growth stalls. The two markets have decoupled — watch whether they stay that way.
Data through the week ending June 8, 2026, Greater Nashville (9 counties: Davidson, Williamson, Rutherford, Wilson, Sumner, Maury, Dickson, Cheatham, Robertson). Figures are the median sale price and median sale price per square foot of closed sales, by weekly snapshot, reported separately for single-family (detached) and condo/attached property; "record" means the highest weekly reading in the series, which begins in early 2023, not a literal all-time high. "Implied size" divides the median price by the median price per square foot and is approximate, being a ratio of two separate medians. Share-of-market and size figures compare the latest week to the same week of 2025. Source: market_pulse_yoy_data.json.