Three days ago I wrote about the Nashville luxury melt-up — $2M+ pending contracts running +72% versus the same week last year, tracking the NASDAQ all-time-high cluster at roughly 2.5× the amplitude. This post is the other half of that picture. The condo market in the same metro just hit 5.2 months of supply — five-plus months is the textbook buyer's-market line. SFH supply, the same week, is 3.1 months. Same metro, same week, two different markets.
The condo story is broader than supply. Median condo sales prices are down 6.4% year over year. Active condo inventory is growing more than 3× faster than SFH inventory. And in the closing data from the last six weeks, I can pull individual addresses where sellers walked away with six-figure losses. This post lays out the supply crossing, the inventory split, the price erosion, where it's concentrated geographically, and three specific 2026 sales that show the markdowns are landing at the closing table — not just on the listing sheet.
1. Condo months-of-supply crossed 5 — the buyer's-market line
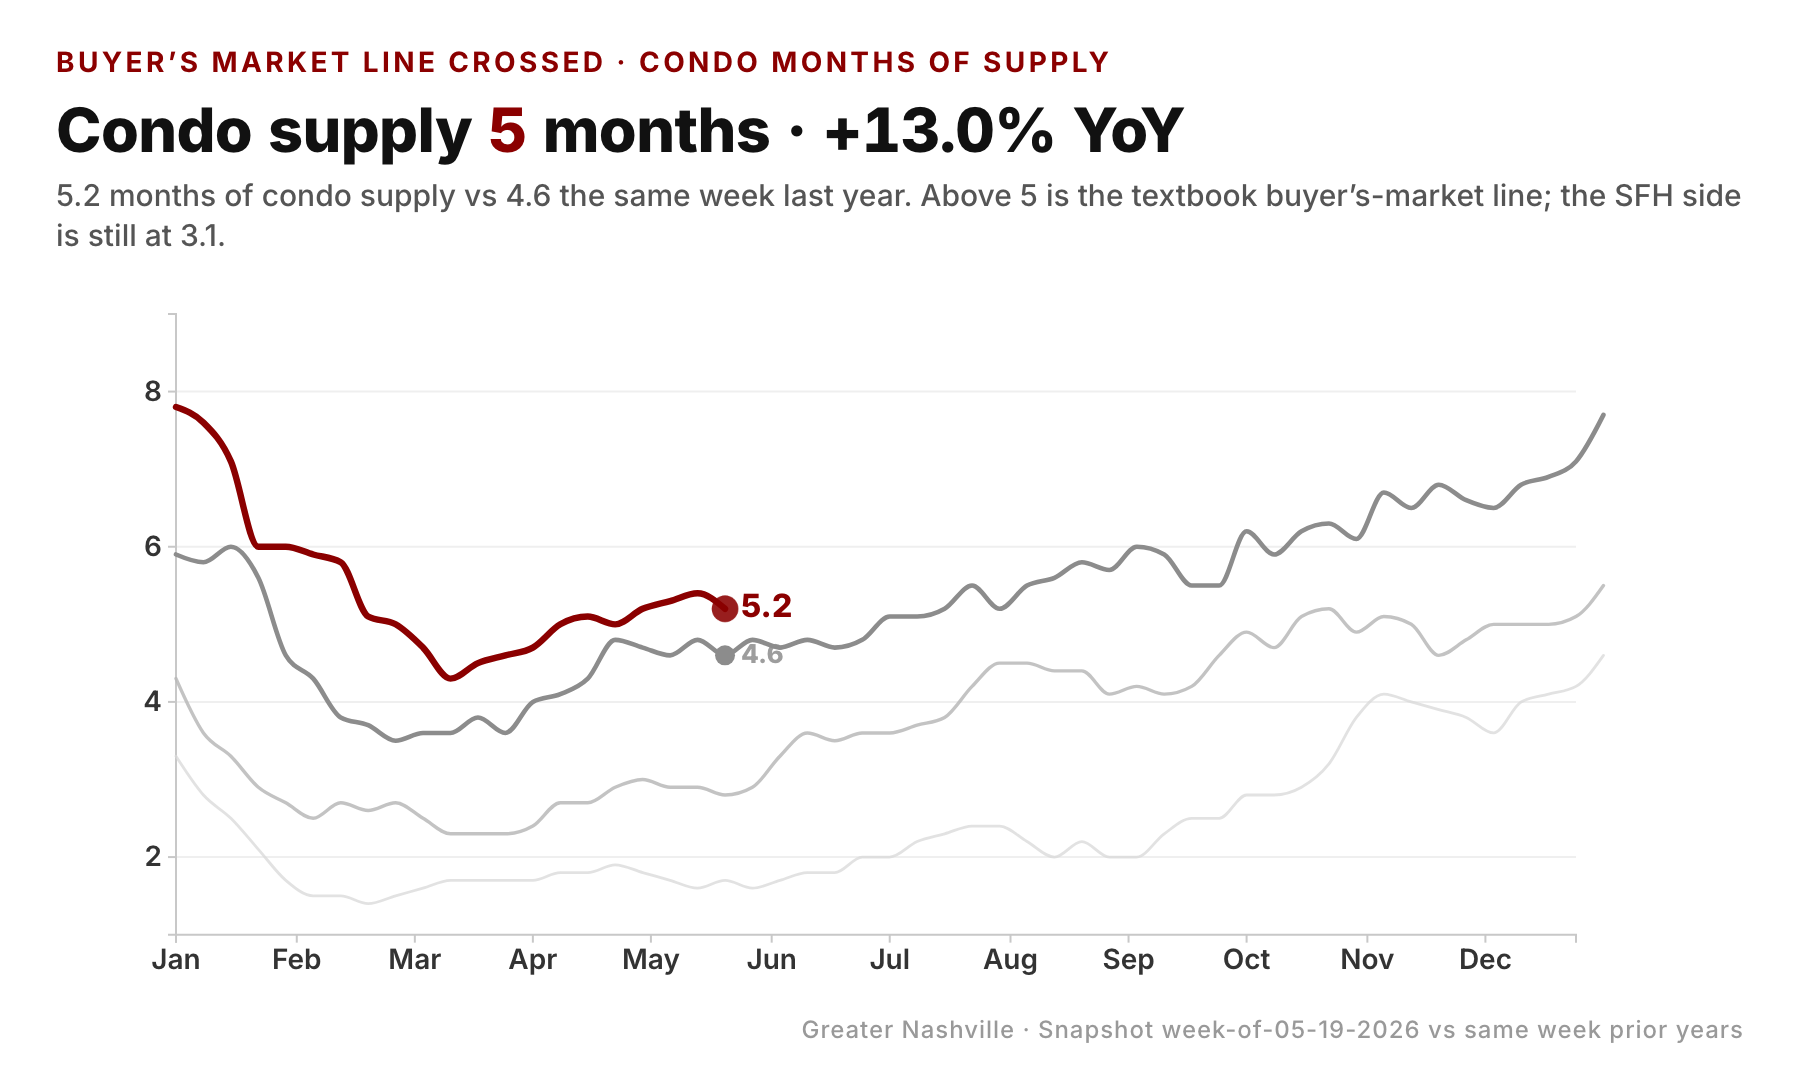
The condo supply ratio — months of inventory at the current sales pace — is 5.2 as of the week ending 05-19-2026. Above 4 is balanced; above 5 is buyer's-market territory. The progression by year, same calendar week:
- 2023: 1.7 months (extreme seller's market)
- 2024: 2.8 months
- 2025: 4.6 months
- 2026: 5.2 months
This is not a sudden break — it's a four-year escalator. Supply gets roughly 1 to 1.5 months longer every year on this week. If the slope holds, the same week of 2027 looks like 6+ months — what a Realtors Association would call a strong buyer's market with active downward price pressure.
For context, the SFH side of the same metro is at 3.1 months. SFH is still a seller's market by the same yardstick. The condo divergence is product-specific, not metro-wide.
2. The structural reason: condo inventory is growing 3× faster than SFH
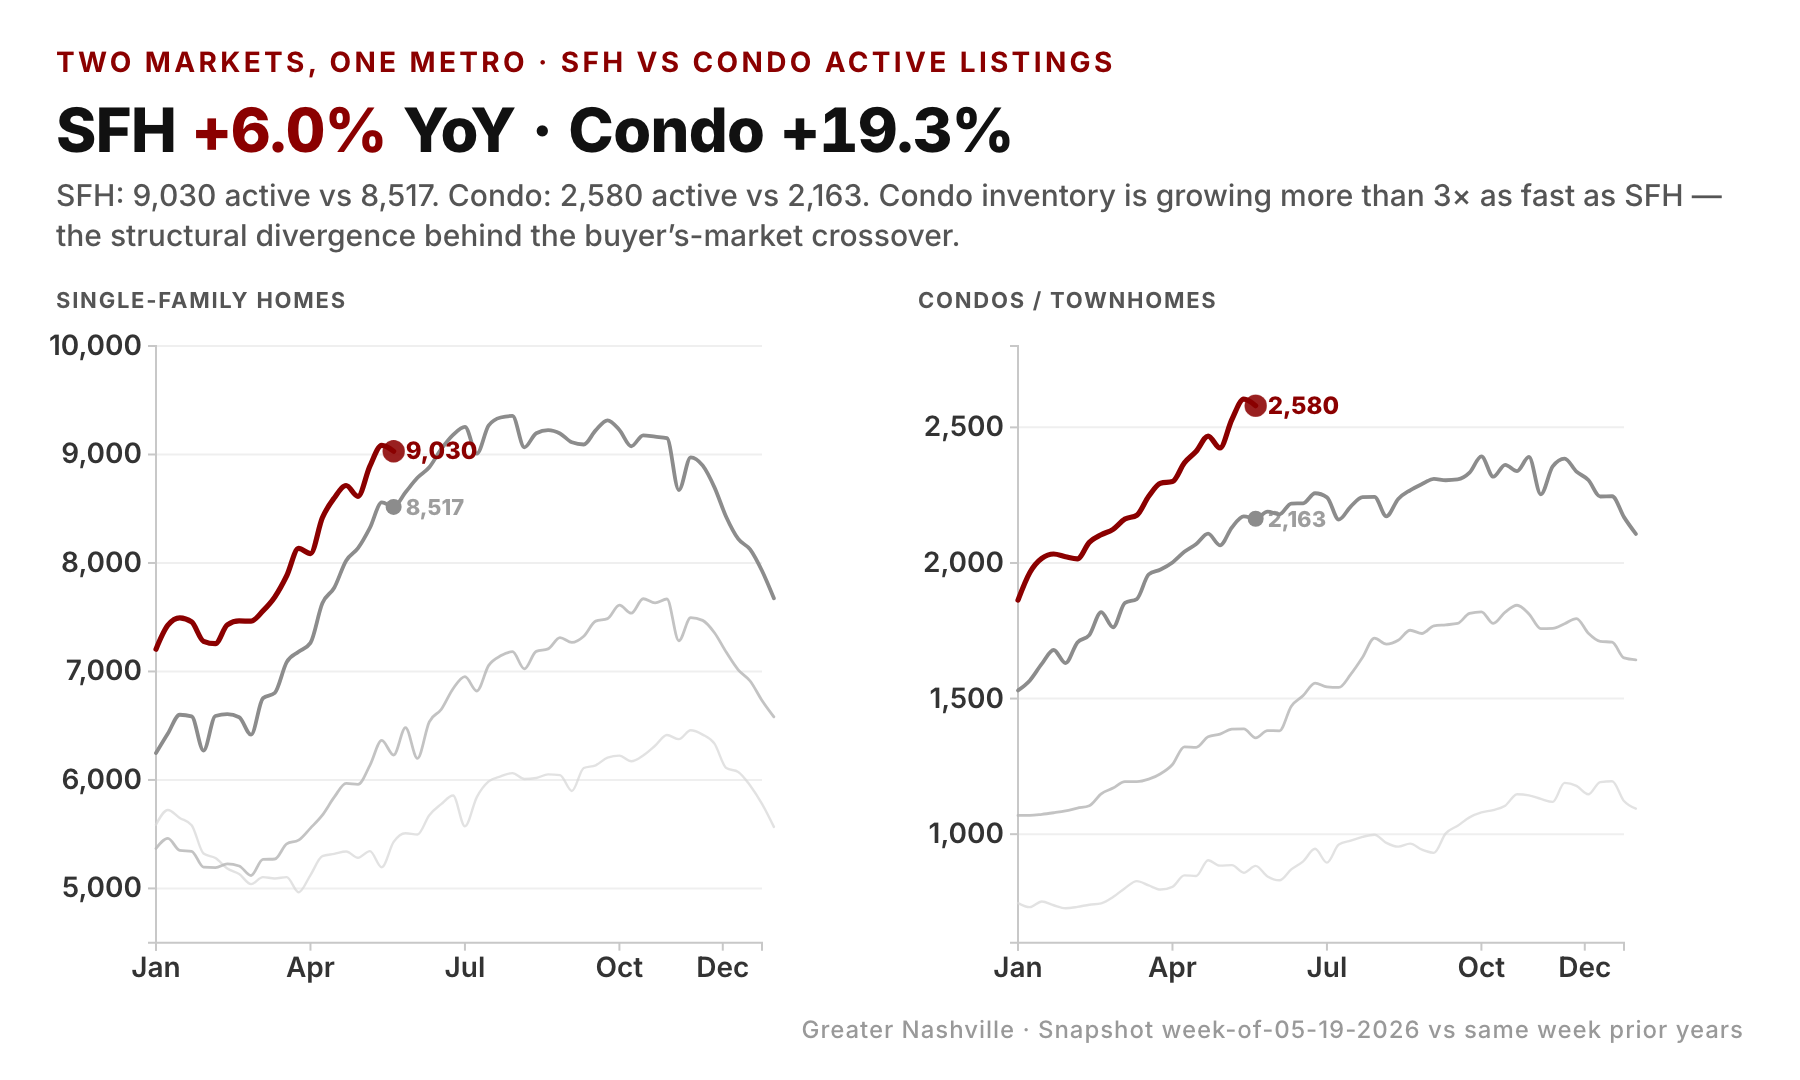
Active inventory year over year, this week:
- SFH: +6.0% (9,030 vs 8,517 same week 2025)
- Condo: +19.3% (2,580 vs 2,163 same week 2025)
The gap is 13.3 percentage points. Four weeks ago it was 3.5. The widening is not a one-week artifact — every week of the last eight has the gap bigger than the week before:
| Week ending | SFH active YoY | Condo active YoY | Gap |
|---|---|---|---|
| 4/04 | +11.3% | +14.9% | +3.5pp |
| 4/11 | +10.3% | +16.1% | +5.8pp |
| 4/25 | +8.6% | +17.1% | +8.4pp |
| 5/09 | +6.8% | +18.7% | +11.8pp |
| 5/19 | +6.0% | +19.3% | +13.3pp |
Two forces drive this. First, mortgage rates near 7% bite condos harder than SFH because the typical condo buyer skews toward lower household income and is more sensitive to monthly payment math. Second, condo HOA dues plus rising insurance and property tax create a carrying cost problem that SFH owners don't share to the same degree — and carrying cost erodes affordability faster than list price falls.
The result: SFH sellers see offers within weeks. Condo sellers watch inventory pile up around them.
3. The markdowns are landing at the closing table
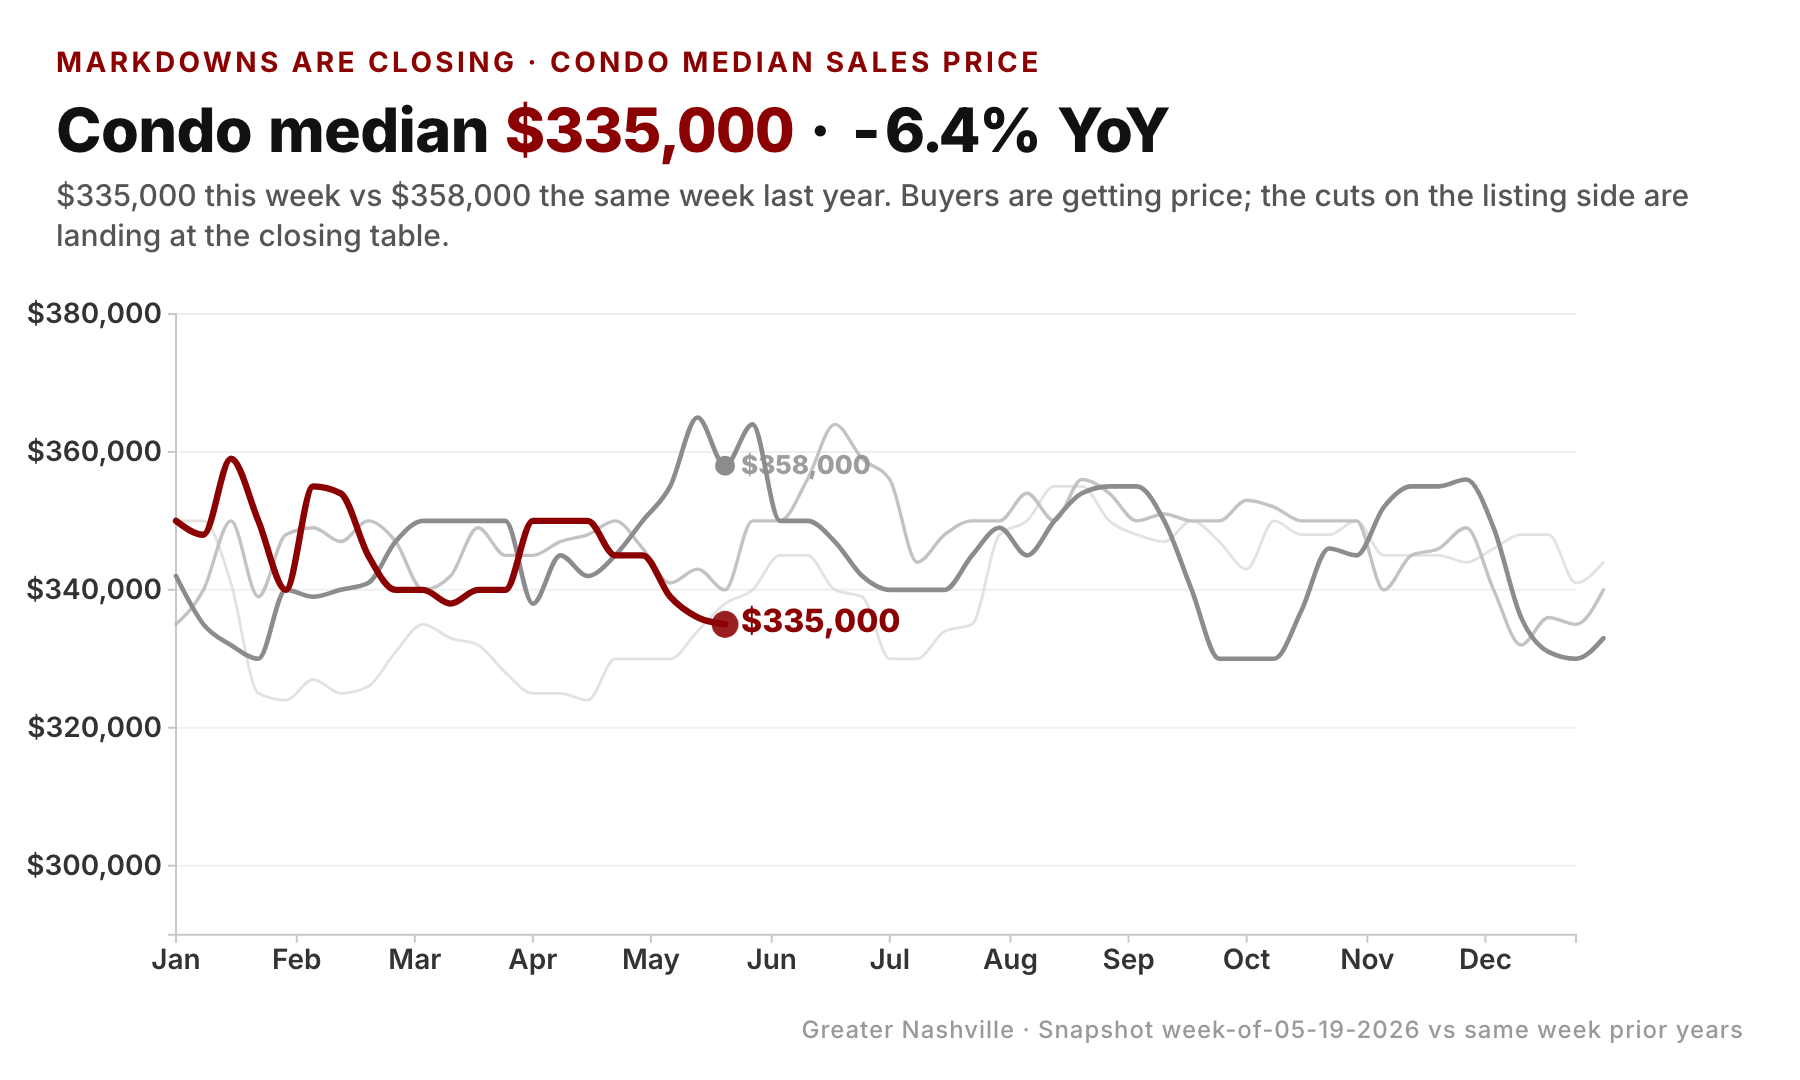
Median condo sales price this week: $335,000. Same week last year: $358,000. That's -6.4% YoY. And it's not a one-week blip — the last four weeks of YoY condo medians read -1.4%, -4.5%, -7.9%, -6.4%. The trend is getting worse, not snapping back.
This is the metric I watch most closely because it isolates closed-sale pricing. The price-cut percentage tells you what list prices are doing — and that metric just crossed the 35% threshold for the first time this cycle. The sales-price median tells you what buyers are actually willing to pay. Both have to move together for a market to be genuinely softening. Both are moving.
Three specific 2026 sales pulled from the closed-sale data this week make the abstract concrete:
1030 17th Ave S, Unit 101, Nashville (12 South / Malvern building, built 2023, 3,328 sqft, 4bd/3ba condo) Bought Feb 2023 at $2,450,000. Sold May 6, 2026 at $1,800,000. Loss: $650,000 (-26.5%) over 3.2 years.
The same week the broader $2M+ pending count printed +72% YoY, this $2M+ condo sold for $650K below its 2023 purchase price. The luxury melt-up is not a condo phenomenon. A 4-bedroom condo in 12 South, however nice, cannot ride the wealth-effect wave the way a single-family home in Belle Meade can.
544 Little Channing Way, Nashville (Linden Row townhouse, built 2020, 2,644 sqft) Bought Feb 2022 at $985,000. Sold April 27, 2026 at $845,750. Loss: $139,250 (-14.1%) over 4.2 years.
430 E Bend Dr, Nashville (East Nashville HPR-Detached new-build, built 2022, 2,360 sqft) Bought Oct 2023 at $715,737. Sold May 15, 2026 at $595,000. Loss: $120,737 (-16.9%) over 2.6 years.
Three different price points (~$600K, ~$850K, $1.8M), three different submarkets, three losses recorded in the same six-week window. This is what 5.2 months of supply looks like on the ground — not in an aggregate median, but in the closing statement of someone who bought between 2022 and 2023 and sold last month. (Earlier I asked whether every 2022 buyer is sitting on a loss — the short answer was no, but the condo cohort is the most exposed.)
4. Where condo softness is concentrated
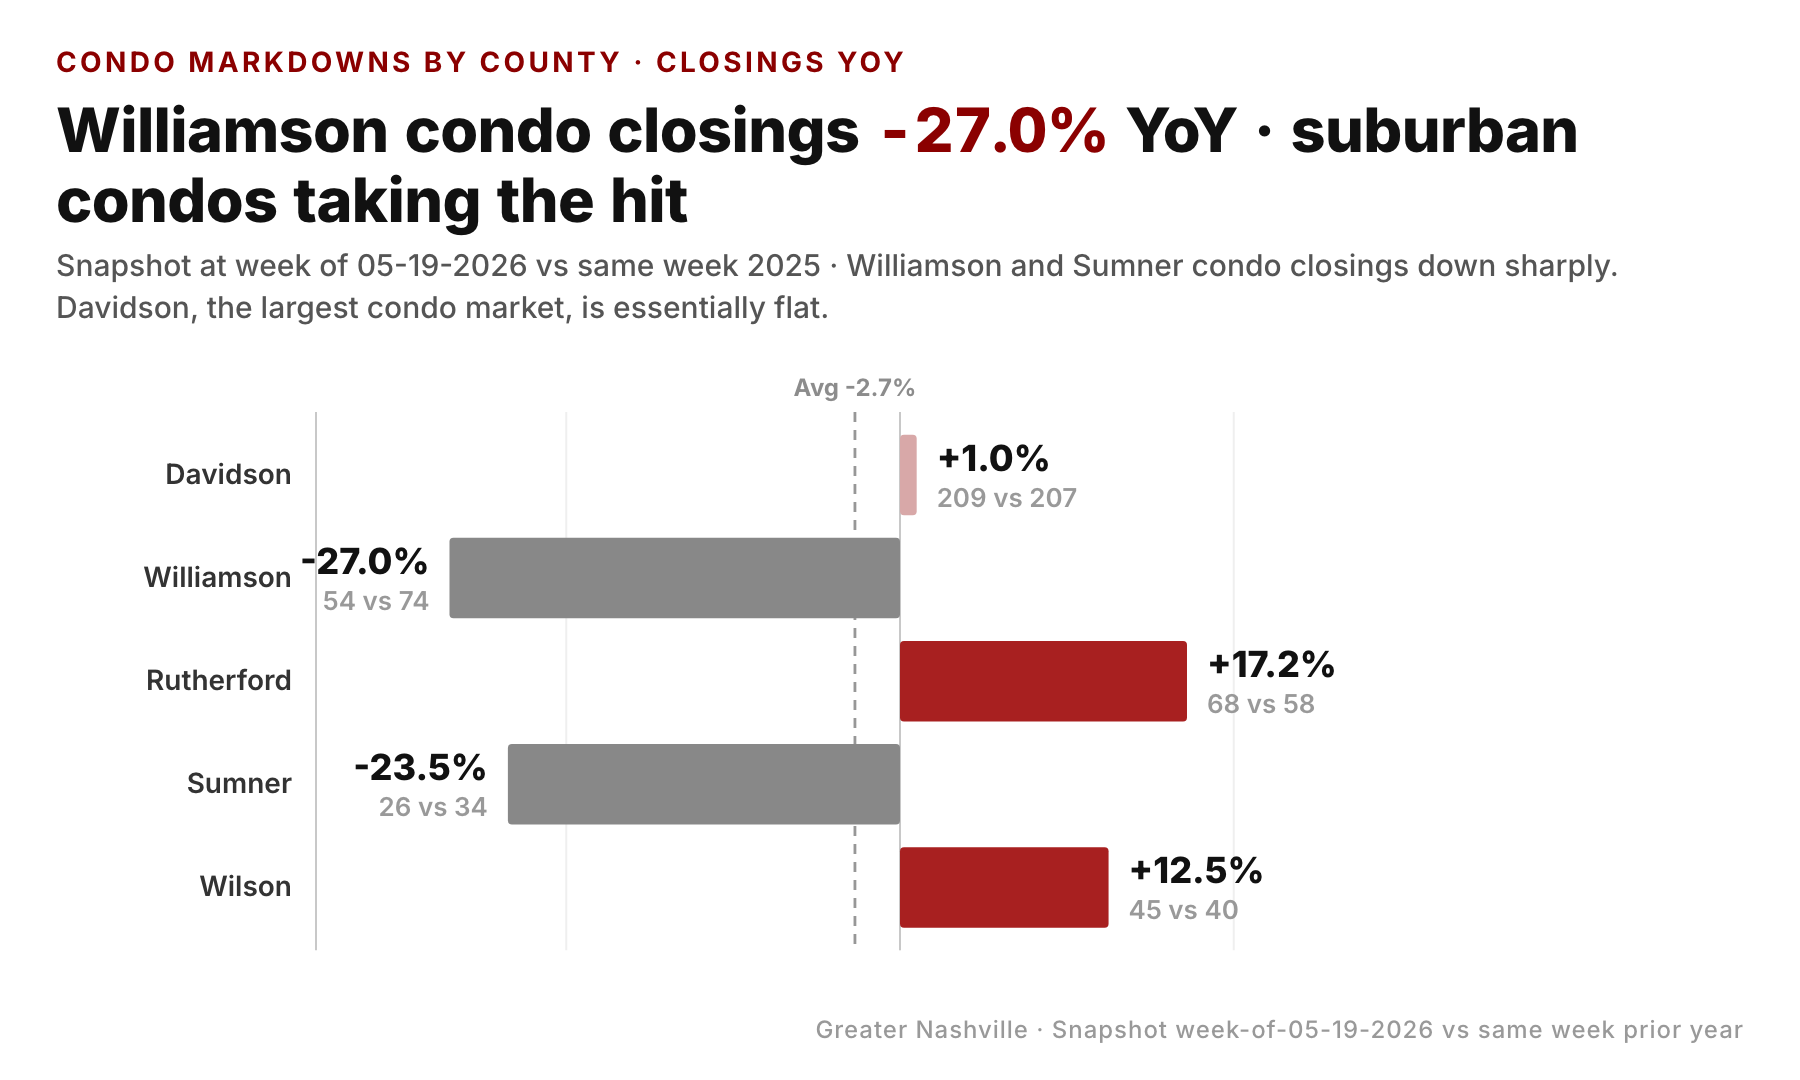
Condo closings YoY, by county, week of 05-19:
- Davidson: +1.0% (209 vs 207) — the largest condo county, essentially flat
- Williamson: -27.0% (54 vs 74)
- Rutherford: +17.2% (68 vs 58)
- Sumner: -23.5% (26 vs 34)
- Wilson: small base, mixed
The geography lines up with the affordability story. Davidson is the only county where condo demand has held up — partly because Davidson condos serve an urban-professional buyer who is less rate-sensitive, often a second-property buyer or downsizer. Williamson and Sumner condos serve a suburban move-up or move-down buyer much more sensitive to monthly carrying cost; that's the buyer whose math broke this year. Rutherford is the outlier — its condo demand is largely new construction at lower price points absorbing buyers priced out of Williamson and Sumner.
A caveat on Sumner: 26 closings is a small base, so any week-to-week move shows large in percentage terms. The directional read is real, but the specific magnitude could revise meaningfully next month.
5. The mirror image: $2M+ contracts +70%, condos down 6%
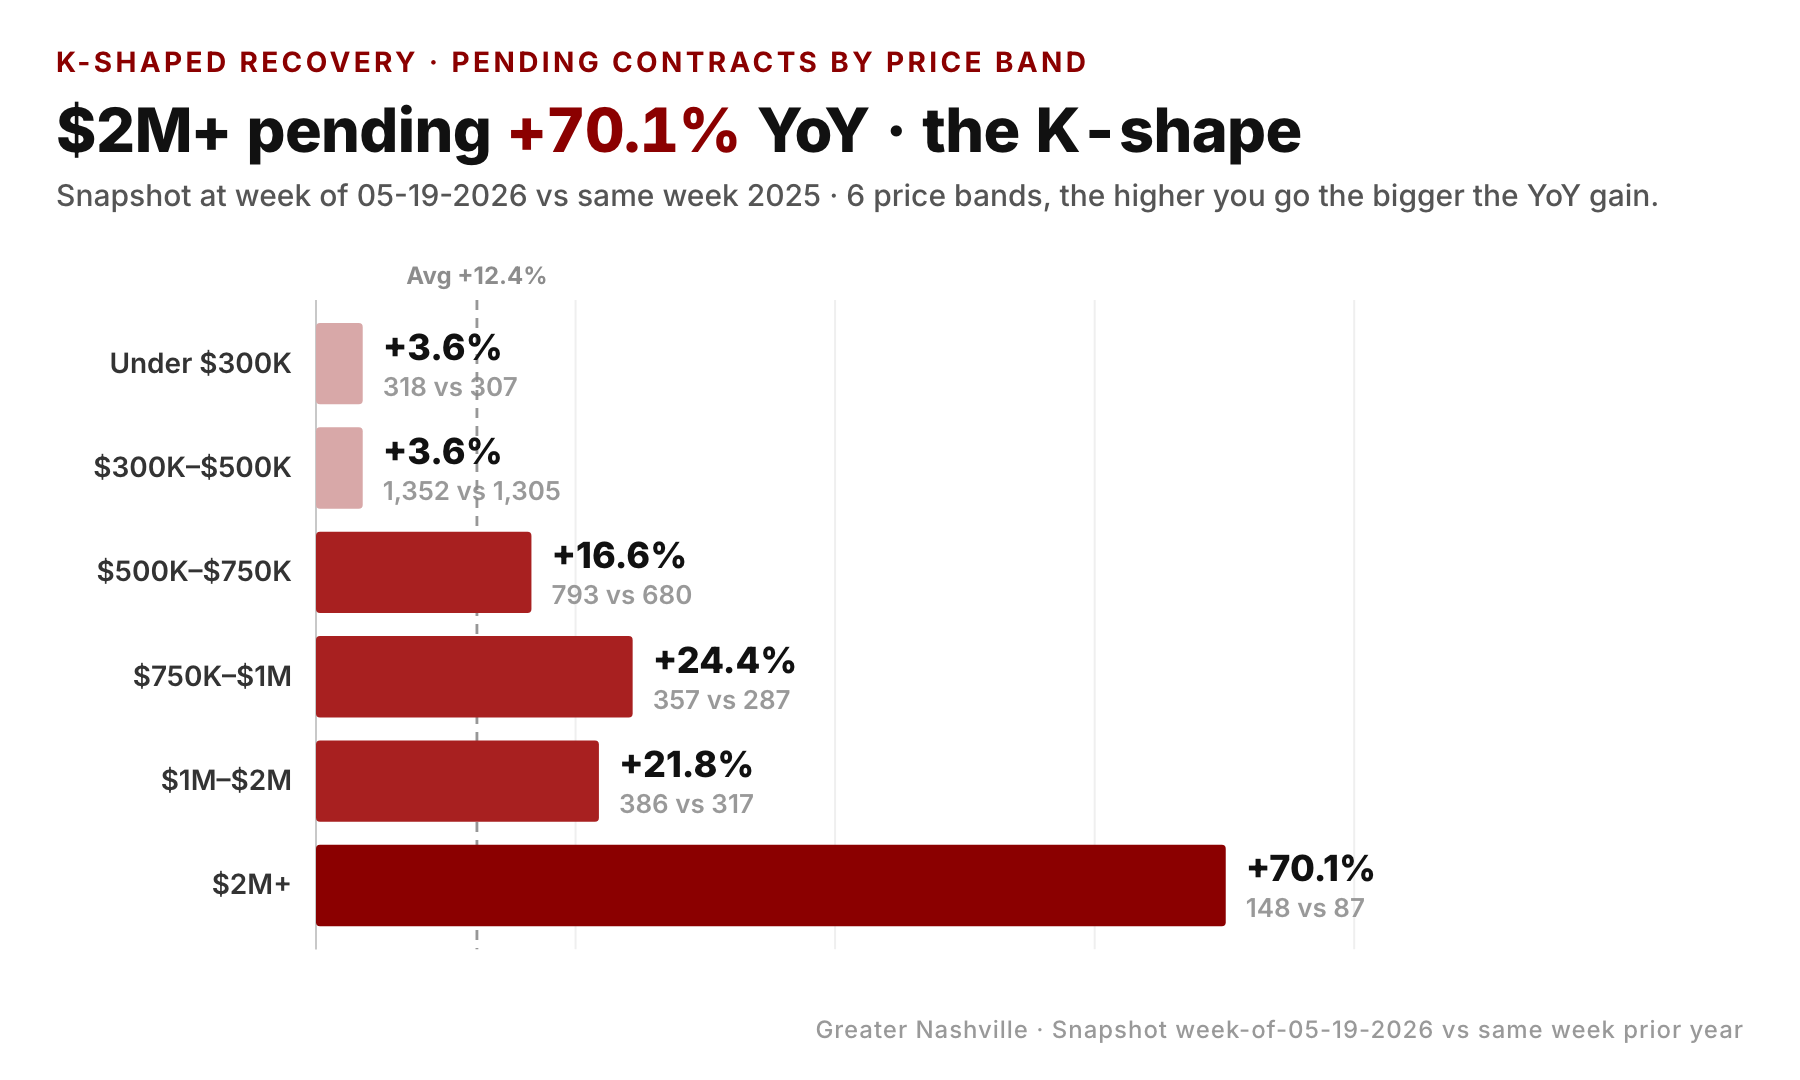
The K-shape in one number: Under $300K pending contracts are +3.6% YoY, $2M+ pending contracts are +70.1% YoY. A 66.5-percentage-point spread between the two ends of the price ladder.
But within each tier, there's a second split: SFH outperforms condo. The $2M+ tier melt-up is overwhelmingly an SFH story — and the closed-sale data above proves it. A $2.45M condo at the top of the market can lose $650K over 3 years while the broader $2M+ pending count puts up its biggest YoY gain in the dataset. That contradiction resolves cleanly when you split SFH from condo. The wealth-effect buyer is buying houses, not condos, even at the top.
For everyone in the middle — buyers priced out of SFH and looking at condos as a cheaper way into the metro — the read is: the cheaper-on-paper option is the more-discounted one for a reason. Carrying cost matters more than purchase price when rates are at 7% and HOA dues keep stair-stepping.
What this adds up to
- Condo months-of-supply hit 5.2 for the week ending 05-19-2026, crossing the buyer's-market line. Year-over-year same week: 1.7 → 2.8 → 4.6 → 5.2 — a clean four-year escalator.
- The SFH/condo active-inventory gap is at 13.3 percentage points and has widened every week of the last eight. SFH is still 3.1 months supply (seller's market); condo at 5.2 months (buyer's market).
- Closing prices are following the listings: median condo sales price is -6.4% YoY, the fourth straight week of negative YoY medians.
- Three closed sales in April and May 2026 — at $1.8M, $846K and $595K — show six-figure losses on properties bought between 2022 and 2023. These are not outliers; they're a window into what 5+ months of supply does to a real seller.
- The luxury melt-up is not a condo story. Even within the $2M+ tier, the SFH side is melting up and the condo side is taking the biggest dollar losses in the dataset.
For buyers: The condo market is the most negotiable it's been since 2019. Cash buyers and rate-insensitive move-down buyers have real leverage at the $400K–$700K tier — list prices already carry cuts, sellers are tiring, and HOA disclosures now matter as much as the comp set.
For sellers: Pricing strategy matters more for a condo right now than at any point in the last four years. The market is willing to pay — at the right number. The four-week trend says that number is 5%–8% below what last year's comparable would have sold for.
For builders: New condo product going into Williamson and Sumner is delivered into a market where active inventory is growing roughly 4× faster than absorption. (New-construction pending contracts just turned positive last week — but that's the SFH builder recovery; the condo-builder picture here is different.) The next 60 days will tell whether buyer incentives stabilize the absorption rate or whether list prices have to come down.
The thing to watch over the next 60 days: Does condo months-of-supply cross 6.0? At the current slope, that happens around mid-July. If it does, the median sales price decline accelerates from -6% toward -8% to -10%, and the $400K–$700K condo tier becomes the most-marked-down product category in the metro.
Data through week ending 05-19-2026, Greater Nashville (Davidson, Williamson, Rutherford, Wilson, Sumner, Maury, Dickson, Cheatham, Robertson). Sources: RealTracs MLS aggregate weekly data, plus closed-sale repeat-sale analysis from a 234,000-row regional closed-listing export covering 2020–2026.