Two related things happened in this week's data. The market's biggest price band, $300K to $500K, flipped negative on closings: 1,264 homes closed in the band over the trailing month, 45 fewer than the same week last year, five weeks after it was running 153 ahead. And for the first time in the four years of weekly data I track, homes under $500K are now a minority of what closes in Greater Nashville: 47.8% of all closings, when no single week in 2023, 2024, or 2025 ever printed below 50%.
This post walks through the flip, the staircase pattern that sits behind it (closings are falling in the cheap bands and rising in the expensive ones, in strict price order), and then the six-year mechanism that explains it: Nashville's starter stock has migrated up the price ladder faster than incomes have followed. Along the way I'll bring in what Zillow and Redfin are seeing nationally, and what IRS migration data says about who can still buy above the line.
1. Nashville's biggest price band just flipped negative
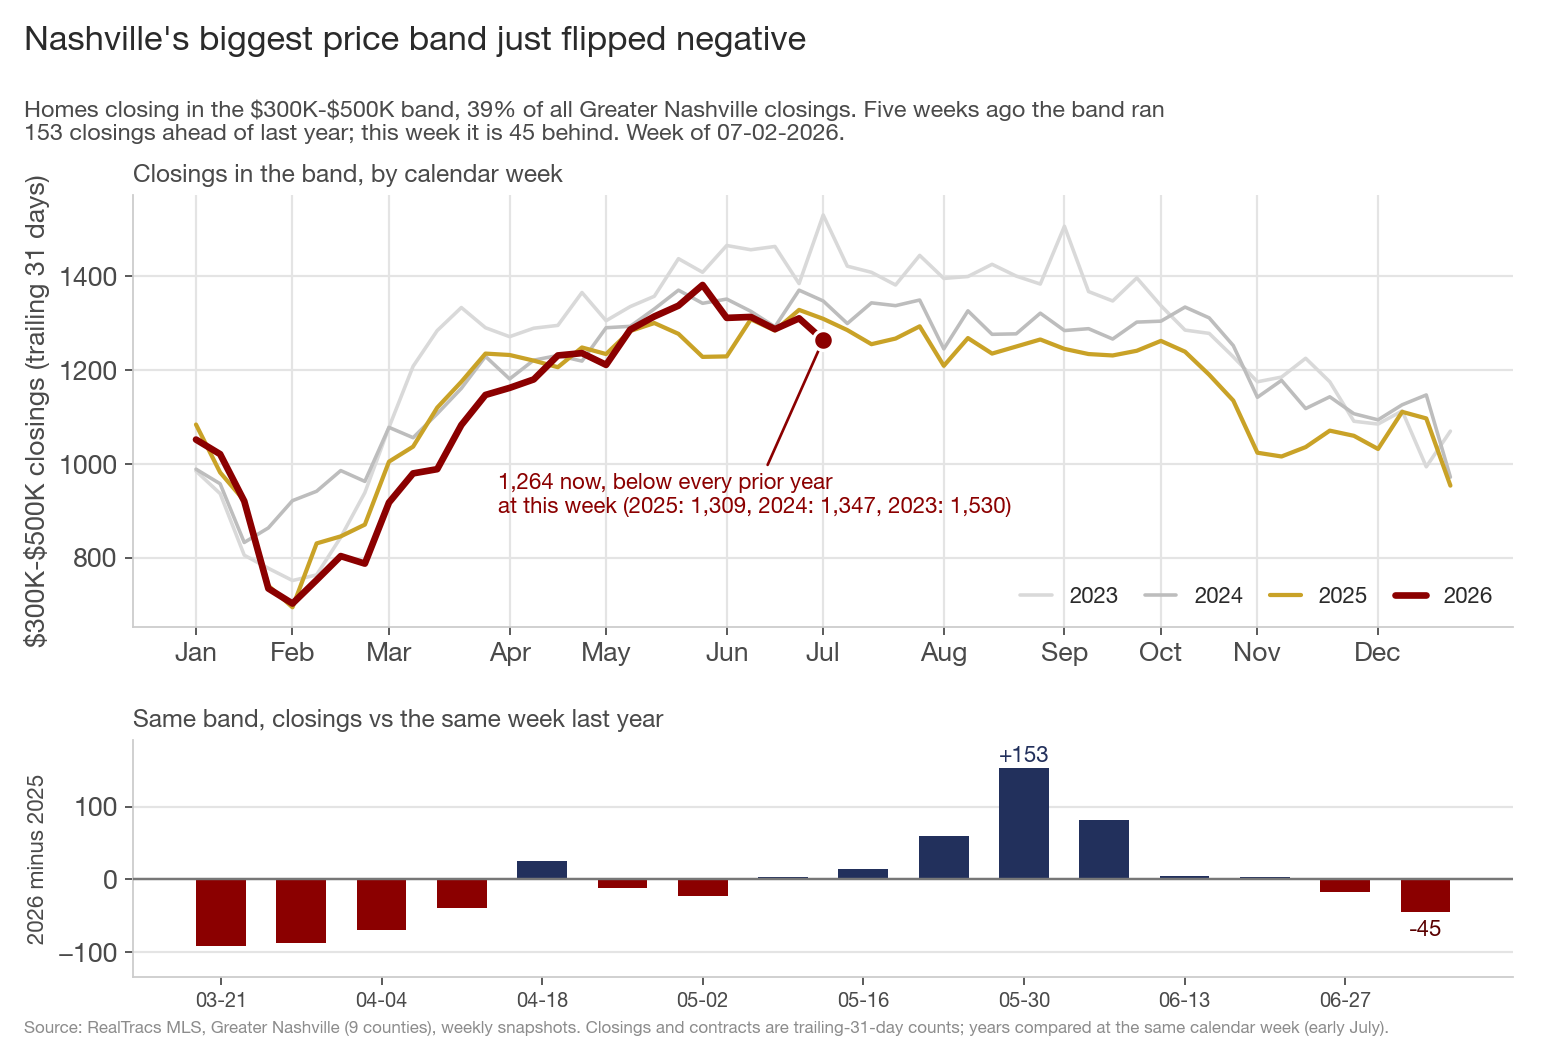
The $300K-$500K band is 39% of everything that closes in this market, by far the biggest of the six bands I track. Through late May it looked like the band was finally rebuilding: closings ran as much as +153 ahead of last year at the May 30 snapshot. That cushion eroded for four straight weeks, went negative on June 27, and deepened to -45 this week.
The level matters more than the flip. This week's 1,264 closings sit below the same week of 2025 (1,309), 2024 (1,347), and 2023 (1,530). That is a third straight year of shrinkage at this calendar position, and 2026 is now -17.4% below where the band stood in 2023. The comparison year is not doing the work here: last summer's closings came out of contracts written during the April 2025 tariff freeze, so the current base is a soft one, and the band is printing below it anyway.
Before reading that as seller distress, check the price side: 39.7% of the band's active listings carry a price cut, a touch below last year's 40.7%, and the band's median sale is flat at $399K (vs $395K a year ago). Demand has held up too, with homes going under contract in the band running +2.5% vs last year, though still -7.5% below 2024. The weakness is specific to closing volume and to the market's mix, and the next two charts show the shape of it.
2. Closings fall below $500K and rise above it, step by step
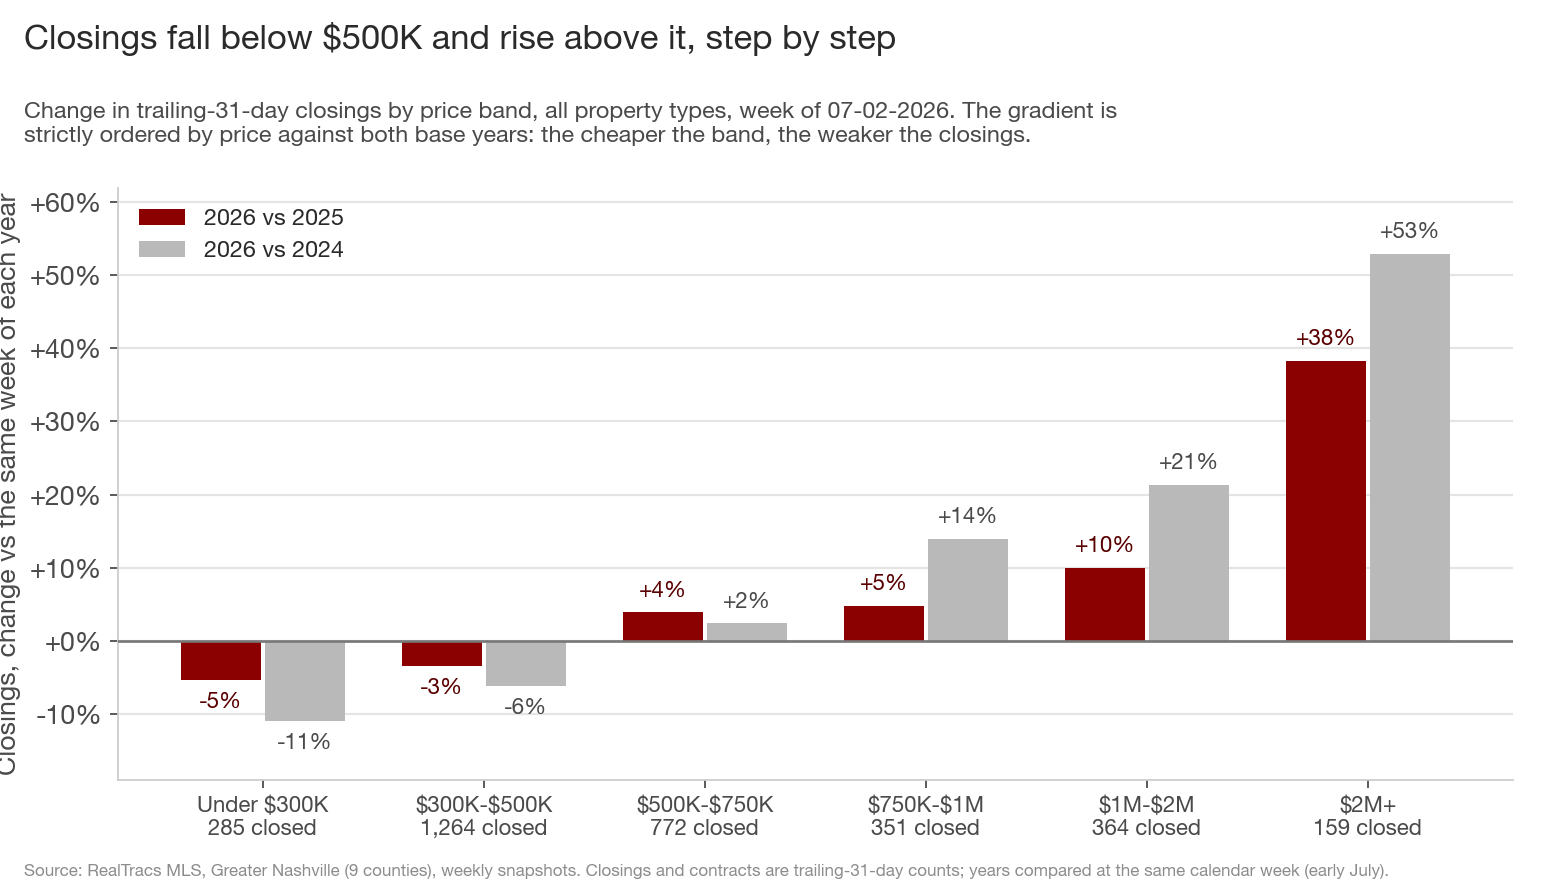
Line the six bands up and the pattern is a staircase. Against last year, closings are -5.3% under $300K and -3.4% in the $300K-$500K band, then positive at every step above: +3.9% ($500K-$750K), +4.8% ($750K-$1M), +10.0% ($1M-$2M), and +38.3% at $2M+. Re-base against 2024 to strip out last year's tariff distortion and the staircase gets steeper, from -10.9% at the bottom to +52.9% at the top. The ordering is strict in both comparisons: the cheaper the band, the weaker the closings.
Add it up and the market splits at one line. Closings under $500K are down -3.8% year over year (and -7.1% vs 2024); closings above $500K are up +8.4% (and +12.6% vs 2024). The whole market grew +2.2%. Every bit of Greater Nashville's growth this year is happening above $500K.
One composition note: the under-$300K decline is mostly a condo story (single-family closings under $300K are a small, stable slice of about 170). The $300K-$500K flip is not. Single-family closings in that band are down -2.1% vs last year and -5.4% vs 2024, and it is the only single-family band closing below all three prior years.
This is not just Nashville. Redfin's national report last week found luxury home prices rising 3x faster than non-luxury prices (+4.7% vs +1.5%), with luxury pending sales growing faster too. Nashville's version of that divergence just happens to be sharp enough to flip the majority of the market.
3. Under-$500K homes are now a minority of sales, a first
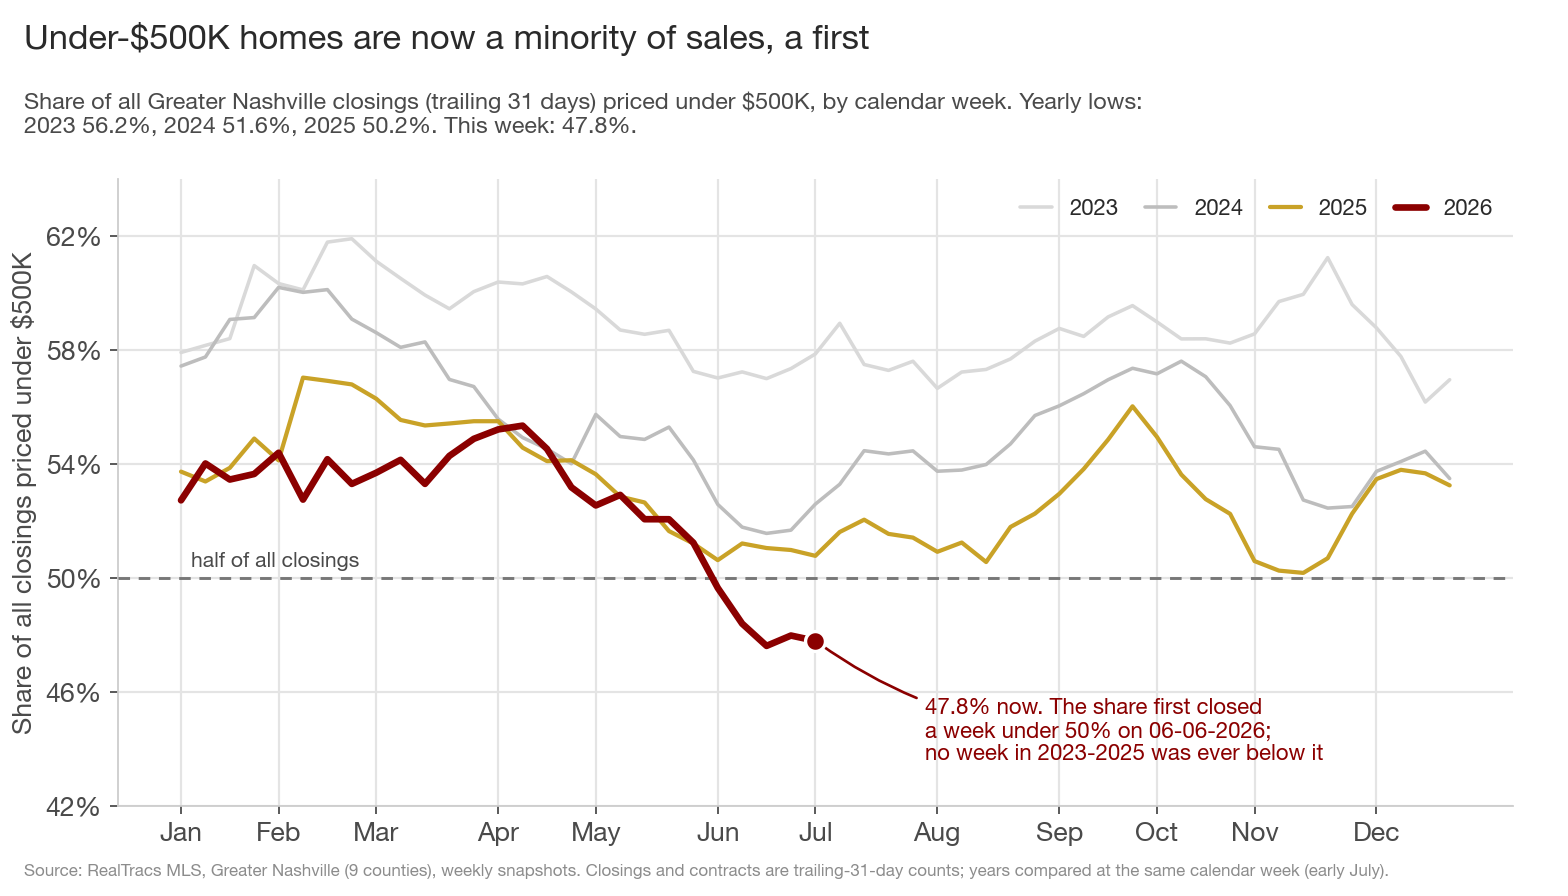
In 2023, under-$500K homes were never less than 56.2% of what closed in a given week. The floor dropped to 51.6% in 2024 and 50.2% in 2025, and the line finally broke on June 6, 2026, the first week in the data where under-$500K homes were a minority of closings. It has stayed below the line every week since and sits at 47.8% now.
Single-family alone crossed this line earlier, back in spring 2024, and is at 43.0% this week, the lowest stretch in the four years of weekly data. The metro-wide number held above 50% until now because condos and townhomes skew cheap; with condo closings themselves now falling (the condo market has been in buyer's-market territory since May), the last prop under the 50% line gave way.
The seasonal shape matters for what happens next: this share always sags into summer and recovers in winter. The honest way to read the chart is the level of each year's line, and 2026's line has run 3 to 5 points below every prior year all year. A winter bounce back above 50% would be normal; the trend that put the summer floor below half is the story.
4. Where did the under-$500K market go? Up the price ladder
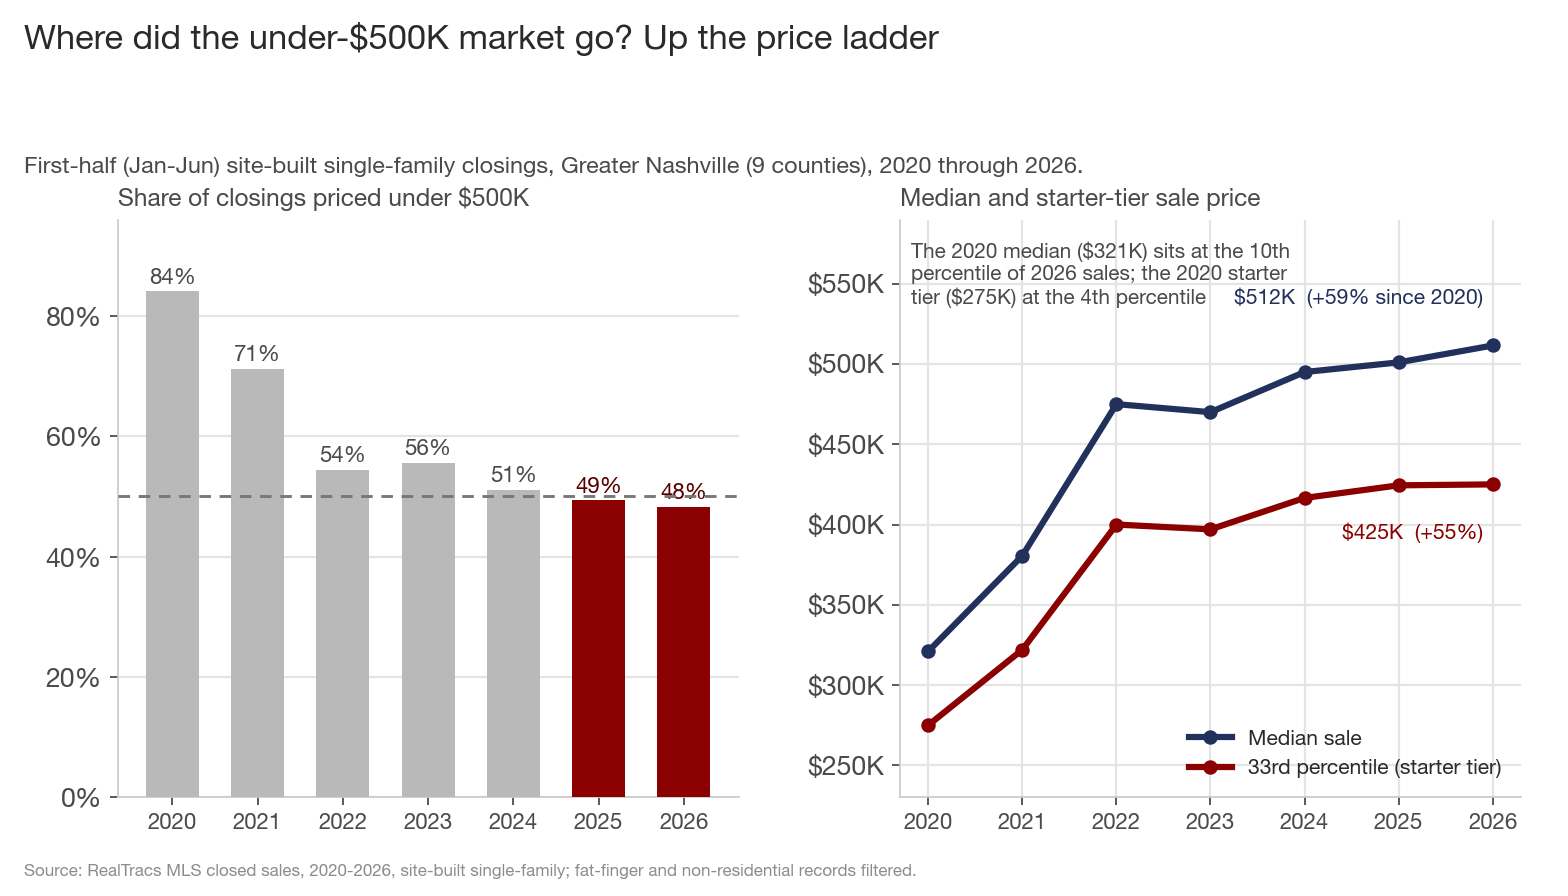
The weekly flip is the end of a six-year migration, and closed-sale records back to 2020 show it plainly. In the first half of 2020, 84% of site-built single-family closings in these nine counties were under $500K. That share has fallen every year but one since: 71% (2021), 54% (2022), 56% (2023), 51% (2024), 49% (2025), and 48% in the first half of 2026.
Prices did the moving, mostly in one violent stretch. The first-half median single-family sale went from $321K (2020) to $512K (2026), up +59%; the starter tier, which I'm defining as the 33rd percentile sale, went from $275K to $425K, up +55%, with nearly all of that gain landing by 2022. Put differently: the median home of 2020 would sit at the 10th percentile of this year's sales, and 2020's starter home at the 4th percentile. The product that used to make up the middle of this market now barely exists at its old price.
Zillow's home-value index tells the same story from the valuation side: the typical mid-tier Nashville single-family home was worth $318K in June 2020 and $463K in May 2026, a +46% gain, and it has been essentially flat for four years (-0.8% since June 2022). Prices stopped rising in mid-2022; they just never gave back the ground that moved the middle of the market to the far side of $500K. Nashville is still far from the extreme cases. Zillow's latest starter-home research counts a record 242 US cities where a starter home now runs $1M or more, up from 80 cities in February 2020, against a typical US starter home of about $199K. Nashville is not on that list. But the direction of travel, entry-level product repricing out of entry-level reach, is the same one those 242 cities took.
5. The pipeline tilts the same way against the cheaper bands
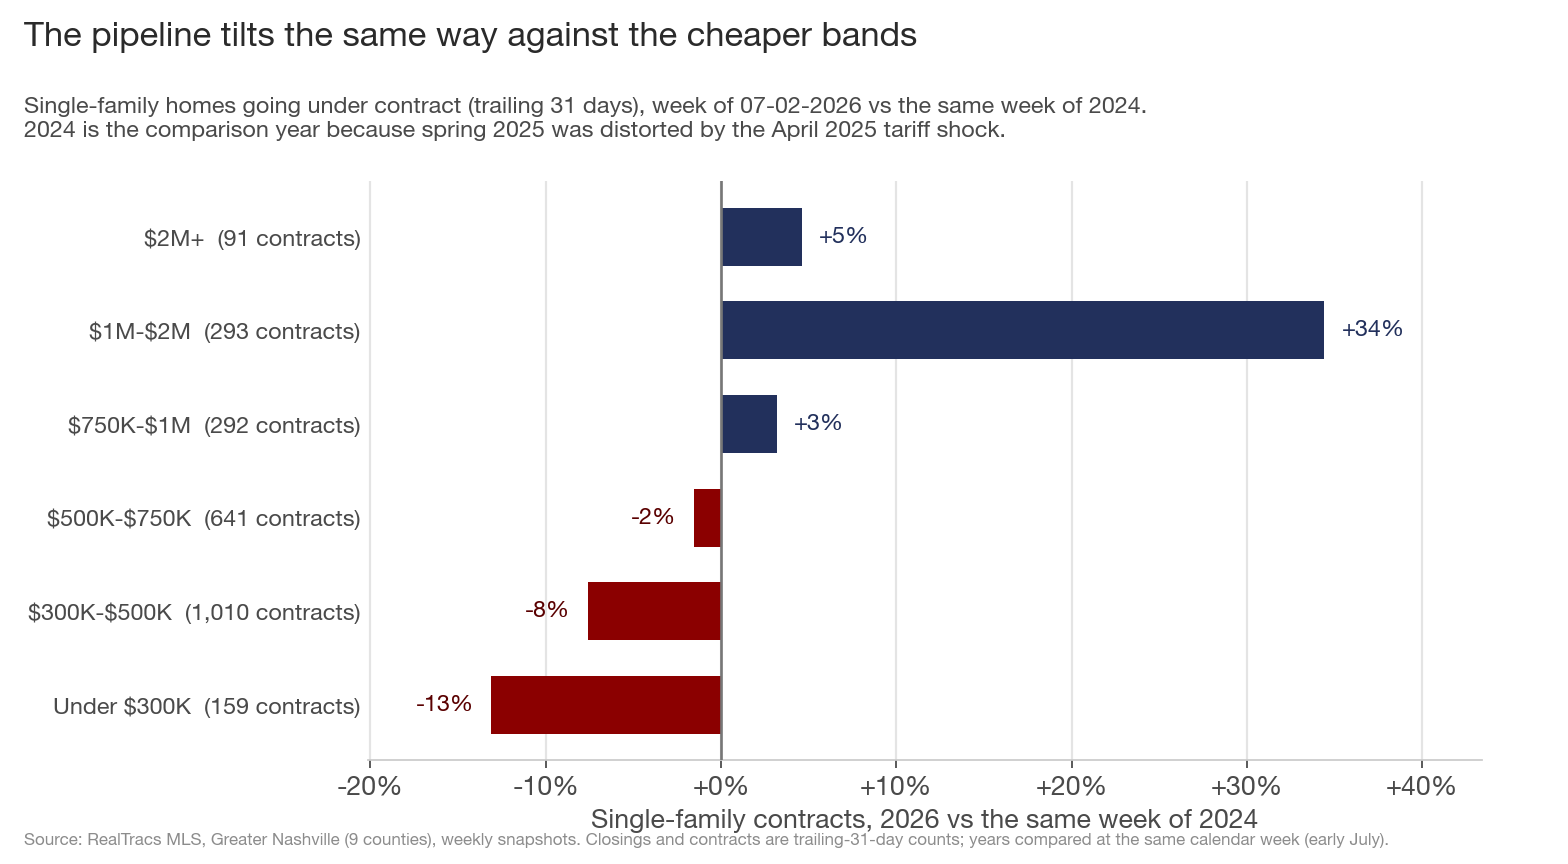
Contracts are the forward view, and measured against 2024 (the clean base year, since spring 2025 was distorted by the April 2025 tariff shock) the pipeline has the same tilt: single-family contracts are -13.1% under $300K, -7.6% in the $300K-$500K band, and -1.5% at $500K-$750K, while every band above $750K is positive, led by $1M-$2M at +34.4%. One top-end reading needs the echo caveat: $2M+ contracts show -11.7% against 2025, but that is last June's post-tariff snapback base talking; against 2024 they are +4.6%, and $2M+ closings are up +38% on the year regardless.
Who is buying the upper half? Some of it is local equity moving up the ladder, and a measurable part arrives with in-migration. IRS migration data (tax years 2022-2023, the most recent county file) shows households moving into Davidson County from Los Angeles and Chicago's Cook County reported average incomes of $122K and $124K per return, roughly double the $47K-$63K averages of households arriving from Rutherford, Sumner, Montgomery, or Cheatham counties. Williamson County's inflow is starker: its out-of-state arrivals average $188K, with LA at $282K and Cook County at $292K. The out-of-state pipeline shows up pre-qualified for the bands that are growing; the local and intrastate churn carries incomes that fit exactly the bands that are shrinking. It is the same sorting I wrote about in the migration ladder post this week, now visible in the closing mix.
What this adds up to
- The $300K-$500K band, 39% of the market, flipped negative this week (-45 YoY) and is closing below 2025, 2024, and 2023 levels, a third straight year of shrinkage.
- Closing growth is a strict staircase by price: -5.3% under $300K rising to +38.3% at $2M+, and steeper against 2024. Under $500K: -3.8%. Over $500K: +8.4%.
- For the first time in the weekly data, under-$500K homes are a minority of closings (47.8%). Single-family alone is at 43%.
- The cause is six years old: the under-$500K share of first-half single-family closings fell from 84% to 48% since 2020 as the starter tier repriced from $275K to $425K. 2020's median home is 2026's 10th-percentile home.
- The pipeline (contracts vs 2024) tilts the same way, and the in-migration income mix keeps feeding the upper bands.
For buyers under $500K, the leverage is real but the selection keeps thinning: the $300K-$500K band has more listings than a year ago (+6.1%) and about 4 in 10 carry a price cut, yet each year there is structurally less product there, and the under-$300K single-family market is down to about 170 closings a month. For sellers in the band, the flat median ($399K) says pricing power is gone even though the rest of the market is growing; you are selling into the shrinking half of the market's demand (only the under-$300K tier is weaker), and the cut-share data says your competition has already adjusted. For move-up owners the spread keeps widening in your favor on the sell side and against you on the buy side: the bands you would buy into are the ones still appreciating in volume terms.
What would change my mind over the next 30 to 60 days: watch the under-$500K share. If it climbs back above 50% and holds there before the normal winter recovery, this was a blip; I expect it to stay in the 46-49% range through Labor Day. On the band itself, be careful scoring the YoY line in July and August, because last summer's base was tariff-depressed and even a real recovery would flatter against it. The honest tell is the gap to 2024, -6.2% on closings and -7.5% on contracts today. If those gaps are still this wide at Labor Day, the shrinking of Nashville's under-$500K market is still running; if they close toward zero, the middle is stabilizing.
Data through the week ending 07-02-2026, Greater Nashville (9 counties: Davidson, Williamson, Rutherford, Wilson, Sumner, Maury, Dickson, Cheatham, Robertson). Weekly figures are trailing-31-day counts compared at the same calendar week of each year. Sources: RealTracs MLS; Zillow ZHVI (mid-tier single-family) and Zillow Research; Redfin; IRS SOI county-to-county migration data, 2022-2023.