The headline number on Greater Nashville's housing supply this week is 11,720 active listings — up 8.6% from the same week of 2025. Most coverage will stop there and call it "supply is up." That framing hides the actual story.
Underneath the total, the metro is running two completely different supply markets. Existing-home active inventory sits at 8,826 listings — up 940 (+11.9%) from this week last year. New construction active inventory sits at 2,894 listings — down 15 (−0.5%) from the same week last year. Existing-home sellers added almost a thousand listings against 2025. Builders added nothing.
That gap isn't an artifact of one noisy week. It's been crystallizing through May, and it shows up cleanly in the price-cut data, the supply-ratio data, and the by-price-band breakdown. This post lays out the divergence, shows that it's a supply story (not a demand-side weakness story), and works through what it implies for the next 60 days.
1. Total active is up — but the composition has shifted for three years running
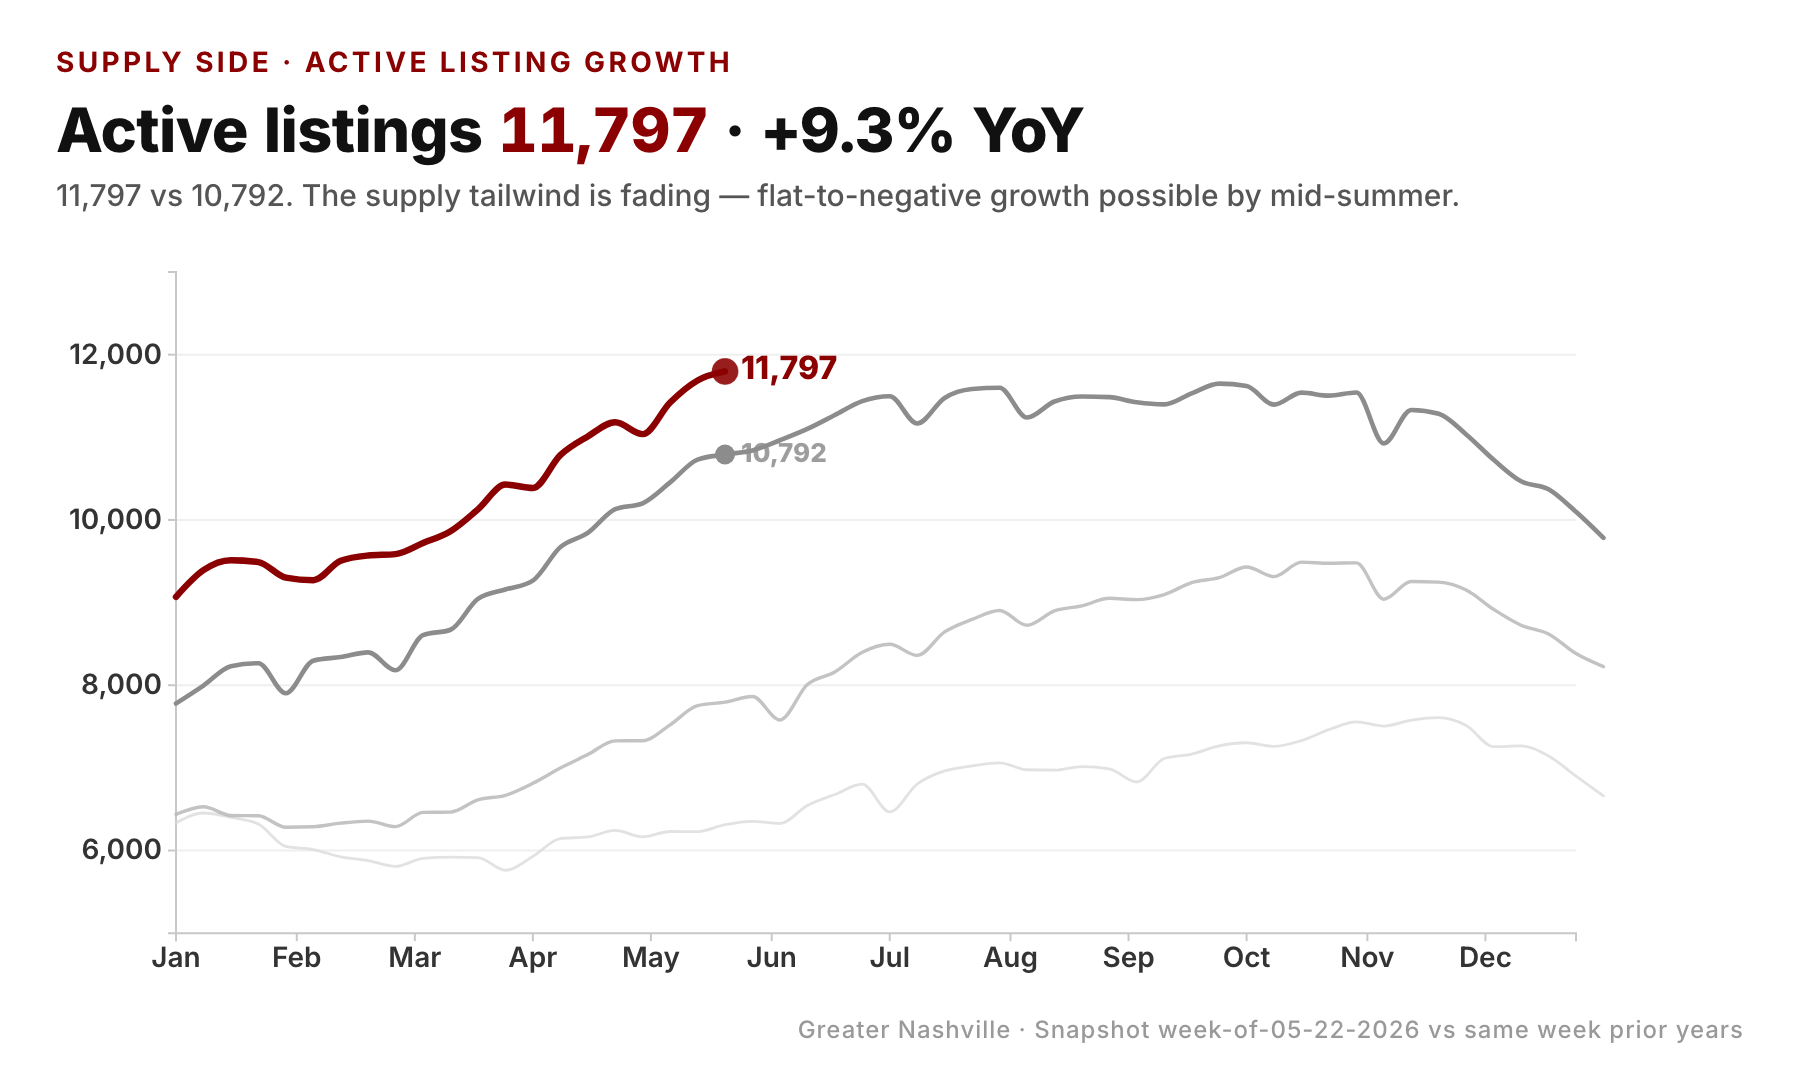
Greater Nashville's total active inventory at week 21 (05-28) has climbed in each of the last four years: 6,353 (2023) → 7,833 (2024) → 10,795 (2025) → 11,720 (2026). The 2025-to-2026 step is much smaller in percentage terms than the prior years — supply growth is decelerating — but it's still positive in absolute terms.
What the headline number hides is the composition. New construction's share of active inventory at the same week each year:
- 2023: 39.4% (2,504 of 6,353)
- 2024: 31.9% (2,498 of 7,833)
- 2025: 26.9% (2,909 of 10,795)
- 2026: 24.7% (2,894 of 11,720)
Three years ago, four in ten active listings in this metro were brand-new construction. This year, one in four. The growth in total inventory over the cycle is almost entirely an existing-home story. Builders have not been the ones expanding the stack.
2. The divergence on one chart: existing inventory keeps piling on, new construction is flat
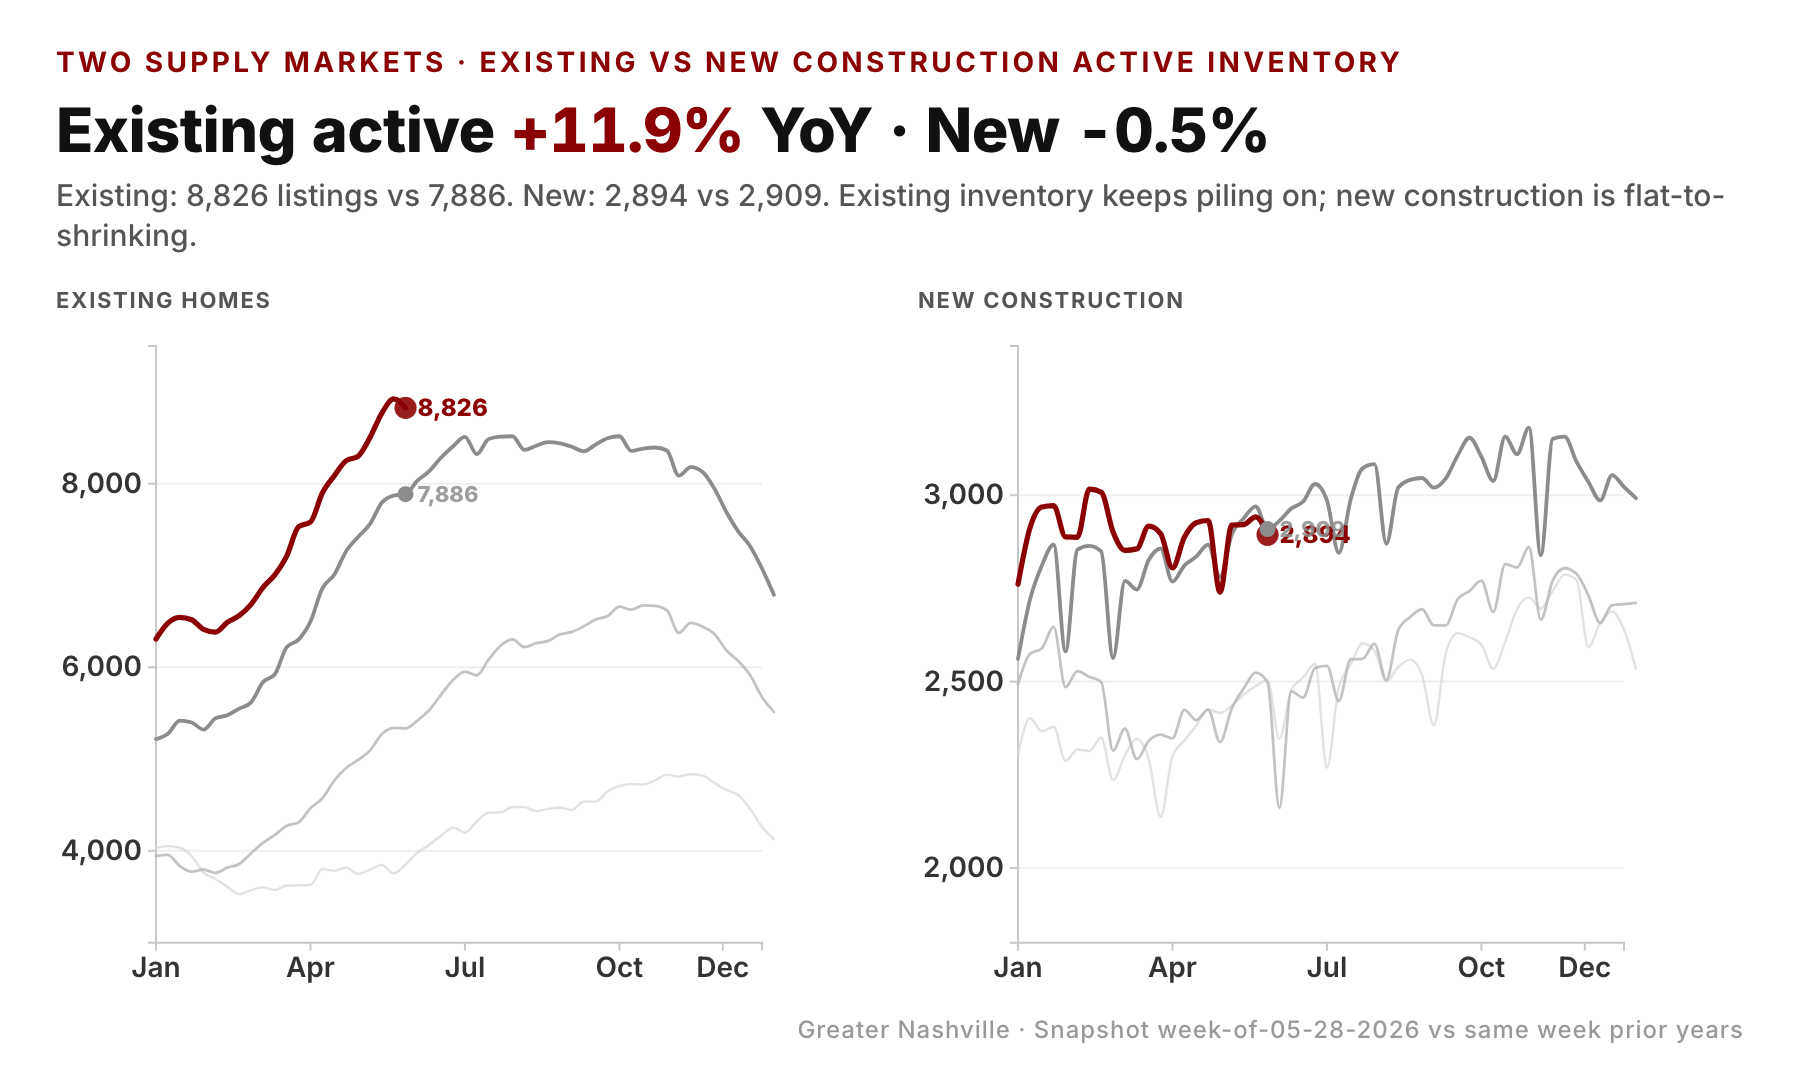
This is the headline picture. Left panel: existing-home active inventory has been running roughly 1,000 listings above 2025 every single week of 2026 — a remarkably steady surplus. The 2026 line tracks 2025 in shape (the seasonal climb is the same) but shifted up by a four-figure absolute count.
Right panel: new construction active inventory in 2026 has been essentially indistinguishable from 2025 all spring. It ran 50–300 listings ahead through March, then crossed at the end of April. From May 2 onward the YoY count diff has gone −41, +25, −17, −28, −15 — four of the last five weeks negative, on a base that's three times tighter than the existing market. New construction is no longer adding to the supply story.
Together the panels say: the entire 925-listing year-over-year increase in total active inventory came from existing-home sellers. Builders contributed less than zero.
3. This isn't a builder-weakness story — demand is up in both markets
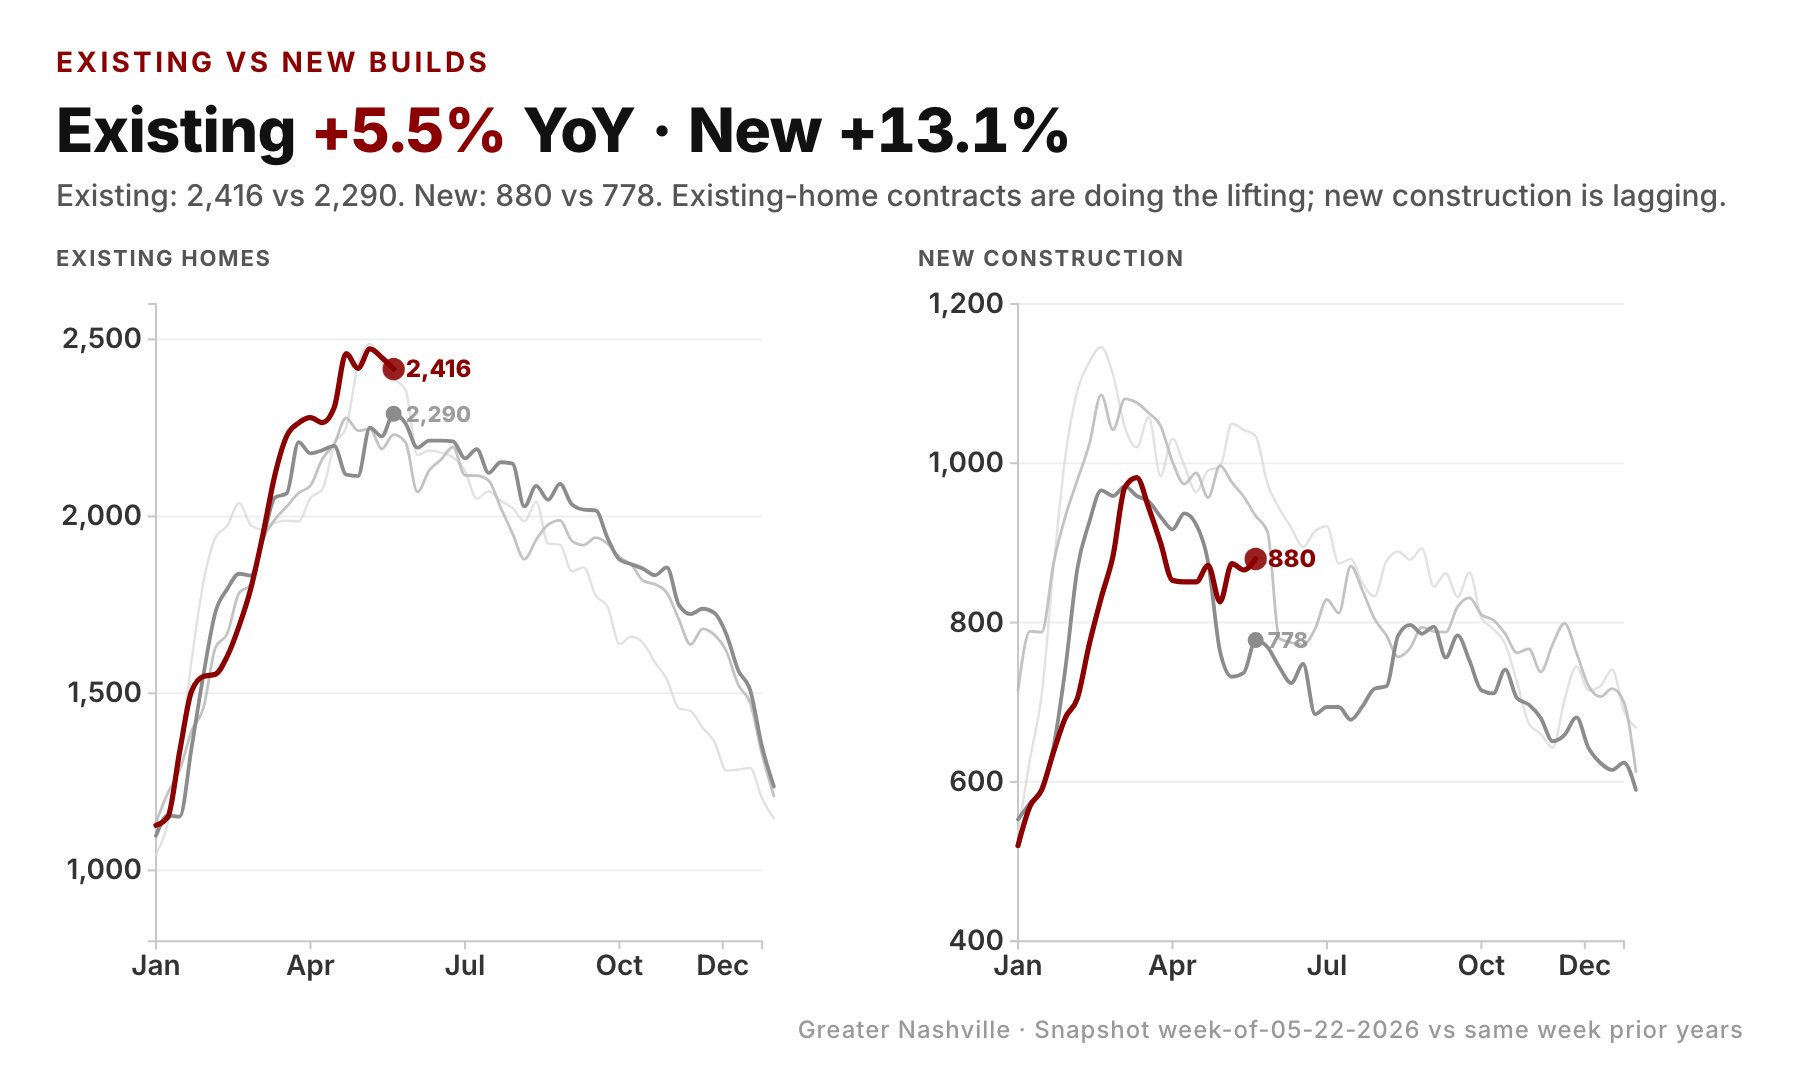
Before reading the supply divergence as "builders pulled back because demand dried up," look at the contract side. This week:
- Existing pending contracts: 2,397 vs 2,289 last year — up 4.7% YoY
- New construction pending contracts: 841 vs 767 last year — up 9.6% YoY
Both demand sides are positive. New construction demand is growing twice as fast as existing-home demand. Builders are seeing more pendings than this time last year, not fewer. The reason their active inventory isn't growing is that the contract side is absorbing the supply roughly as fast as it's coming online.
Combine the two sides into supply ratios — months of inventory at the current pending pace — and you can see the markets flipping:
| Existing | New Construction | |
|---|---|---|
| Supply ratio, May 2025 | 3.4 months | 3.8 months |
| Supply ratio, May 2026 | 3.7 months | 3.4 months |
| YoY change | +0.3 mo (looser) | −0.4 mo (tighter) |
A year ago, existing was the tighter market and builders were sitting on slightly heavier shelves. This year, that relationship has inverted. Builders are now operating in a tighter market than existing-home sellers are.
4. The divergence is concentrated in two price bands
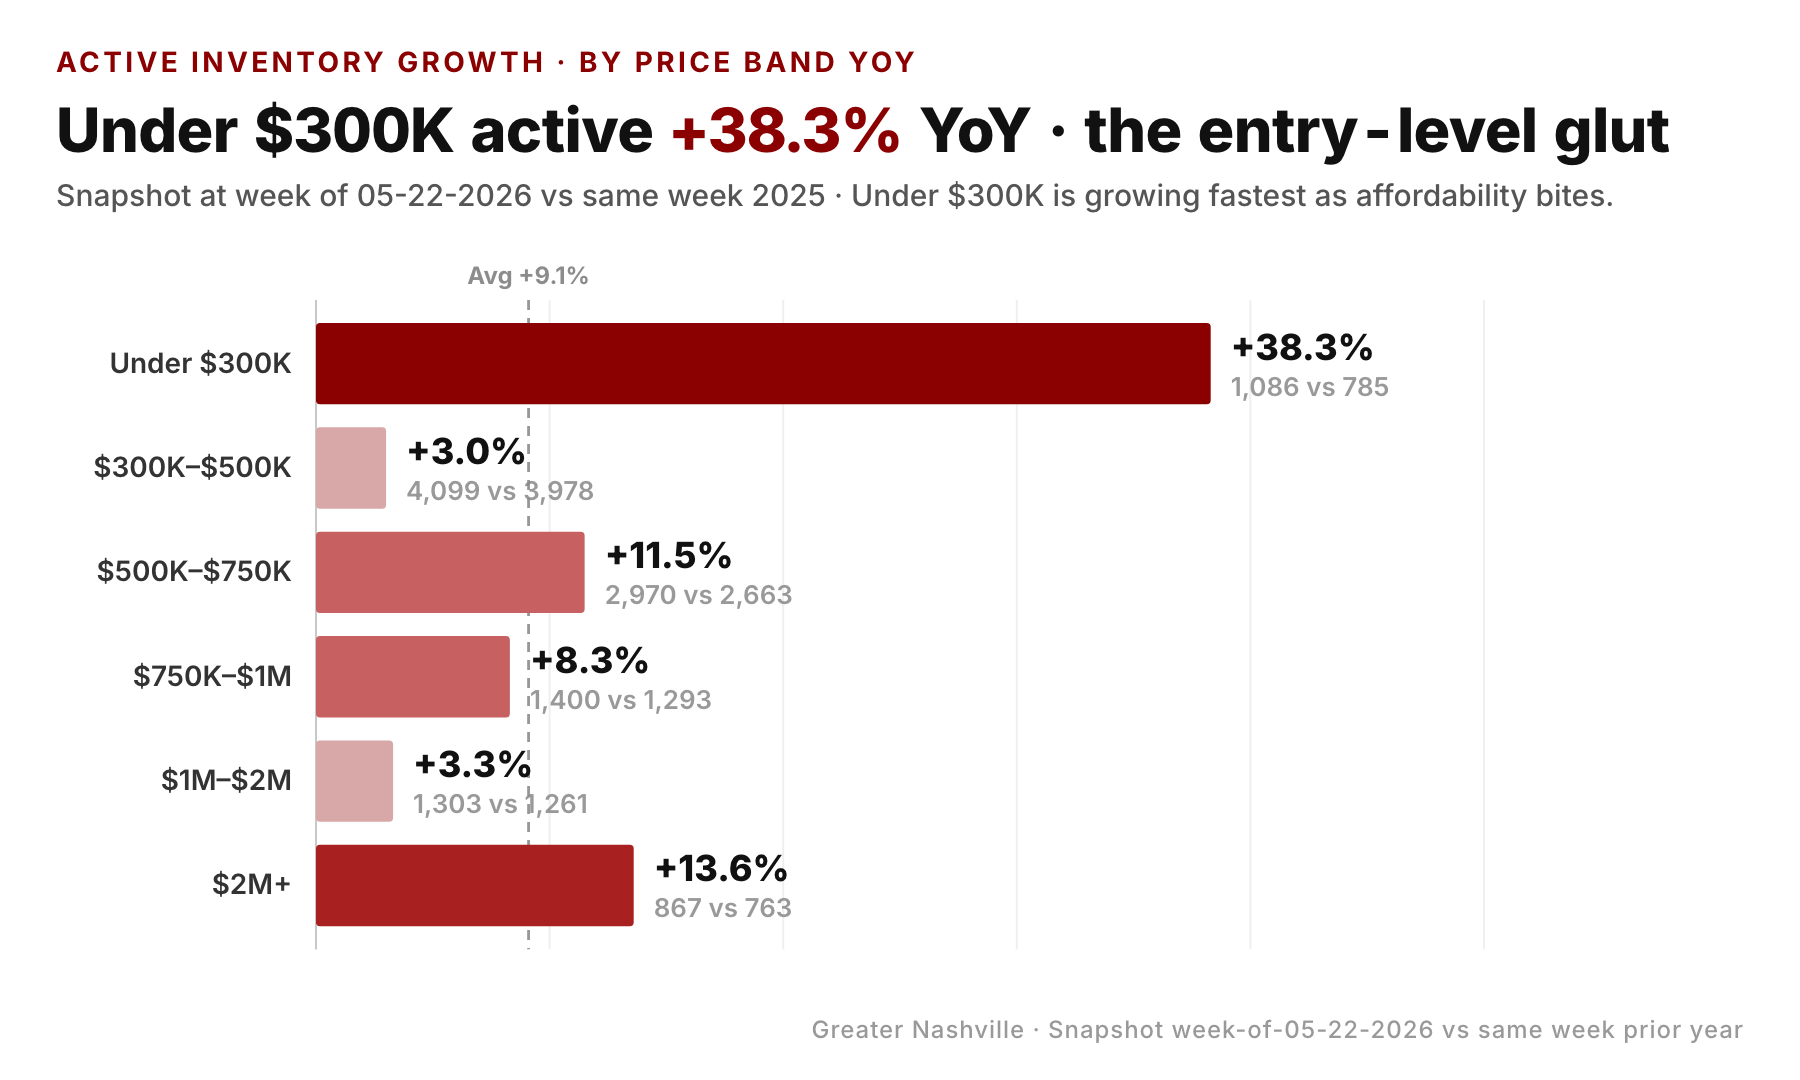
The metro-wide divergence (existing +11.9%, new −0.5%) averages across price bands that aren't behaving the same way. Splitting active inventory at week 21 by construction type and by price band, here's the YoY picture:
| Price band | Existing active YoY | New construction active YoY |
|---|---|---|
| Under $300K | +37.3% | +76.9% (tiny base: 92 listings) |
| $300K–$500K | +8.1% | −10.7% |
| $500K–$750K | +9.0% | +10.4% |
| $750K–$1M | +15.2% | −17.2% |
| $1M–$2M | +1.1% | +11.1% |
| $2M+ | +17.4% | +6.8% |
The two bands where builders have pulled back hardest are $300K–$500K (down 122 listings YoY) and $750K–$1M (down 68 listings YoY). Those aren't random — they're the move-up-buyer's product. Builders pivoted toward delivering homes that locked-in 3% mortgage holders would actually trade for, then watched demand absorb them.
For context: the $300K–$500K SFH band is the same one that flipped from +91 contracts YoY (four weeks ago) to −4 this week — the "missing middle" pattern. New construction inventory in that exact band shrank 10.7% YoY. So in the bread-and-butter price tier, demand on the existing side has wobbled, but builder supply has also wobbled. The two cushions are draining in opposite directions.
5. The price-side fingerprint
Two different supply-demand setups should produce two different price postures. They do.
Existing homes: - Median list price $530K — down 2.8% YoY - Active listings at a price cut: 40.9% — basically tied with 41.8% a year ago - Median sales price holding flat at $480K
New construction: - Median list price $571K — up 0.2% YoY - Active listings at a price cut: 20.5% — down from 23.4% a year ago - Median sales price $490K, down 2.0% YoY (concession-driven, see below)
Existing-home sellers have started cutting list prices to compete (median list down nearly 3%). Builders have held list prices steady — and fewer of their listings are sitting with a public price cut than a year ago. The closing-price comparison is the one place builders look softer (−2% on median sale), but that's because their concession game (rate buy-downs, closing-cost credits, upgrades) shows up at the closing table rather than as a price-cut sticker on the listing.
The pattern is consistent with the supply-ratio inversion: in the market where supply is loose (existing), sellers are conceding on the sticker. In the market where supply is tight (new), builders are holding sticker prices and using off-listing concessions to clear the inventory they have.
What this adds up to
- Total active inventory is up YoY (+925 listings), but the entire increase came from existing-home sellers. New construction active inventory is essentially flat (−15 listings) and has spent four of the last five weeks below 2025.
- The "supply is up" headline is only half right. Existing-home buyers are shopping in a steadily looser market. New-construction buyers are shopping in a market that just flipped tighter than the existing one.
- Demand is up in both markets. This isn't a builder-weakness story. New construction contracts are growing nearly twice as fast as existing-home contracts (+9.6% vs +4.7%). The new-construction supply isn't growing because the contract side is absorbing it.
- The divergence is concentrated in $300K–$500K and $750K–$1M. Those are the two move-up-buyer bands. They're also the two where the cushion is thinnest going into summer.
- Sticker-price behavior already reflects the split. Existing median list down 2.8% YoY; new construction median list flat. Existing price-cut % is essentially tied to last year; new construction price-cut % is dropping.
For buyers, the practical implication: you are shopping in two different markets at once, and they're moving in opposite directions. Existing-home leverage is rising — more inventory, more sticker cuts, longer days on market. New-construction leverage is falling — the soft, slow-moving builder market of late 2024 is gone, and the move-up product specifically has firmed up. Walking the same neighborhood with builder spec houses and resale houses now means walking two different price postures.
For listing agents, the practical implication is starker. The bigger 2026 inventory is sitting on existing homes, not new construction. If your seller is competing against a builder's spec home in the same price tier, your seller is also competing against ten other resale homes that weren't on the market this time last year. The instinct to compete on price will be right more often than wrong.
For builders, the data argues against rushing to expand starts. Active inventory has held steady while demand has grown — supply ratio dropped from 3.8 to 3.4 months. The current pace appears to be efficiently clearing what's coming online. The risk going forward is on the demand side, not the supply side.
The thing to watch over the next 60 days: does the new-construction supply ratio drop below 3.0 months by August? If demand keeps growing at this pace and builders keep delivering at this pace, it will. That would be the first time builders held a tighter shelf than existing-home sellers in this metro in the data series — and would be the structural setup for new-construction list prices to actually move up YoY rather than stay flat.
Data through week ending 05-28-2026, Greater Nashville (Davidson, Williamson, Rutherford, Wilson, Sumner, Maury, Dickson, Cheatham, Robertson). Source: market_pulse_yoy_data.json derived from MLS extracts.