Greater Nashville signed 2,773 purchase contracts over the trailing 31 days this week, 40 fewer than the same week last year (-1.4%), the first meaningful decline since late February. The June 10 post predicted this week's negative number: last April's tariff announcement briefly froze the market, 2025's numbers dipped and then recovered, and that recovery has been shrinking 2026's year-over-year comparison ever since. On its own, this week's negative reading would mean nothing.
However, the drop is multiyear. This week is also 8.0% below 2024 and 5.2% below 2023. A distorted comparison against one year cannot put you below three different years at once. Something real is slowing. This post shows where (nearly all of it is new construction and resale under $500K) and why now (the mortgage rate path since February).
1. How does this week compare with the last three years?
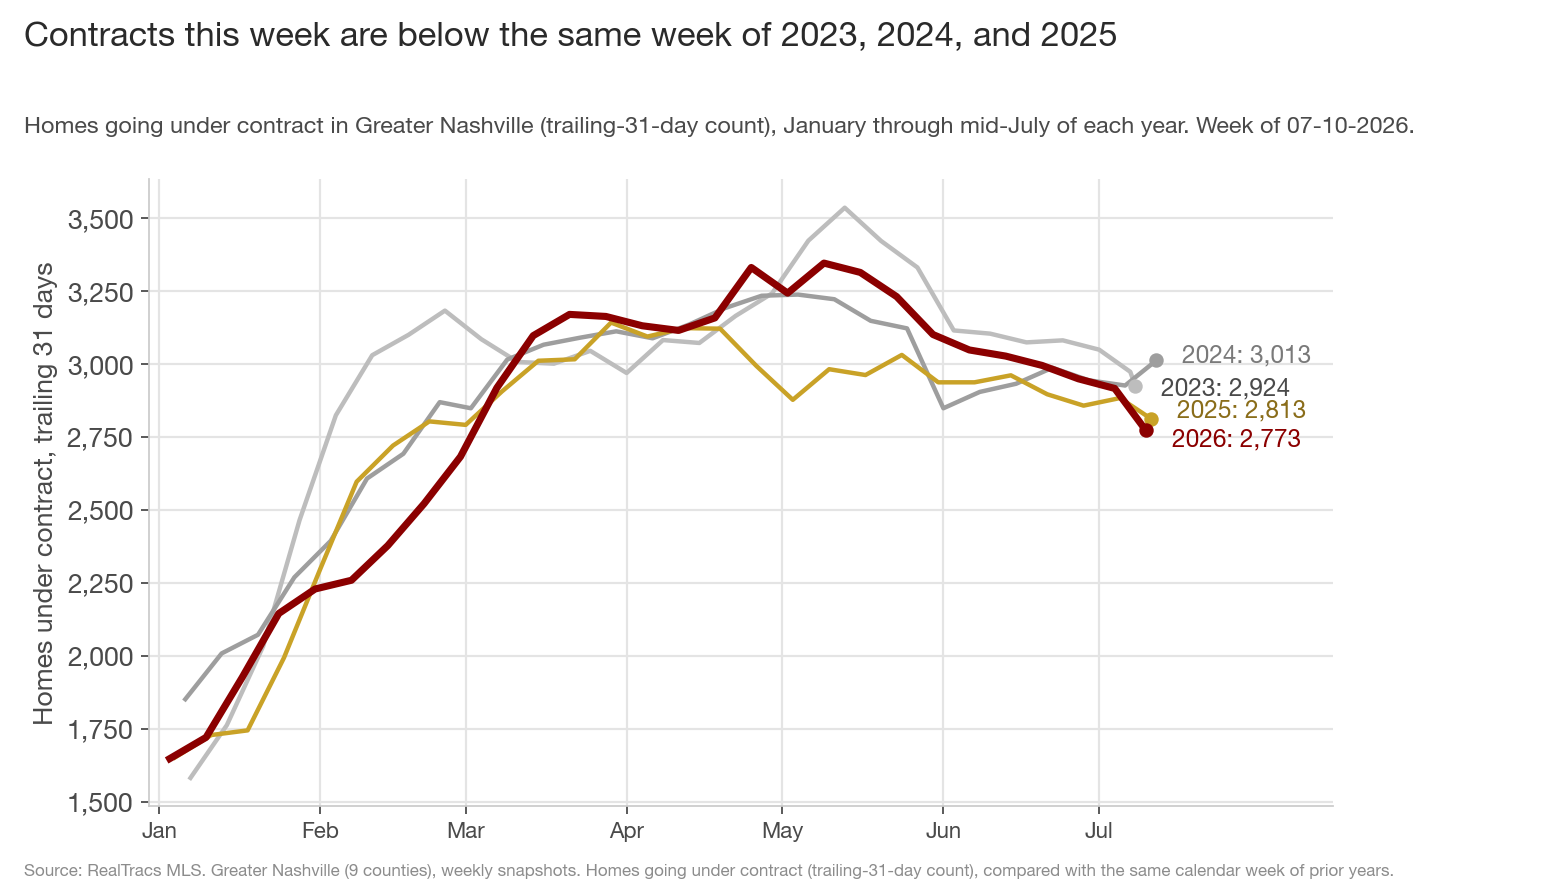
This week's 2,773 is below the same calendar week of 2025 (2,813), 2023 (2,924), and 2024 (3,013). It is the first week of 2026 to sit below all three at once since the spring market began. The rest of this post breaks down where the gap is and why it opened in July.
2. Did the June 10 prediction hold up?
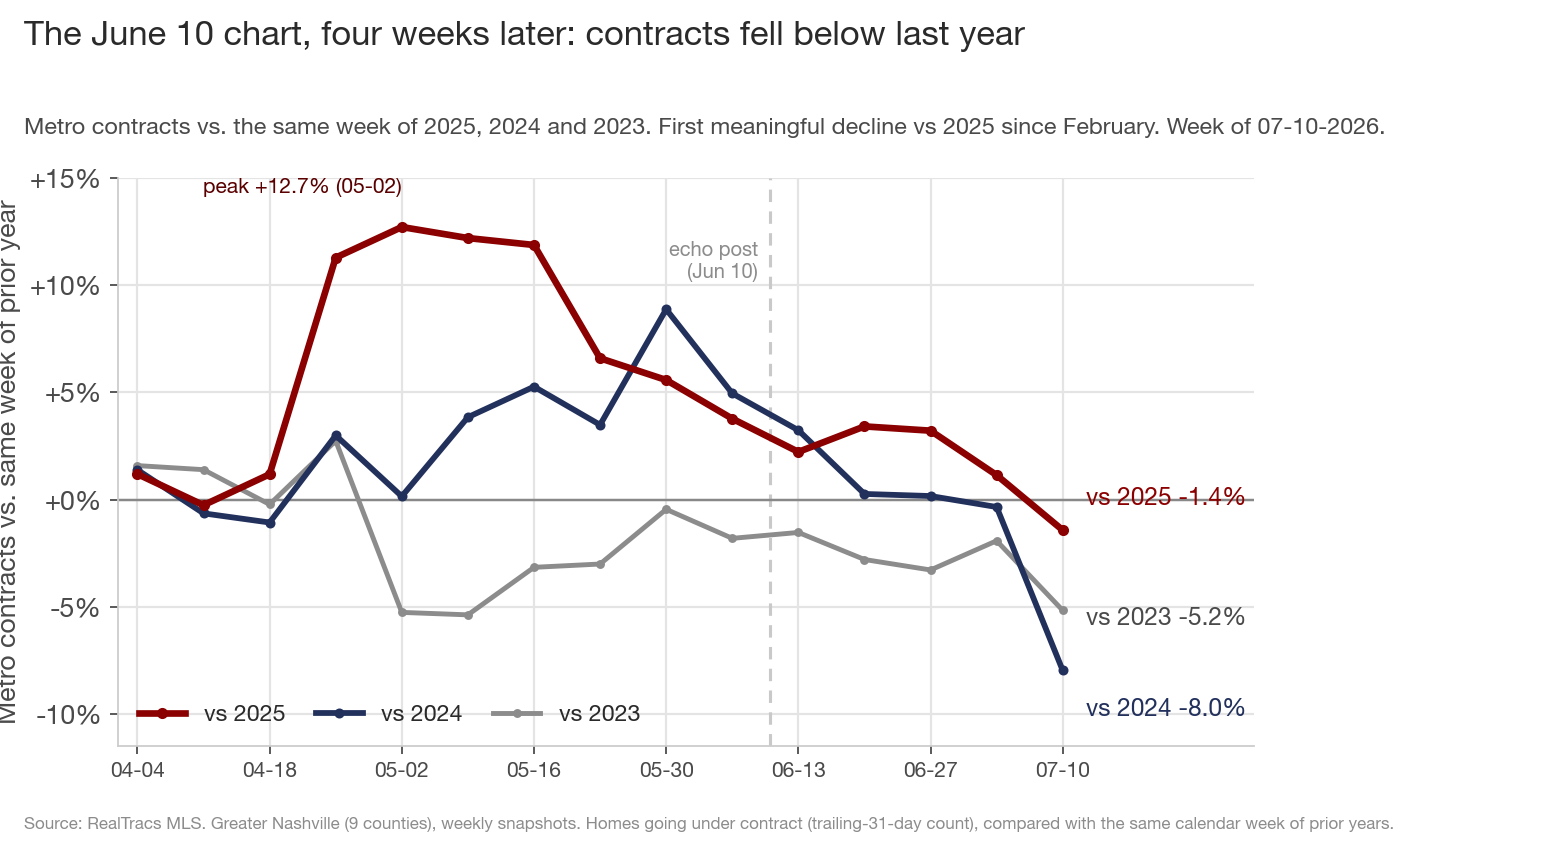
On June 10 I wrote that the shrinking year-over-year lead was mostly arithmetic, and named the line to watch: "If it holds above roughly +3% through July, this is a steady year and the negative headlines are arithmetic. If it breaks below 2024's path too, the fade is real and I'll write that post." ("It" is the navy line here, 2026 versus 2024.)
Both halves happened. Since the May 9 peak, 2026 fell by 574 contracts, a normal seasonal amount, while the still-recovering 2025 number fell by only 170. That is how a +364 lead became -40, and why the maroon line crossing zero this month was expected. The navy line falling below 2024 was the part that was not. That is the news.
3. How far below 2024?
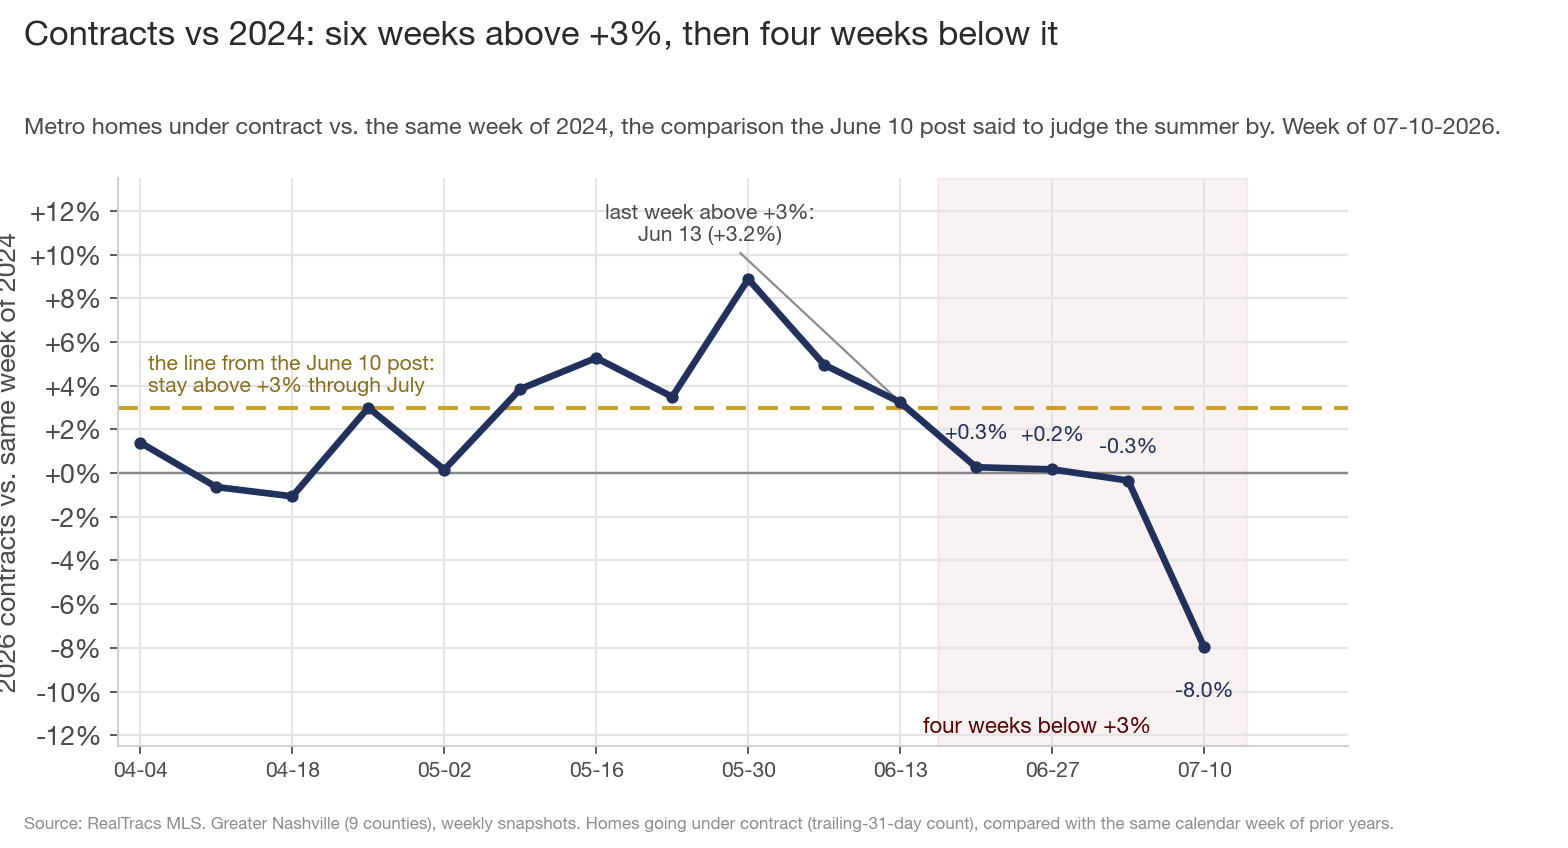
From May 9 through June 13, contracts ran 3.2% to 8.9% above 2024. The last four weeks: +0.3%, +0.2%, -0.3%, -8.0%.
Two caveats on the -8.0%. First, 2024 jumped +86 contracts into mid-July, its only week above 2023 since late April, so this week is measured against 2024's strongest stretch of the summer. Second, weekly counts that include July 4 are the least reliable of the year: some holiday-week contracts get entered into the MLS late, and the comparison weeks land on slightly different days (July 12 in 2024, July 11 in 2025). Both caveats are real. Neither explains four straight weeks below the spring range.
4. Where is the shortfall vs 2024?
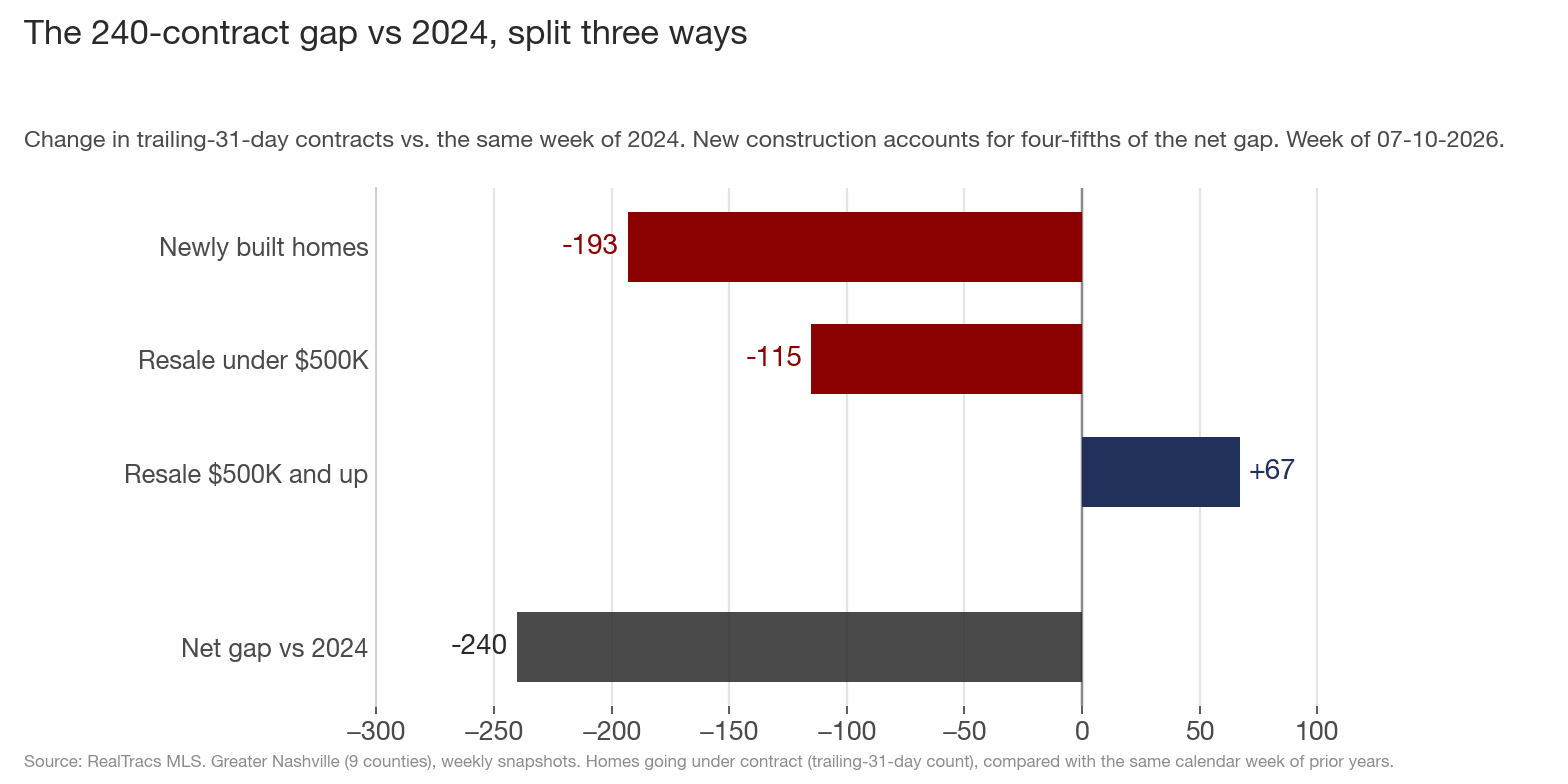
The metro is short 240 contracts vs 2024:
- Newly built homes: -193 (686 vs 879, -22.0%)
- Resale under $500K: -115 (1,066 vs 1,181, -9.7%)
- Resale $500K and up: +67 (985 vs 918, +7.3%)
New construction is four-fifths of the net gap, and builders are about a fifth below both normal years (-21.5% vs 2023 as well). The affordable end has been shrinking for structural reasons (the July 2 and July 4 posts covered why). The resale gains above $500K sit at the top: -1.8% at $500K-$750K, +0.5% at $750K-$1M, +40.1% at $1M-$2M, +23.5% at $2M+.
5. Which price ranges are weaker?
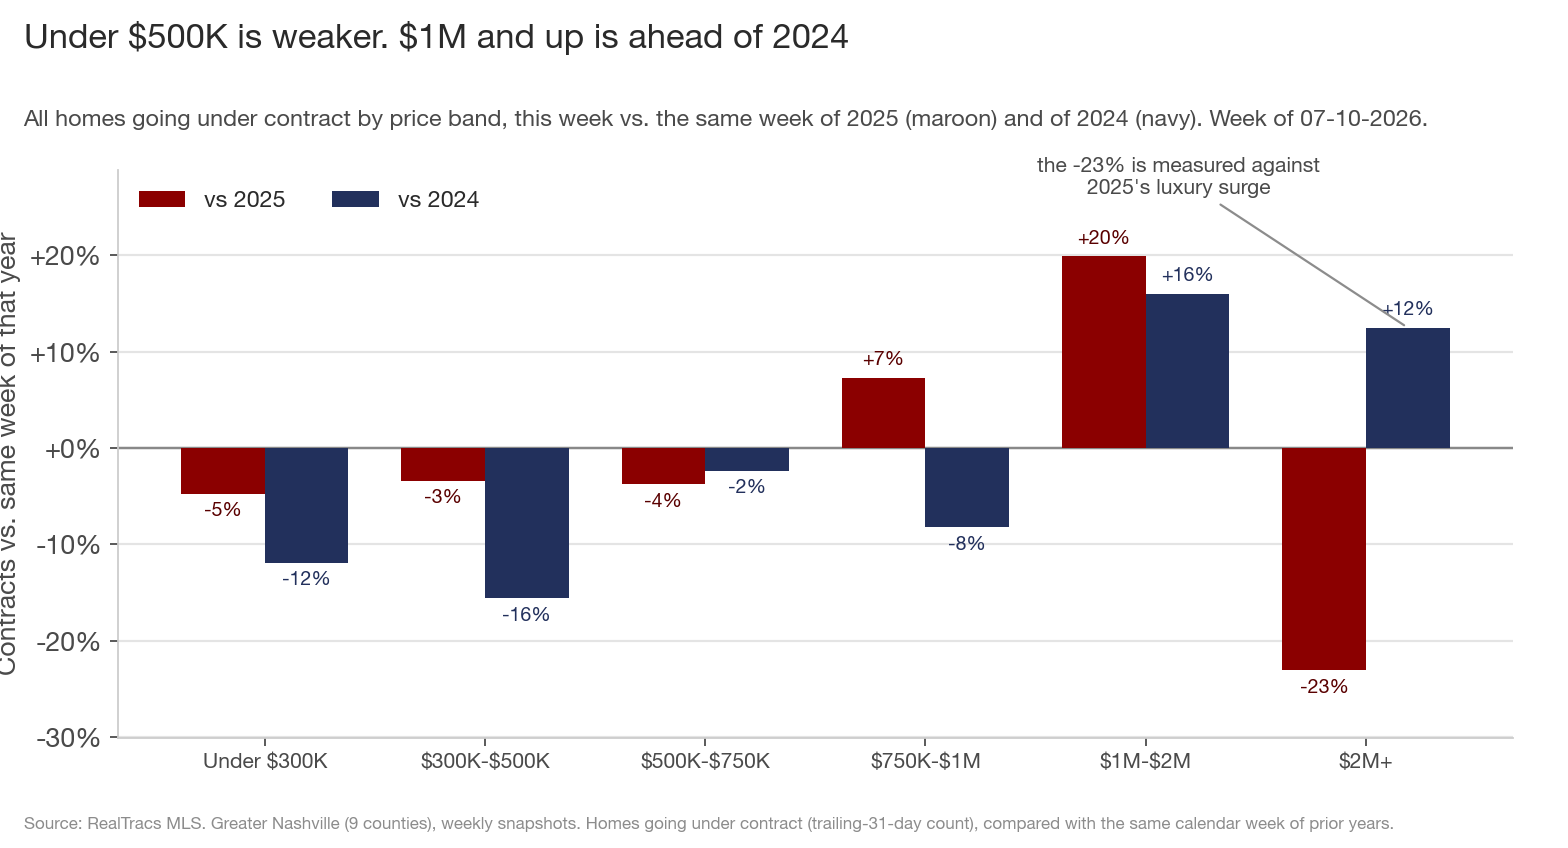
Against 2024: Under $300K -11.9%. $300K-$500K -15.6%, the weakest range (new construction inside it is -25.7%, resale -10.6%). $500K-$750K -2.4%. $750K-$1M -8.2%, though resale alone there is +0.5%; builders are the difference. $1M-$2M +16.0%. $2M+ +12.5%.
One warning about the scariest-looking number in my daily scan: $2M+ contracts are down 23.1% vs 2025 after being up 36.6% four weeks ago. The same segment is 12.5% above 2024. Last July was 2025's luxury run-up (covered June 12), so the vs-2025 number is measuring that base, and $2M+ single-family closings were 152 this week, up 55.1% on last year. The high end is fine.
6. Is the slowdown in houses or condos?
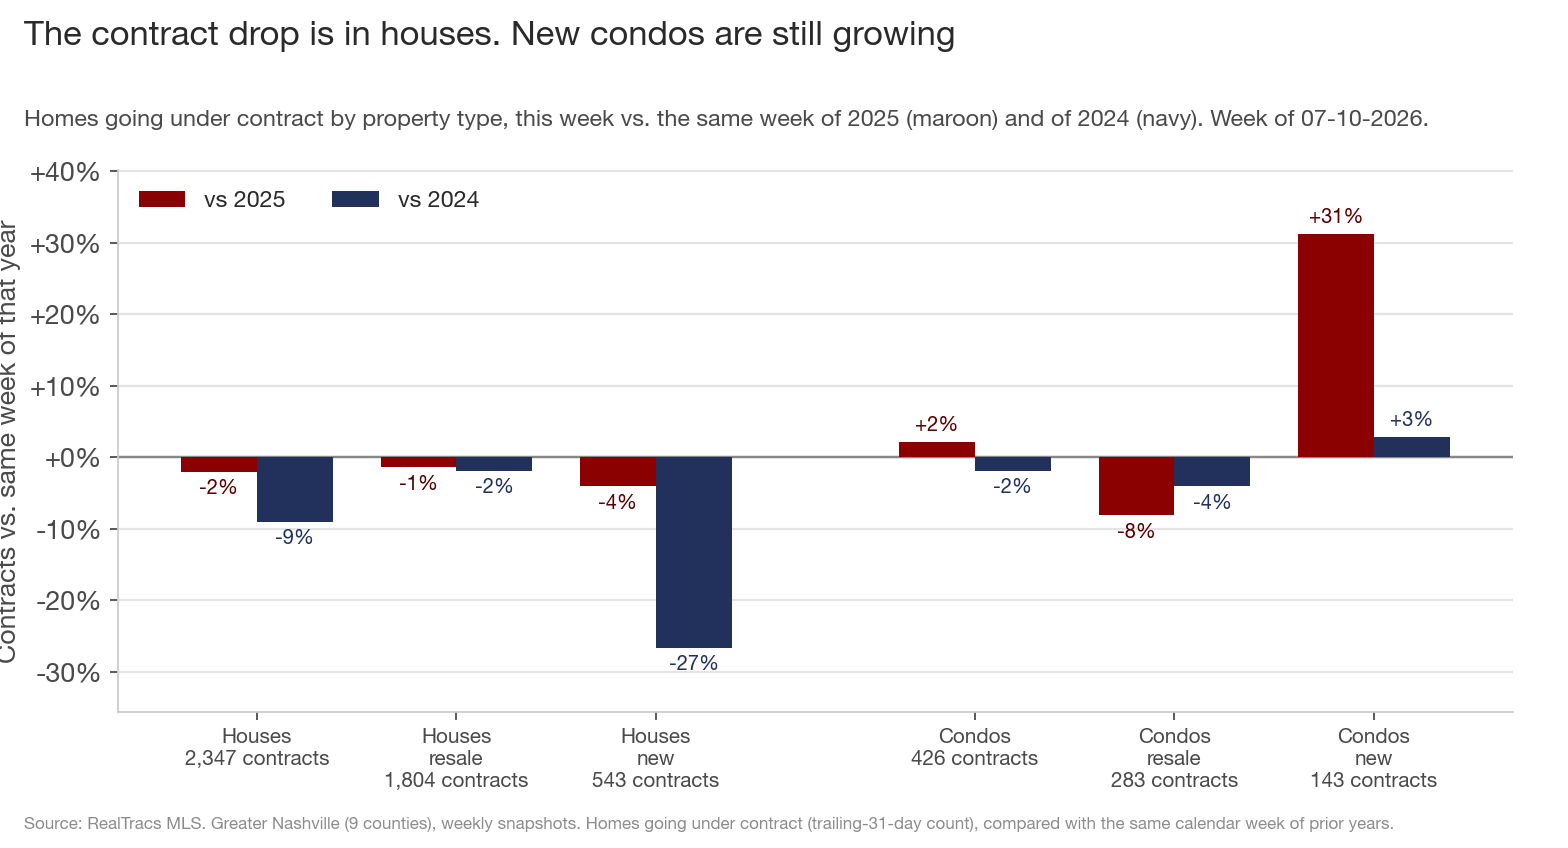
Houses. Single-family accounts for -232 of the metro's 240-contract gap vs 2024; condos account for -8. Inside single-family, resale is 1.9% below 2024 and newly built houses are 26.6% below. The entry ranges are the weakest: single-family under $300K is 19.7% below 2024 and $300K-$500K is 17.1% below.
Condo demand is nearly flat (+2.2% vs 2025, -1.8% vs 2024), and new condos are still growing: +31.2% vs 2025 and +2.9% vs 2024, the one property-type segment above both years. Condos slowed too (they were 13.3% above 2024 four weeks ago), but far less than houses. One likely reason: condos are where the affordable listings are (the July 4 post), so buyers priced out of a starter house still have condos to choose from. The catch for condo sellers: flat demand is meeting 2,660 active condo listings, up 21.1% in a year, which keeps condos a buyer's market at 6.2 months of supply.
7. Which counties are still above 2024?
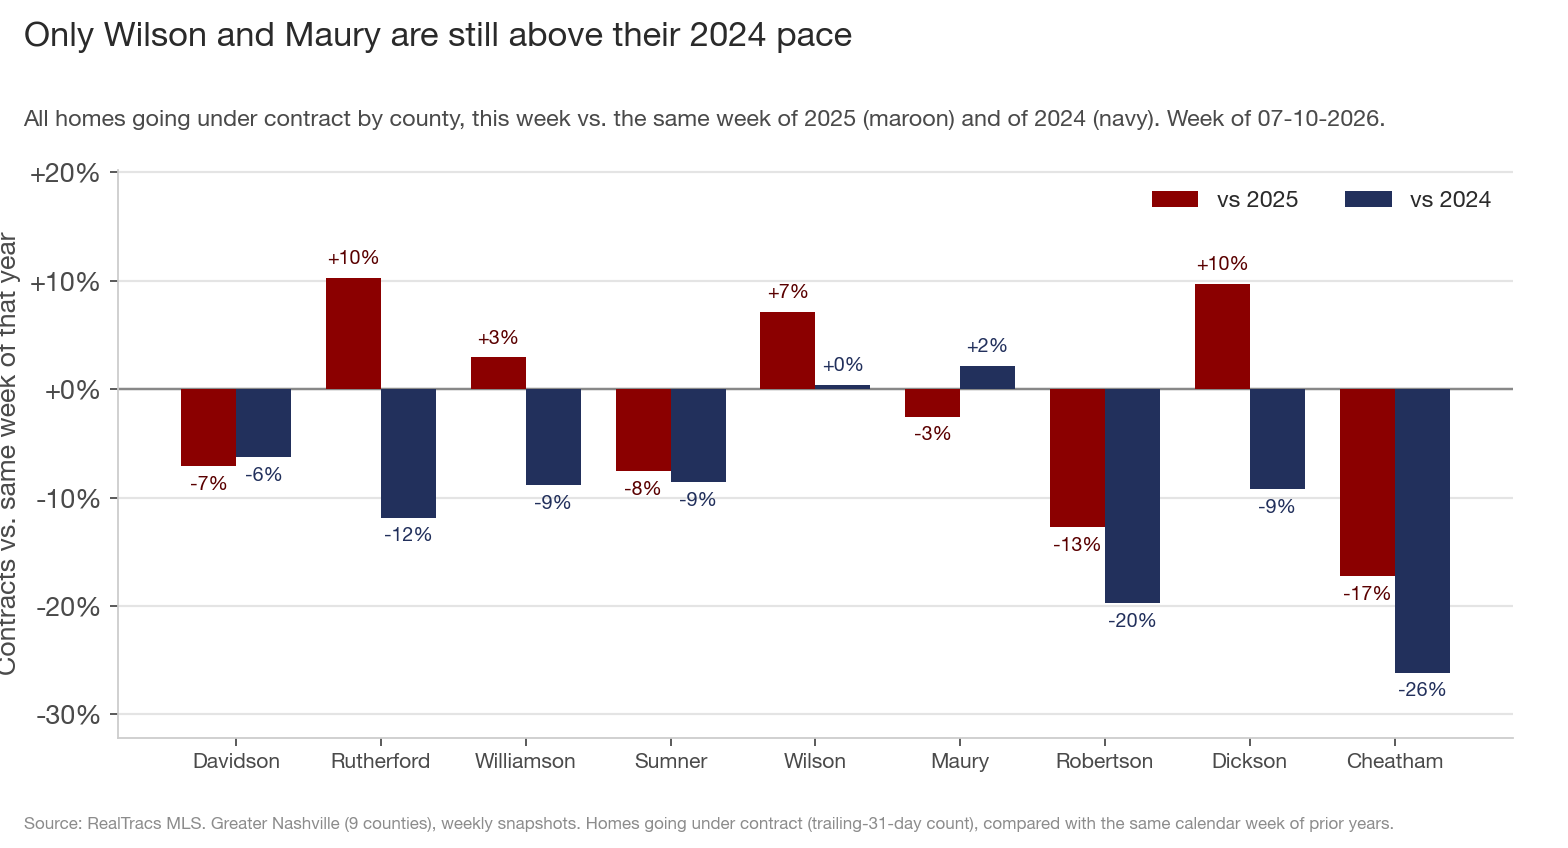
Only Wilson (+0.4%) and Maury (+2.1%), and barely. Rutherford went from 14.7% above 2024 on June 10 to 11.8% below, the largest drop among the counties that post named (resale -10.1%, new construction -15.2%). Williamson is 8.9% below. Sumner is 8.6% below. Robertson moved the most of any county, from 25% above to 19.7% below in four weeks. (Cheatham is -26% on 48 contracts, too small to read.)
Davidson is the one county that improved. Its resale market is nearly even with 2024 (-1.4%), so the drag is its builders (-25.6%). Even so, its 643 single-family contracts are the fewest for this calendar week in the four years of data (2024: 698, 2025: 710, 2023: 737).
8. What is happening inside Davidson, Wilson, and Sumner?
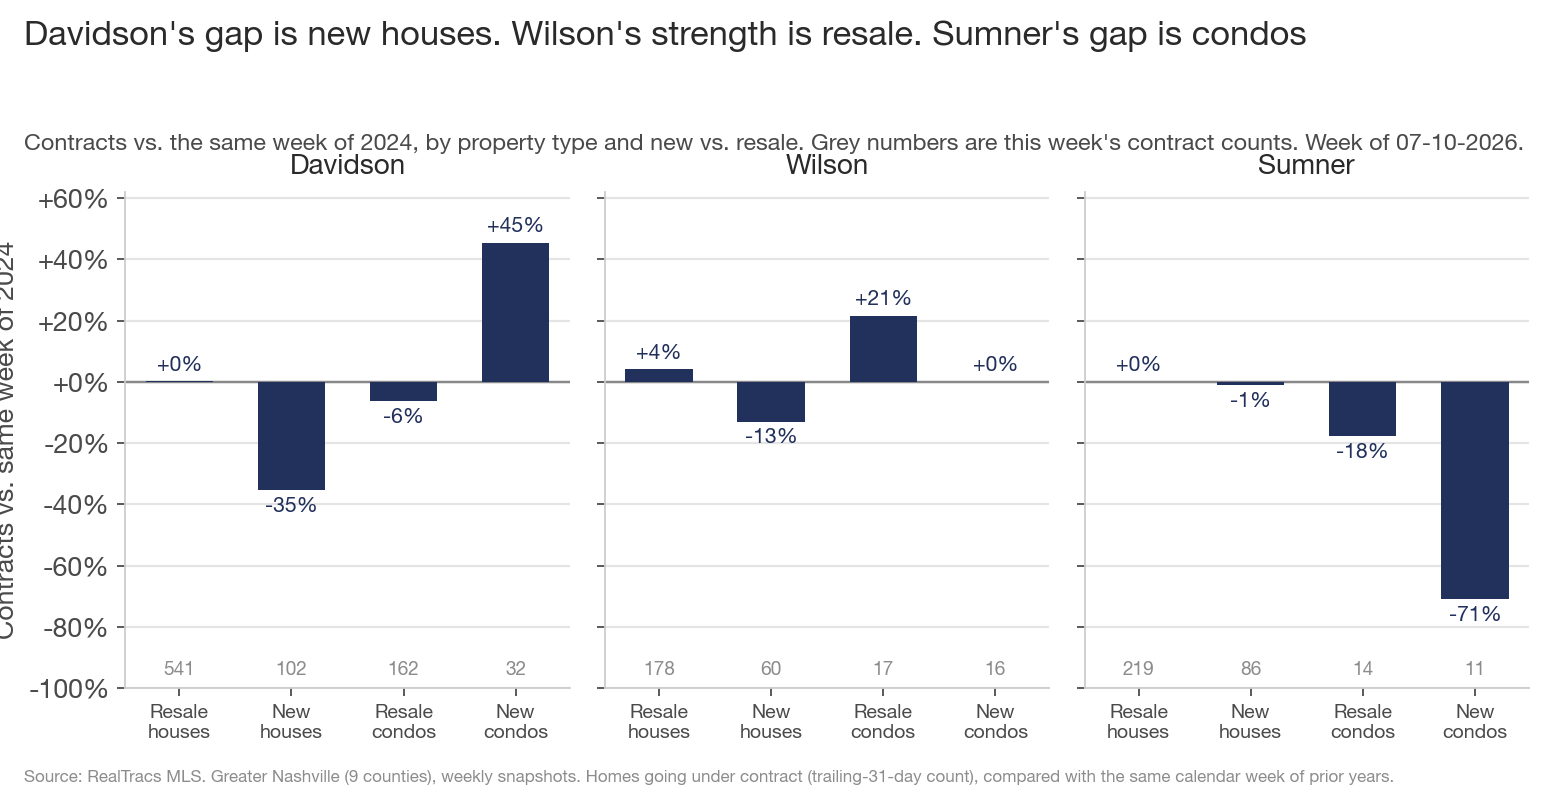
These three stand out in section 7 for different reasons: Davidson improved while staying negative, Wilson is the only clear positive, and Sumner is weak against both years. Split each by property type and price and the three stories are different.
Davidson (-6.3% vs 2024): the gap is new houses. Newly built houses are 35.4% below 2024, a loss of 56 contracts, which is the county's entire gap. Resale houses match 2024 (+0.2%) and condos are level (-0.5%). By price, $1M-$2M is up 44.8% while every range from $300K to $1M is down 8 to 15%. Davidson's 643 single-family contracts are the fewest for this week in the four years of data, and the shortfall traces to the same source: builders.
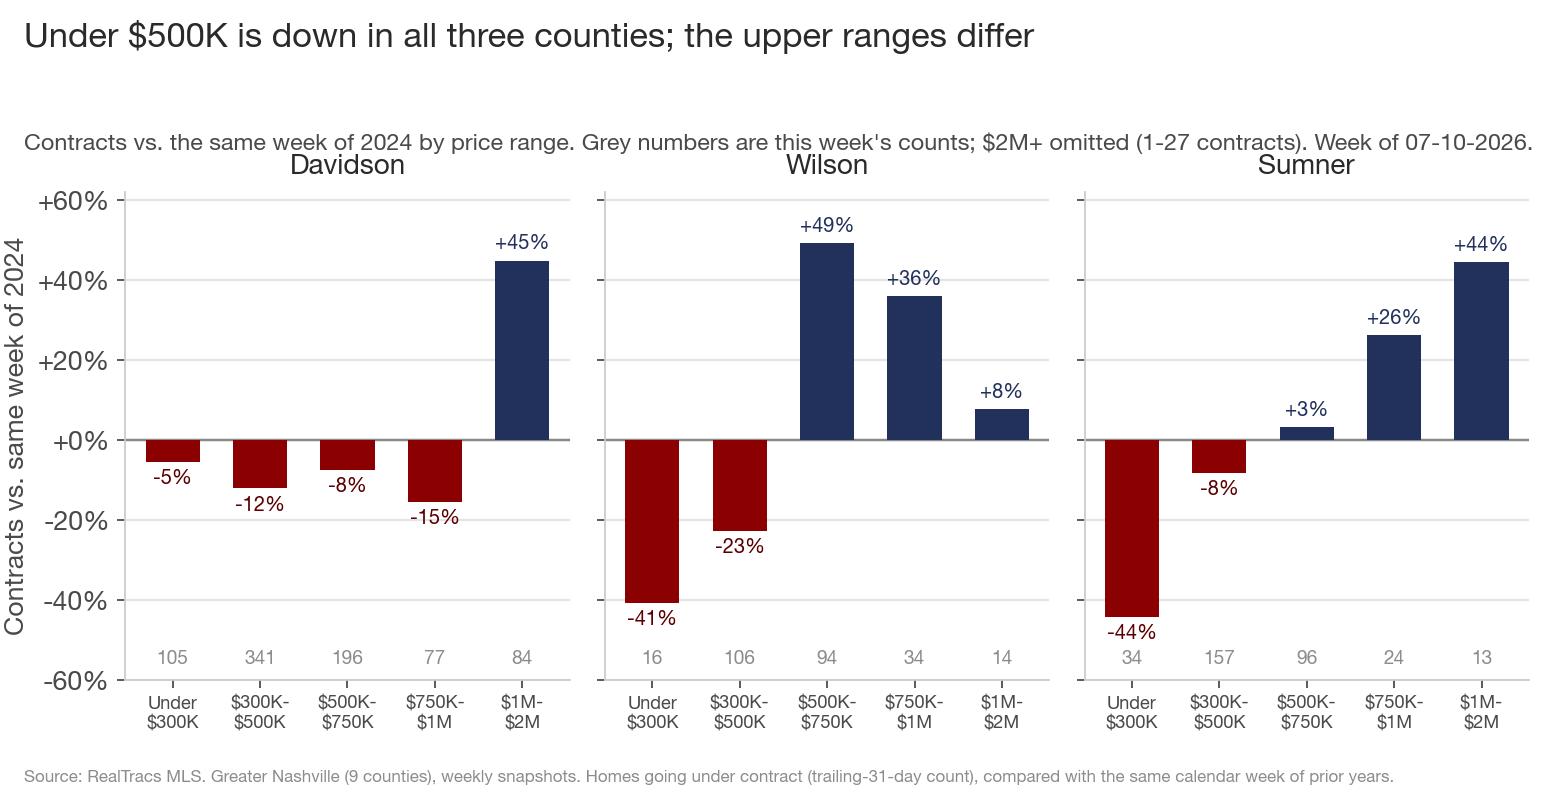
Wilson (+0.4% vs 2024): move-up resale is carrying it. Resale contracts are 5.4% above 2024 and 15.4% above 2025, the strongest resale growth of any county. The price detail: Wilson lost contracts under $500K (-22.6% at $300K-$500K) and gained the same number back at $500K-$750K (+49.2%, +31 contracts against -31 below it), with $750K-$1M up 36%. New construction is 10.6% below 2024. Wilson is also the only one of the three whose supply ratio is unchanged from last year (3.9 months vs 3.8).
Sumner (-8.6% vs 2024): the county number misreads its houses. Single-family contracts match 2024 (-0.3%; resale houses exactly 0.0%). The entire gap is condos: 54.5% below 2024, a loss of 30 contracts out of the county's 31, and most of that is newly built condos, a small segment that fell from 38 contracts to 11. The same drop shows up as the under-$300K range falling 44.3%. Meanwhile Sumner's supply ratio rose from 3.2 to 4.1 months, the biggest increase of the three counties, because listings keep arriving (+17.5%) against demand that is flat at best.
9. Is the summer decline normal?
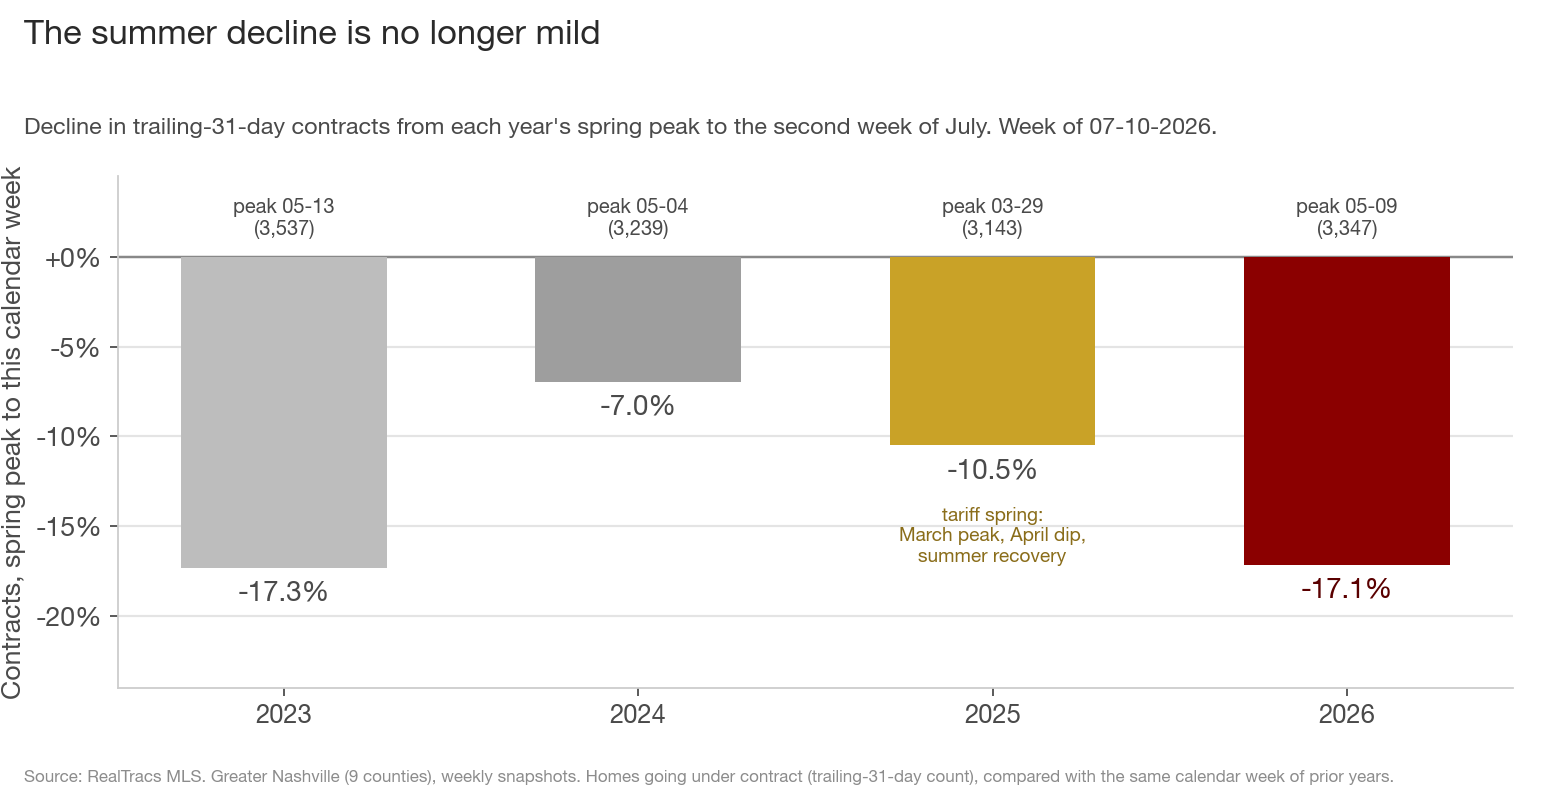
No. From the May 9 peak (3,347), 2026 is down 17.1%, more than twice 2024's decline (-7.0%) and nearly matching 2023's (-17.3%), the steepest in the data. Four weeks ago, 2026's decline from its peak was the mildest of the three normal years. The one steady reading: this week is 5.2% below 2023, still inside the range (-0.4% to -5.4%) that comparison has held all spring. This looks like a market stepping down to a lower level, with the weakness concentrated in new construction and the entry ranges.
10. Why did demand slow now?
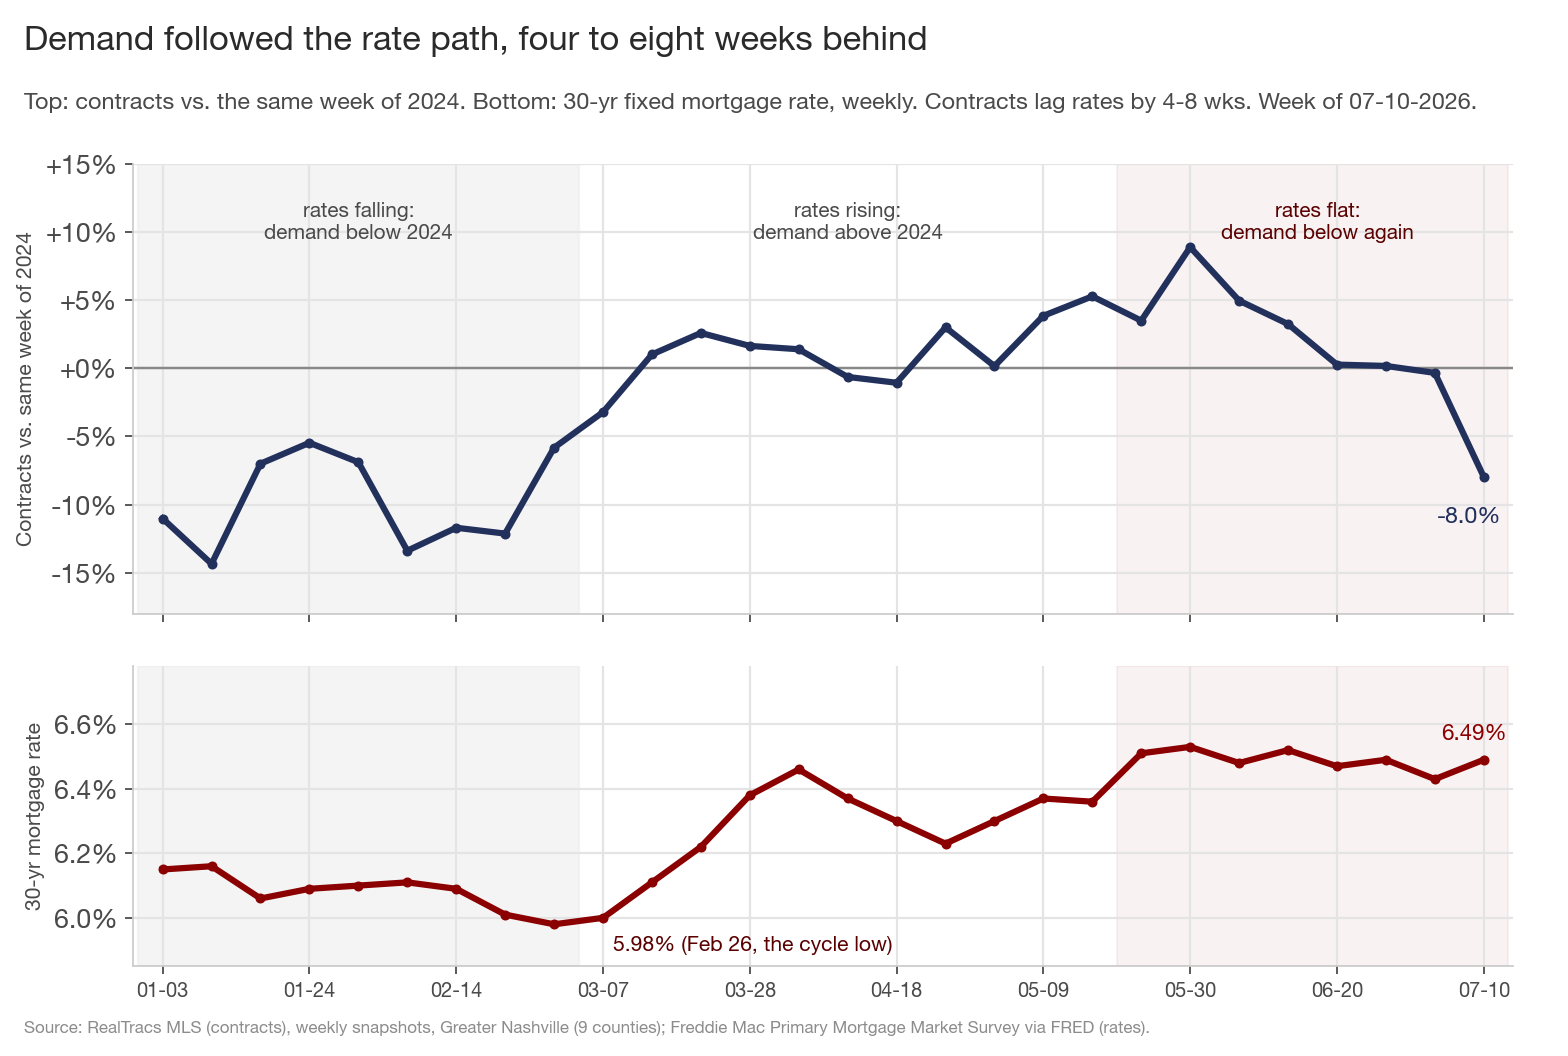
The 30-year fixed mortgage rate bottomed at 5.98% on February 26 (Freddie Mac's survey, the lowest of this cycle), rose about half a point after the Iran war began in late February, and has held between 6.43% and 6.53% since mid-May. Contracts respond to mortgage rates with a delay of four to eight weeks, the time it takes a buyer who saw a quote to become a pending sale in a trailing-31-day count.
Allow for that delay and 2026 has had three phases. While mortgage rates fell toward the February low, contracts averaged 8.9% below 2024 in January and 10.8% below in February; buyers had no reason to hurry. While rates rose off the low, buyers who had been waiting moved to lock before rates went higher: above 2024 every month from March through June, with resale averaging 7% above. Since rates went flat, the hurry is gone: the two July readings average 4.2% below 2024. A steady 6.5% pushes no one off the fence and gives no help on the payment.
Fall 2024 followed the same sequence. Mortgage rates bottomed at 6.08% in late September 2024, then rose three-quarters of a point by Thanksgiving. Contracts climbed the entire way, from 5.8% above 2023 to 17.8% above, then spent six to ten weeks well below normal once rates went flat (January 2025 was 11 to 16% below) before leveling off. The likely story now is the same: the spring pulled some summer buyers forward (roughly 2% above 2024 from March through June), the payback lands in July and August, and the builder shortfall in section 4 is a separate, older problem that a rate cycle will not fix.
What this adds up to
- Contracts fell below last year (-40, the first meaningful decline since February), right when the June 10 post said the comparison would turn negative.
- The drop is multiyear: 8.0% below 2024 and 5.2% below 2023. 2024's strong mid-July exaggerates that first number; four straight weeks below the spring range is the evidence.
- The gap is two problems: new construction (-193 contracts vs 2024) and resale under $500K (-115). Resale at $500K and up is +67, with the strength at $1M and up.
- Only Wilson and Maury are above 2024. Rutherford dropped 26 points in a month, Robertson moved the most of any county, and Davidson's weakness is now almost entirely its builders.
- The summer decline (-17.1% from peak) nearly matches 2023's, the steepest in the data.
- Houses drive it everywhere. Single-family is -232 of the -240 gap vs 2024; condo demand is flat and new condos are growing. Davidson's gap is new houses, Wilson stays above 2024 on \$500K-\$1M resale, and Sumner's gap is almost entirely condos while its houses match 2024.
- The timing follows the mortgage rate path. Demand ran above 2024 while rates rose off February's 5.98% low, and slowed once rates went flat near 6.5%. Fall 2024 did the same, and its weak stretch lasted six to ten weeks.
For sellers: under $500K or competing with new construction, you are in the two weak segments; price on 2024 comparables. In resale above $1M, demand is well ahead of 2024 (+81% on luxury closings). For buyers: leverage is in new construction (builders signed 22% fewer contracts than 2024 and their price cuts just moved above last year's, 635 vs 597), in Rutherford, in condos (6.2 months of supply metro-wide), and under $500K. For agents: quote two comparison years in every CMA this month; the $2M+ example in section 5 shows why.
The next checkpoint, stated in advance like the last one: two more July readings remain, around July 17 and July 24. Below 2024 through both and the slowdown is confirmed; back above +3% and this week was the distorted comparison plus a holiday week. The cleanest number to watch is resale-only contracts vs 2024, 2.2% below this week, its first time under zero since at least early April. If the fall-2024 pattern repeats, the weakest readings come now, in July and August, and that resale number levels off between -3% and zero by early September. Falling below that range means something bigger than payback. Either way, expect August and September new-construction closings to be weak vs 2024, because the contracts that become those closings are already 22% short.
Data through the week ending July 10, 2026, Greater Nashville (9 counties: Davidson, Williamson, Rutherford, Wilson, Sumner, Maury, Dickson, Cheatham, Robertson). Contracts are a trailing-31-day count of homes going under contract, compared with the same calendar week of prior years. Source: RealTracs MLS. Mortgage rates: Freddie Mac Primary Mortgage Market Survey.