Greater Nashville REALTORS just posted June's numbers, and the headline is another record: the median home price came in at $537,000, up from $528,000 a year ago (+1.7%), on 2,785 closings versus 2,573 last June (+8.2%). More homes sold, at a higher typical price. On its face that is a market heating back up.
Here is the paradox. The constant-quality home-value indexes for the same market did not rise over that same year. Zillow's Home Value Index for Nashville sits around $424,000 in the city, down 0.3%, and about $451,000 across the metro, down 0.1%. So the typical home is worth roughly what it was a year ago, if anything a hair less, at the exact moment the median set a record. Both of those are true, and the gap between them is the whole story: a median measures what sells, and what sells has moved upmarket. Sellers of an ordinary home are getting about what they would have a year ago, while buyers are writing bigger checks because the affordable end of the market has thinned out.
This post reconciles the two with four charts: the record itself (the first is slide 3 of this week's video), why the mix lifted it, what per-foot value actually did, and the full gap from the headline to the home.
1. Single-family sale prices set a June record at $545K
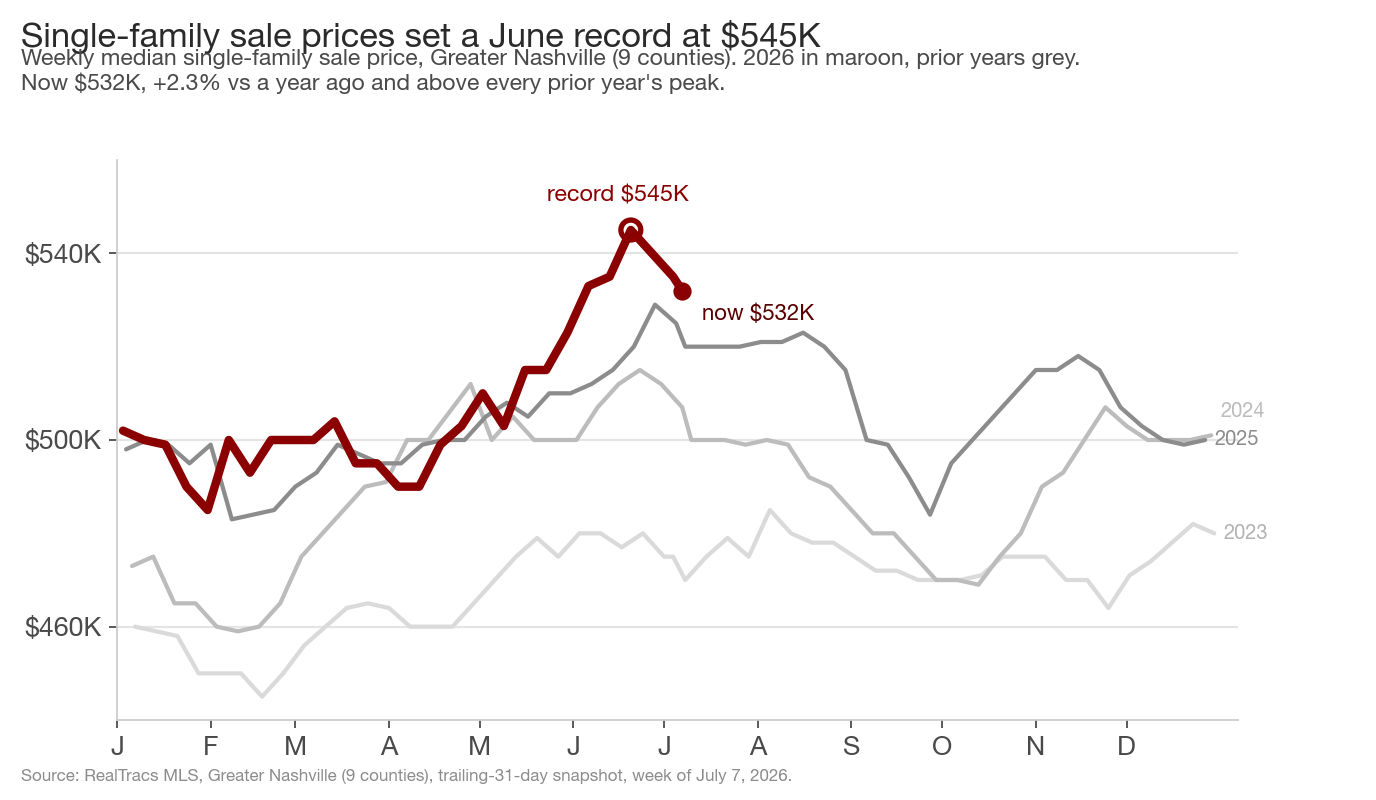
The weekly median single-family sale price climbed to a peak of $545,000 in June (the week of the 20th), the highest single-family median in the four years of data I track, above 2025's $529,000, 2024's $515,000, and 2023's $485,000. It has since eased to $532,000, still +2.3% versus a year ago.
GNR's June figure ($537K) and my single-family series ($545K at its June peak) draw on the same RealTracs data; the difference is timing, GNR's full calendar-month close against my trailing-31-day window. Both show the same June record, with the typical closed price higher than last year. How can there be a record in median price while home values drop?
2. The mix of sales shifted toward pricier homes
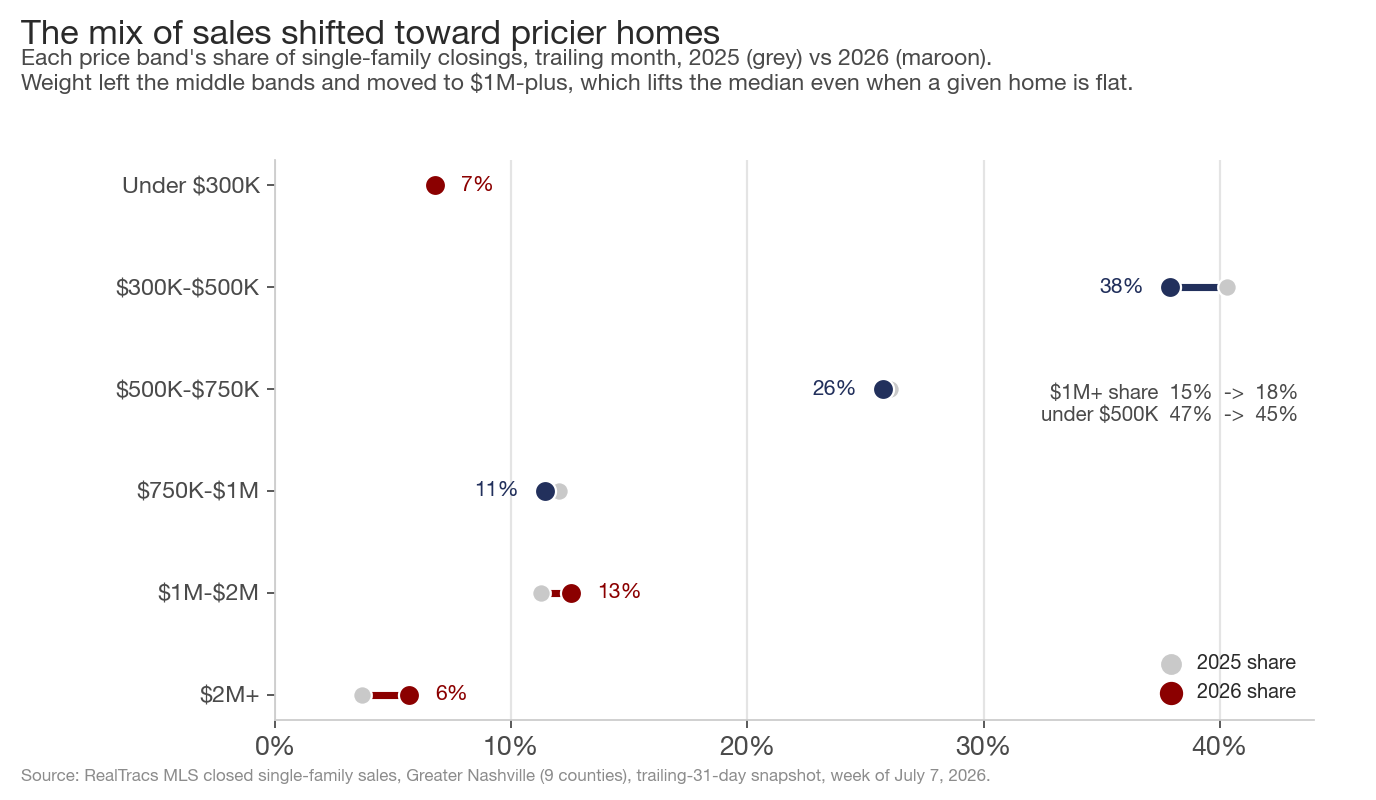
A median is a composition statistic. It rises when a given home appreciates, and it rises when the mix of what sells tilts toward pricier homes, with no individual home changing value at all. From the outside the two look identical. In Greater Nashville right now it is mostly the second.
Sort single-family closings into price bands and the weight has moved up the ladder in a single year. Homes at $1M and above went from 15.0% to 18.2% of single-family closings; the $2M-plus band alone went from 3.7% to 5.7% of sales (87 to 139 closings), the biggest share gain of any band. At the other end, under $500K fell from 47.0% to 44.6% of single-family sales. The homes that trade are also physically bigger: implied median single-family size (the median price divided by the median price per foot) rose from about 2,080 to 2,120 square feet. When bigger, more expensive homes are a growing share of the pool, the median climbs even if no home on any given street is worth an extra dollar.
3. Measured per square foot, single-family values barely moved
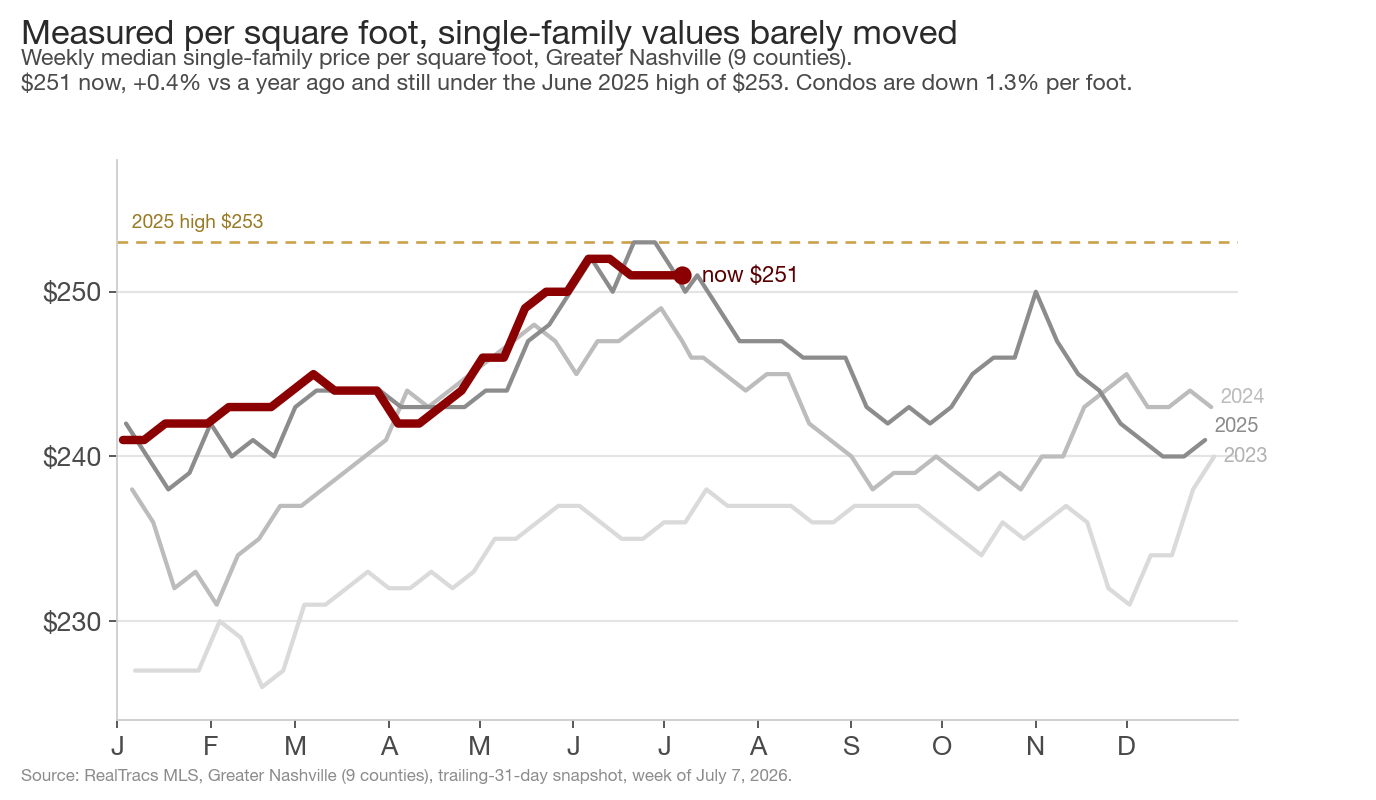
Now strip the mix back out by measuring per square foot, which holds home size roughly constant. Single-family price per foot is $251, up just +0.4% in a year, a fraction of the median's climb, and it is still sitting below its June 2025 high of $253. On a per-foot basis, single-family value has essentially plateaued for a full year.
Condos, which I always break out separately, are down 1.3% per foot, at a median of $346,000. Zillow's repeat-weighted index, which holds a home's size and quality fixed, tells the same story: down 0.3% in the city and 0.1% across the metro. Even Davidson County, whose county median sits at $550,000 (+5.8%), shows per-foot value up only 0.4%. Put the record median from chart 1 next to this flat per-foot line and the paradox dissolves. The median set a high because the mix went upscale, while the value of a fixed home went sideways.
4. Strip out size and mix, and the record fades to flat
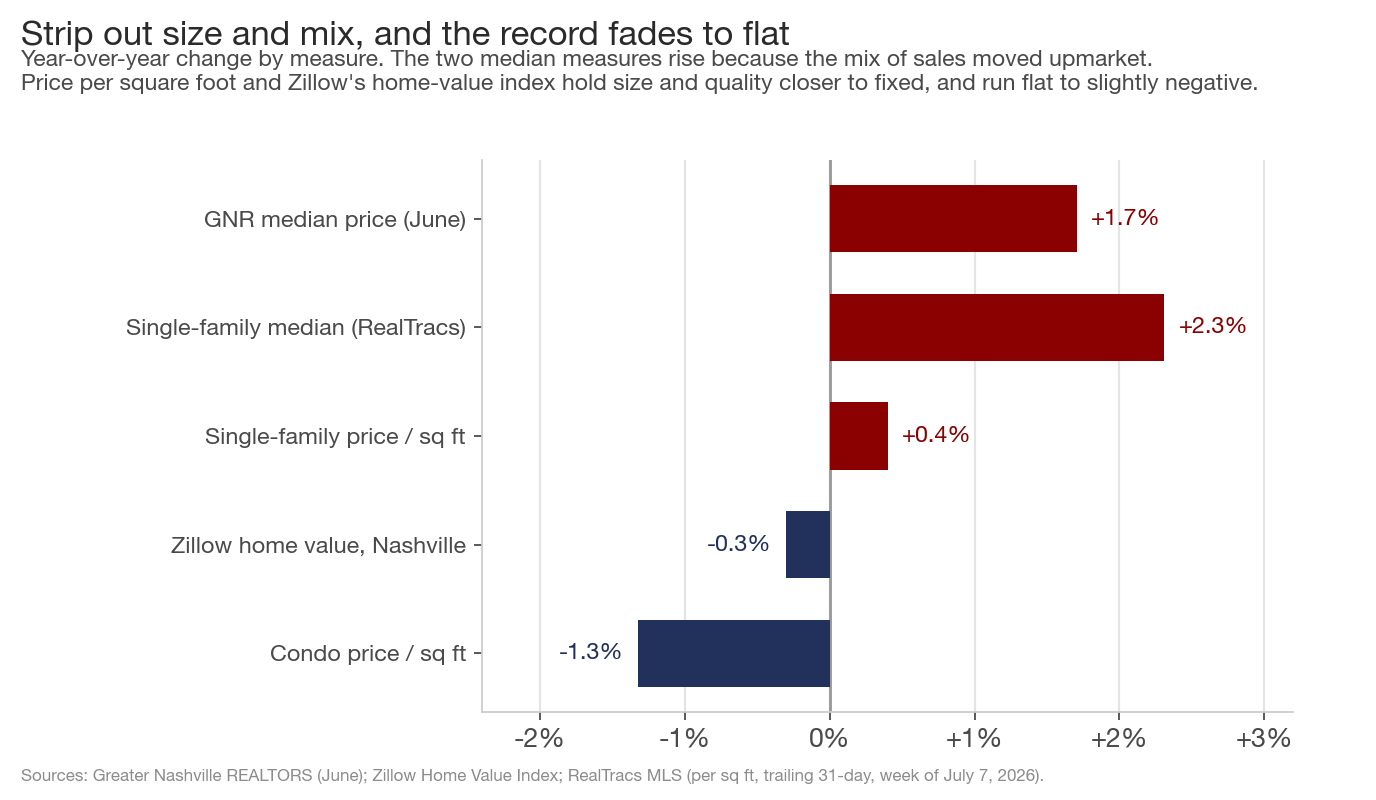
Line every price measure up by how much it moved in a year and the pattern is a clean descent. GNR's June median +1.7%, my single-family median +2.3%, single-family per foot +0.4%, Zillow's index −0.3%, condo per foot −1.3%. The measures that let the mix float upward are positive. The measures that hold a home's size and quality constant are flat to negative. Same market, measured two ways, and the two ways disagree by roughly three percentage points.
A seller of an ordinary Nashville home is getting about what they would have a year ago, give or take a fraction of a percent, no matter what the record headline says. Buyers are spending more in aggregate because the cheap end of the market has thinned out and the homes that actually clear are bigger and pricier than the ones that cleared last June. The record and the flat value are not in conflict. They are the same set of sales, read through a headline number that rewards an upmarket mix.
What this adds up to
- The record is real. GNR's June median of $537K (+1.7%) came with 8.2% more closings, and my single-family series shows the same June record, peaking at $545K.
- Constant-quality value did not rise. Zillow is down 0.1% to 0.3%, single-family price per foot is up just 0.4% and still under last year's high, and condo per foot is down 1.3%.
- The gap is mix. The $1M-plus share of single-family sales went from 15.0% to 18.2%, the $2M-plus share rose to 5.7% from 3.7% (87 to 139 closings), under-$500K fell to 44.6%, and the typical sold home is about 1.9% bigger.
- The softness sits in condos and the entry level. Single-family houses are flat-to-firm per foot; the give-back is concentrated in attached product and the vanishing affordable tier.
For sellers, the takeaway is that a record regional median does not mean your specific house is worth more than it was last summer; price to the per-foot reality, and that goes double for a condo or townhome. For buyers, you are paying more because the affordable options that used to anchor the bottom of the market are gone from the mix, even though the homes themselves have not appreciated. For agents, quote price per foot and a home-value index next to the median, because a composition statistic on its own will mislead a client in either direction.
Here is the falsifiable part. If the record is mix and value is genuinely flat, single-family price per foot should hover near $251 and stay below the $253 high while the median keeps printing records on composition alone. The signal that real appreciation has resumed is per foot breaking clearly above $253 and Zillow's index turning positive. If instead the median rolls over in the fall while per foot holds, that is the mix normalizing while values stay put. Either way, the per-foot line will tell you more than the median headline.
Data through the week ending July 7, 2026, Greater Nashville (9 counties: Davidson, Williamson, Rutherford, Wilson, Sumner, Maury, Dickson, Cheatham, Robertson). Sources: RealTracs MLS; Greater Nashville REALTORS (monthly home sales report); Zillow Home Value Index.