On May 14 I flagged that new-construction pendings had turned positive while the closings hadn't caught up — the recovery was a forward signal that hadn't shown up at the closing table yet. Three weeks later, it has. New-construction closings are now running +9.4% year-over-year — 712 vs 651 at the same week in 2025 — the third straight week in positive territory after sitting 33 listings behind a month ago.
But the honest version of this story is more interesting than "recovery." The pending pace that powered this has already cooled, the year is still running behind 2025, and the most durable shift may be the one on the supply side. Here's the full picture — including the part that keeps me cautious.
1. The handoff: pendings led in the spring, closings have now caught up
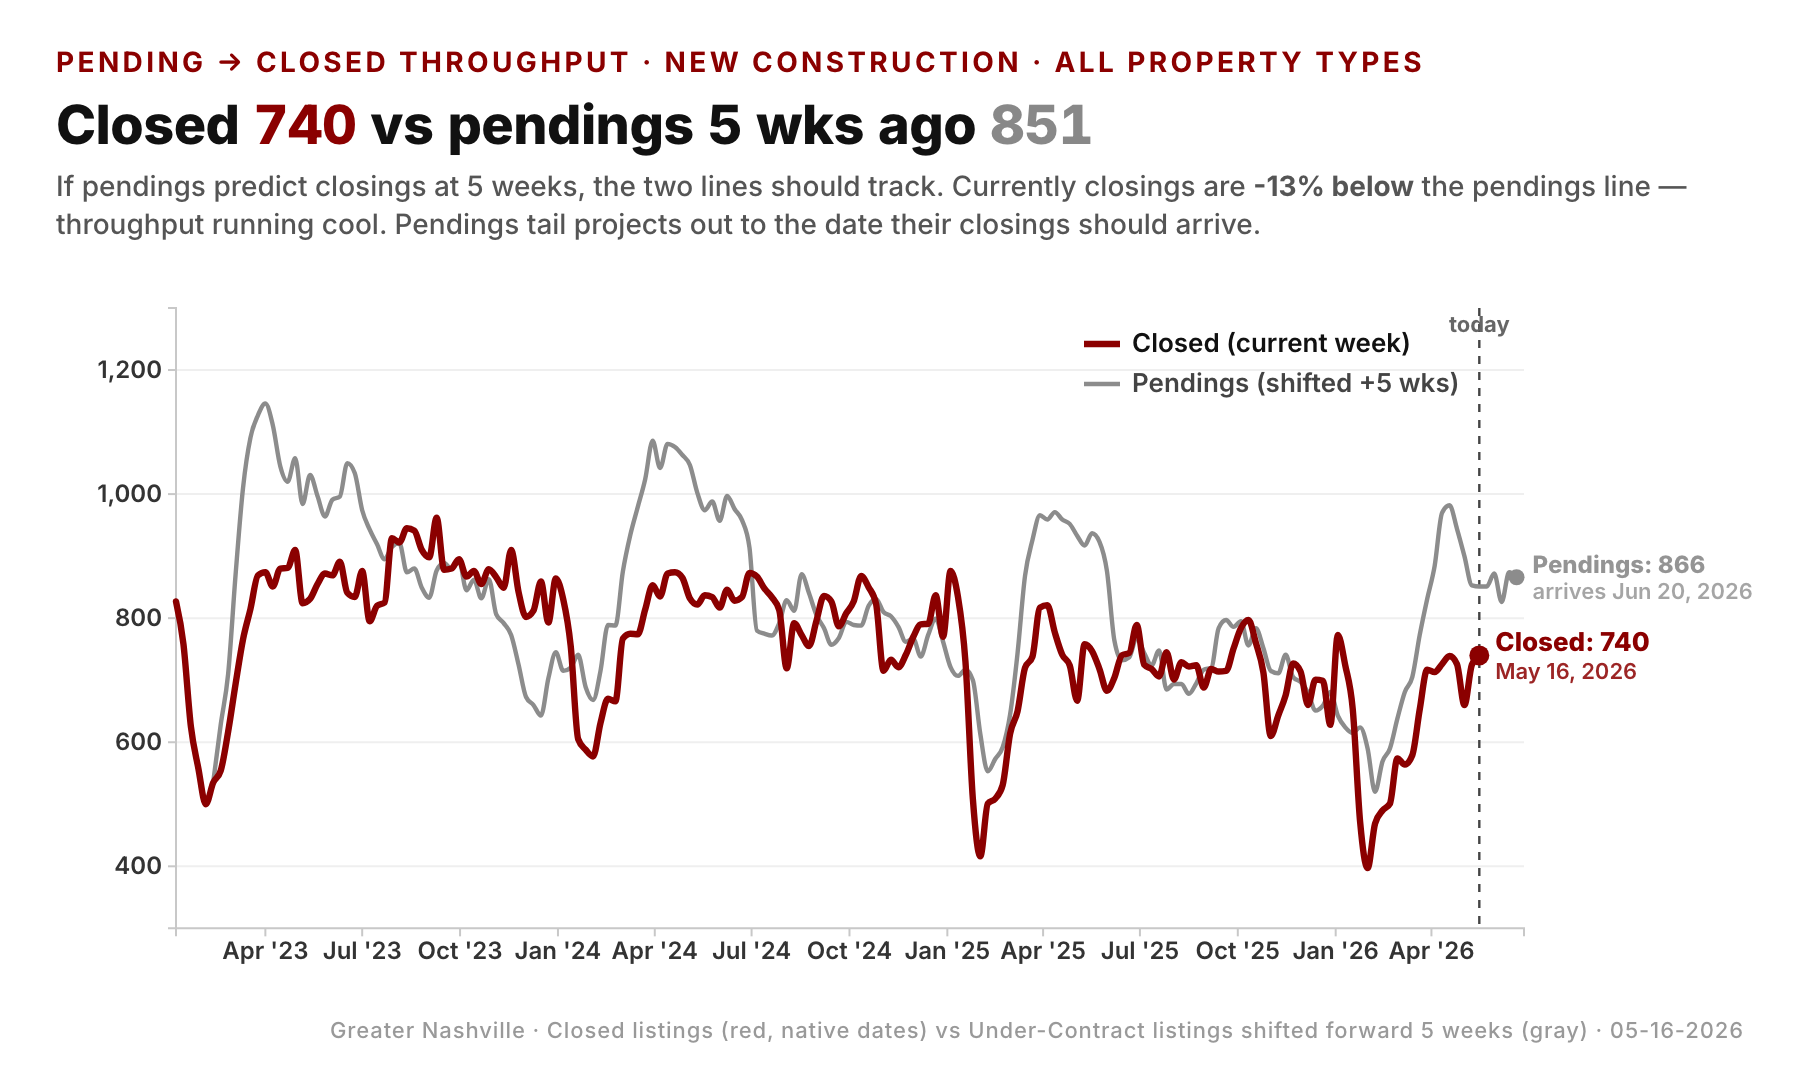
This is the chart I wish I'd been able to show on May 14. New-construction contracts and closings move on a lag — a contract signed in April closes six to eight weeks later — so the pending line leads and the closed line follows. Through mid-April, contracts were actually negative YoY (−7% to −9%). Then they surged: +19.4% by May 9, the spike I wrote about last month.
That wave has now reached the closing table. New-construction closings went from −33 four weeks ago to +41, then +66, then +61 over the last three weeks — a clean, sustained crossover, not a one-week blip. At 712 vs 651 a year ago, new construction made up 22.6% of all metro closings this week. The forward signal turned into a real number.
2. The four-year context: a recovery toward 2024, not back to the boom
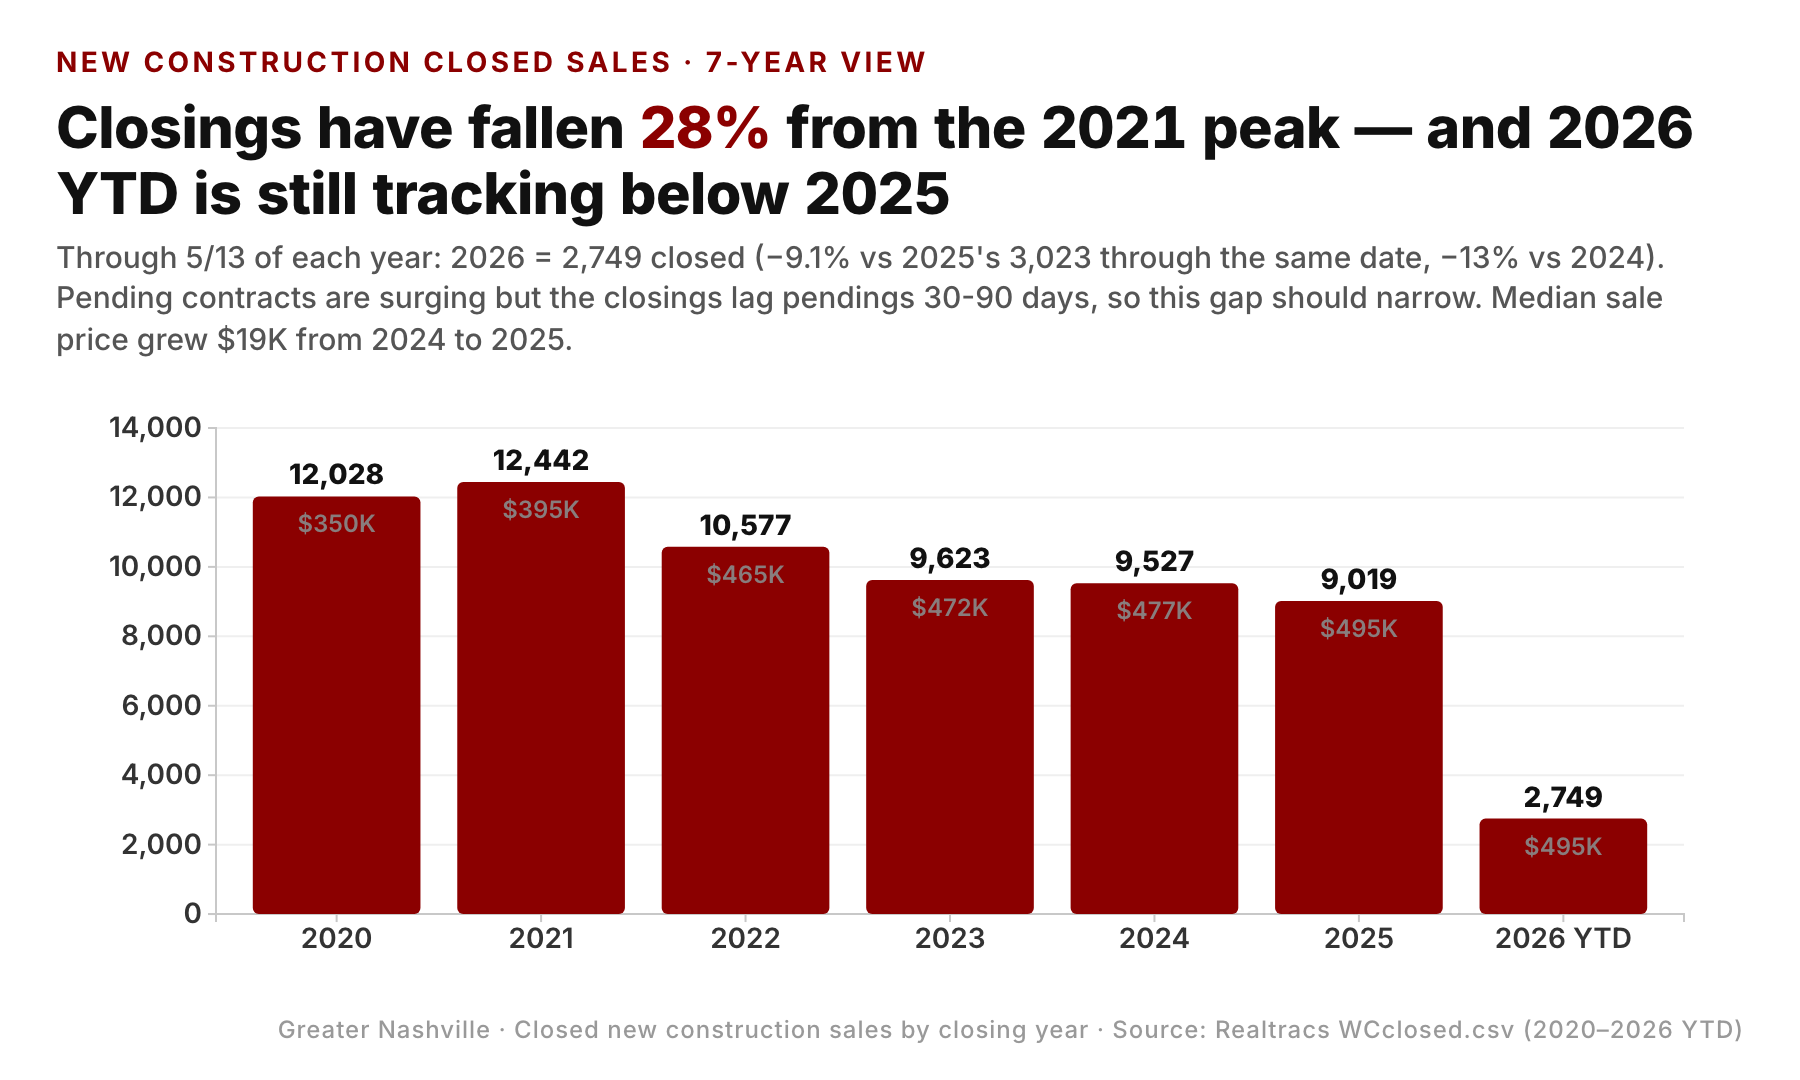
Here's the discipline I owe you after last month's post. A positive YoY week is not a positive year. Stack the four years and 2026 is now above the 2025 line — but it still sits below both 2023 and 2024 at this same calendar position. Year-to-date, new-construction closings are running about 5.8% behind 2025's pace, and further behind 2024 and 2023.
The encouraging part is the direction. That year-to-date deficit was about −9% in mid-May — the number I cited in the last post — and it has narrowed every single week since, to −5.8% now. The recovery is real, it's steady, and it's measurable. It's just a recovery toward the 2024 baseline, not the 2021–2023 builder boom. And note what it is not: a price story. The new-construction median is roughly $490K, down slightly from $500K a year ago — builders are moving volume at flat-to-softening prices, which usually means incentives are doing the work.
3. The caution flag: the pipeline that fed this has already cooled
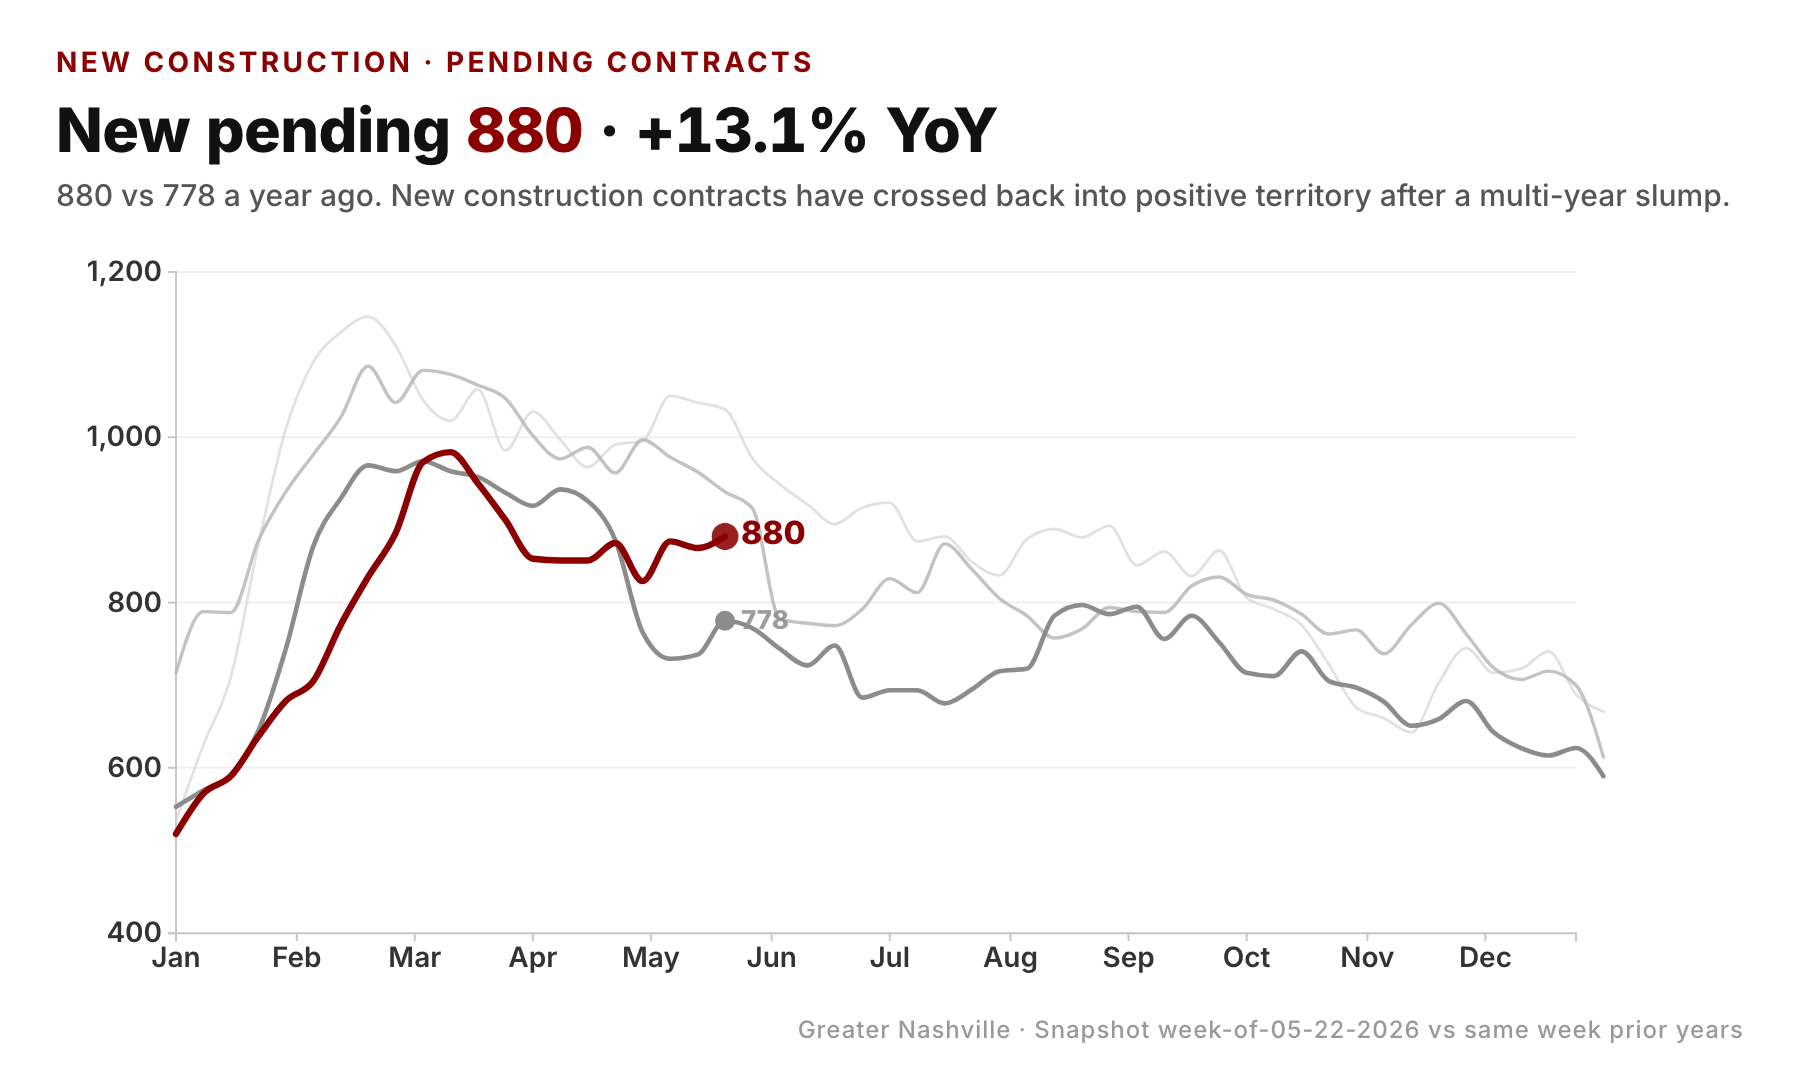
This is the part I don't want to gloss over. The closings rebound is April's contracts converting — and that pending wave has already crested. New-construction contracts have cooled from +19.4% on May 9 to +5.8% this week. Still positive, but back near flat.
That matters because closings are a rear-view mirror. The +9% we're celebrating reflects the strong contracts of six weeks ago. What feeds the next leg of closings is the contracts being written now — and those are running at a third of the spring pace. If summer pendings keep drifting toward flat, this closings recovery plateaus by late summer rather than building. The pending pace is the leading indicator to watch, and right now it's telling a more measured story than the closings are.
4. The supply tell: new inventory just flipped to a year-over-year decline
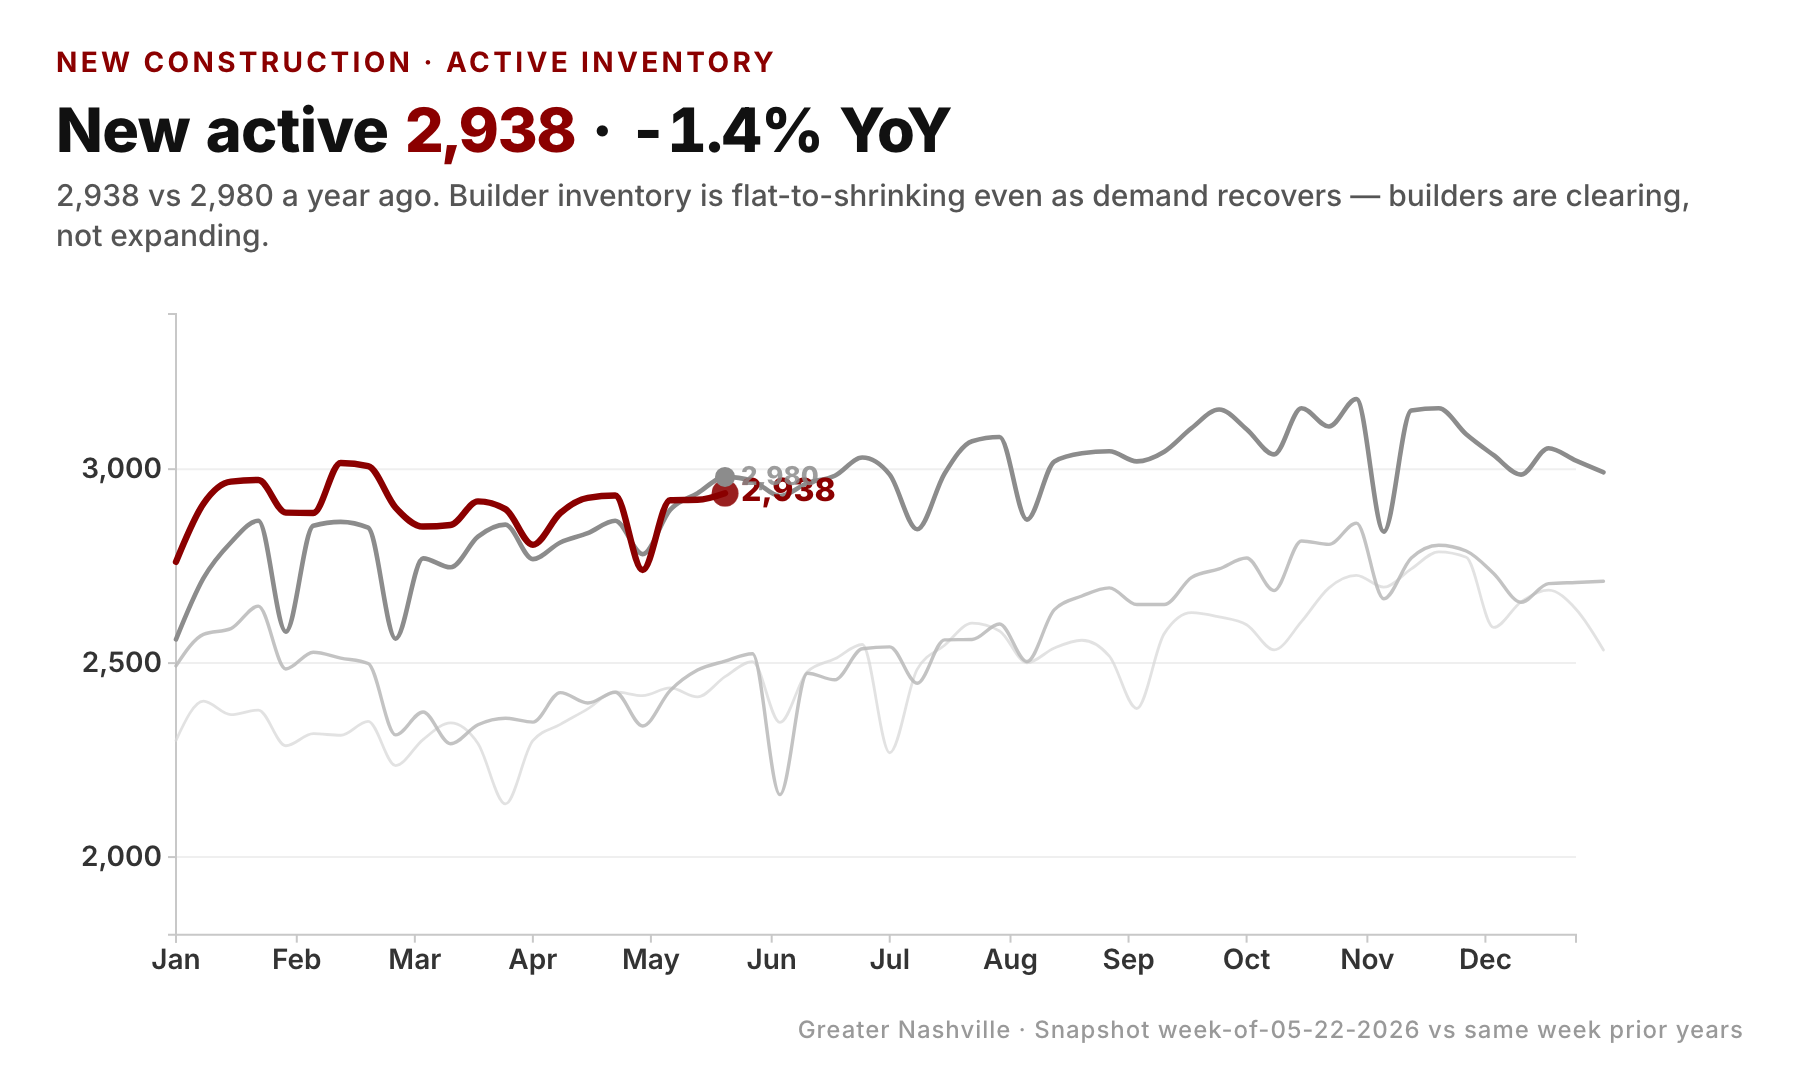
Here's the shift I think is the most structural — and the most overlooked. New-construction active inventory just turned negative YoY: 2,783 listings vs 2,834 a year ago, −1.8%. It drifted from positive into negative over the past month and is now at its widest deficit of the year.
That's striking because it runs exactly opposite to existing homes, where active inventory is +11.3% YoY (8,800 vs 7,904) and still climbing — a 13-point divergence between the two supply markets. Builders aren't sitting on a growing pile of standing inventory the way resale sellers are; they're clearing it. That's why closings can rise even as the pending pace cools: the absorption is coming partly out of existing standing stock. A tightening inventory line is a more durable signal than a single hot month of closings — it says the overhang that defined new construction for two years is actually working off.
What this adds up to
- Closings caught up. New-construction closings are +9.4% YoY (712 vs 651), positive for the third straight week — the pending surge I flagged in May has reached the closing table.
- But the year is still behind. Year-to-date closings are −5.8% vs 2025, a recovery toward the 2024 baseline, not back to the boom. The honest frame is "the gap is closing," not "new construction is up."
- The pipeline has cooled. Contracts fell from +19.4% to +5.8% in four weeks. The fuel for the next leg of closings is thinner than what produced this one.
- The supply side is tightening. New active inventory flipped to −1.8% YoY while existing built to +11.3% — the most structural part of the story, and the reason absorption held up.
- It's volume, not pricing power. New-construction median is flat-to-down (~$490K), so this is builders moving units, not regaining leverage.
For buyers, new construction is still the segment where incentives are live and standing inventory is thinning — the best window to negotiate may be narrowing. For builders, the inventory drawdown is the good news; the cooling contract pace is the warning. For sellers of existing homes, the divergence is the uncomfortable part: your competition is growing (+11.3%) while the new-construction overhang shrinks.
Here's the falsifiable part to check in 30–60 days. The year-to-date deficit has narrowed about 0.7 points per week for two months (−9% → −5.8%). If that pace holds, new-construction closings pull even with 2025 around late July to early August. But that only happens if summer contracts firm back up — at the current +5.8% pending pace, the more likely outcome is the YTD gap stalls in the −3% to −4% range and closings plateau. Watch two lines: the New-construction contract YoY (does it firm or keep cooling?) and New active inventory (does it stay negative?). If contracts firm and active stays negative, this is a genuine turn. If contracts keep cooling while active rebuilds, June was the peak.
Data through week ending June 3, 2026, Greater Nashville (9 counties: Davidson, Williamson, Rutherford, Wilson, Sumner, Maury, Dickson, Cheatham, Robertson). Counts are trailing-window tallies compared to the same week of the prior year. Source: market_pulse_yoy_data.json.