Two cities ran the same pandemic playbook. Both were Sun Belt magnets, both drew remote workers and corporate relocations, both saw home values rocket into the summer of 2022. Then the same mortgage-rate shock hit both at the same time. So why is Nashville sitting 1.9% below its all-time peak while Austin is still 26.1% below its own? Why did two markets that looked like twins in 2021 end up this far apart?
This post does not answer that. It lays out what the data shows, then asks what could be behind it. Every number here comes from the Zillow Home Value Index for single-family homes.
1. How far ahead of the country is Nashville, really?
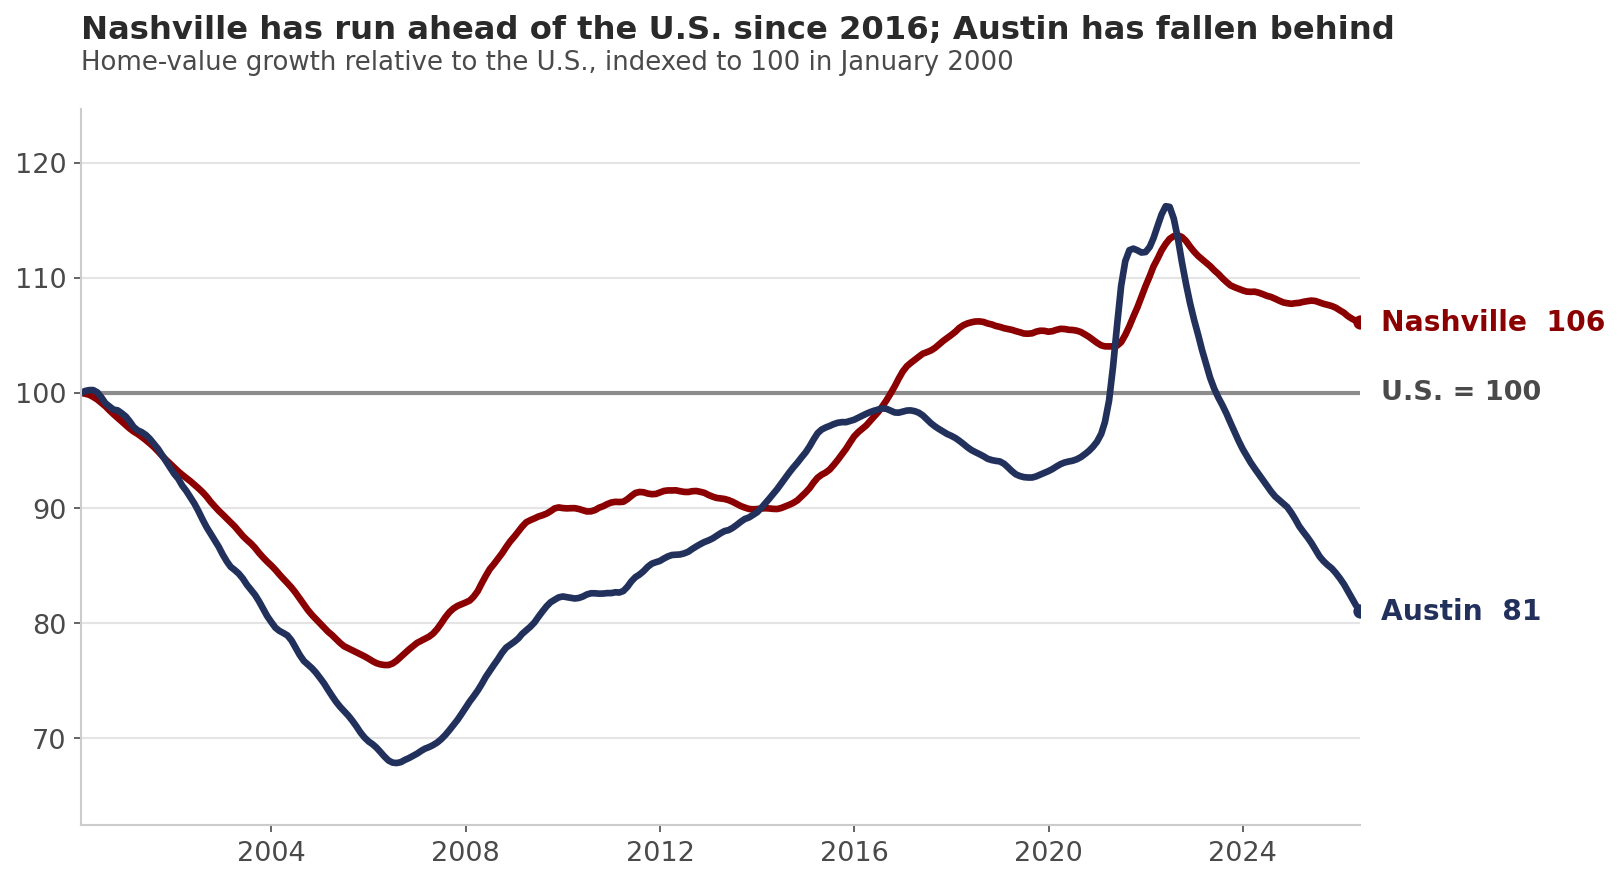
Set every metro to 100 in January 2000 and watch the lines climb. Nashville reaches an index of 317 by May 2026. The United States reaches 299. That gap is the whole claim: Nashville home values have grown +217.1% over 25 years against +198.7% for the country, leaving Nashville +6.1% ahead of the national benchmark.
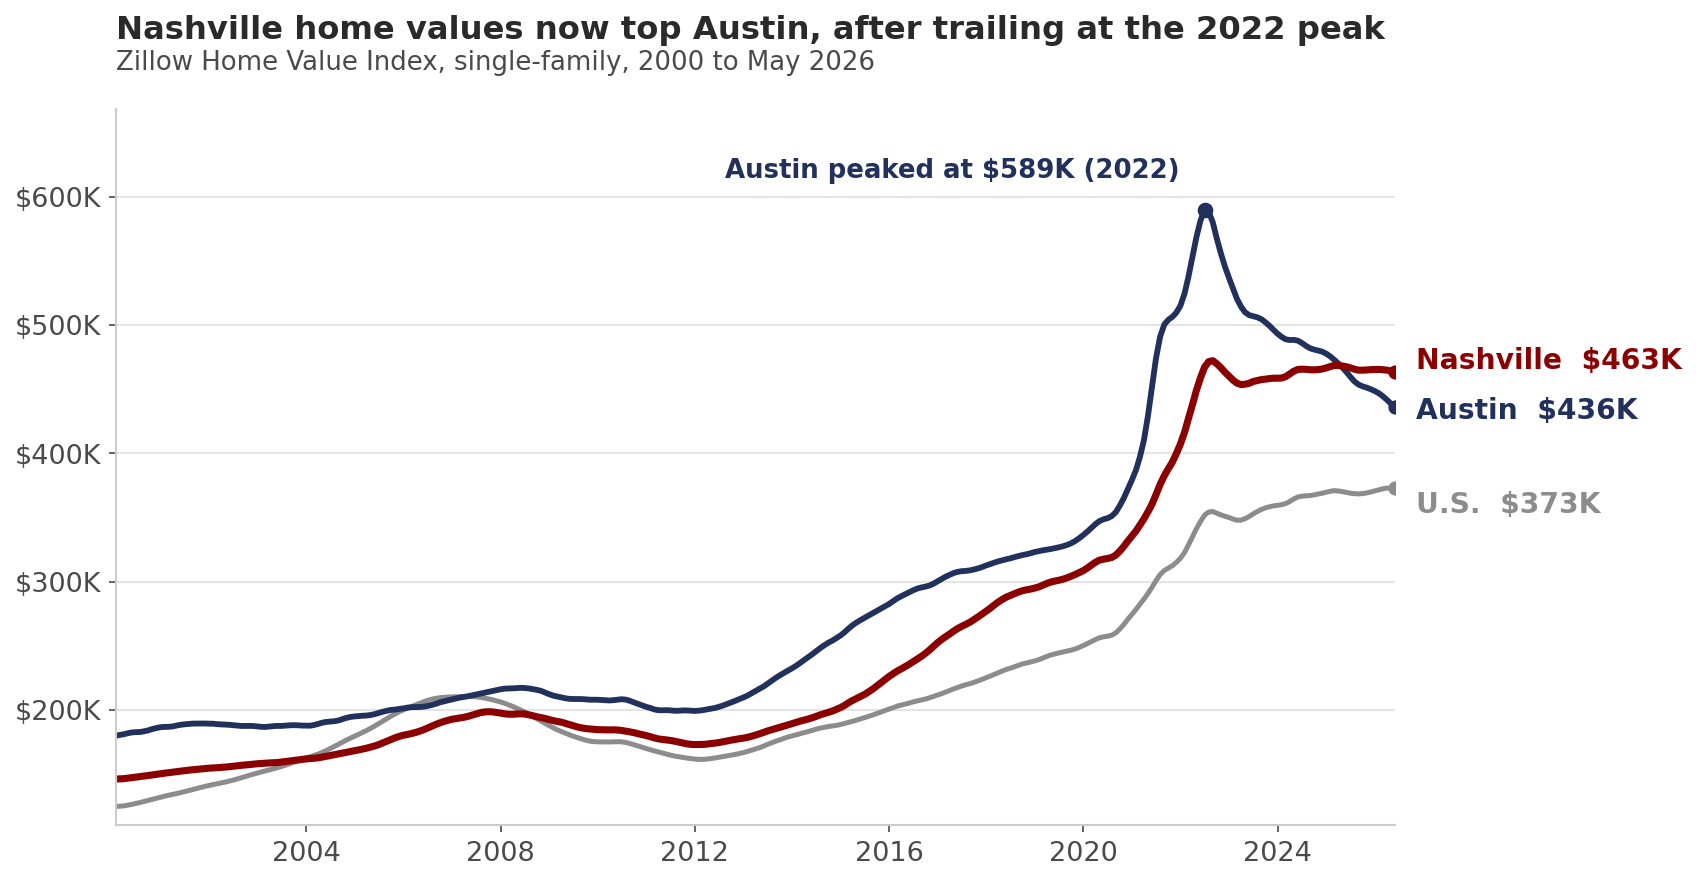
The lead is not ancient history. Nashville's cumulative growth since 2000 only pulled in front of the U.S. line in October 2016, and it has widened since. In dollar terms the typical Nashville single-family home is now worth $463,356, against $372,701 nationally.
A fair question before going further: ahead of the country is one thing, but is +6.1% a wide margin or a narrow one? Hold that thought for section 4.
2. Did Nashville and Austin actually start from the same place?
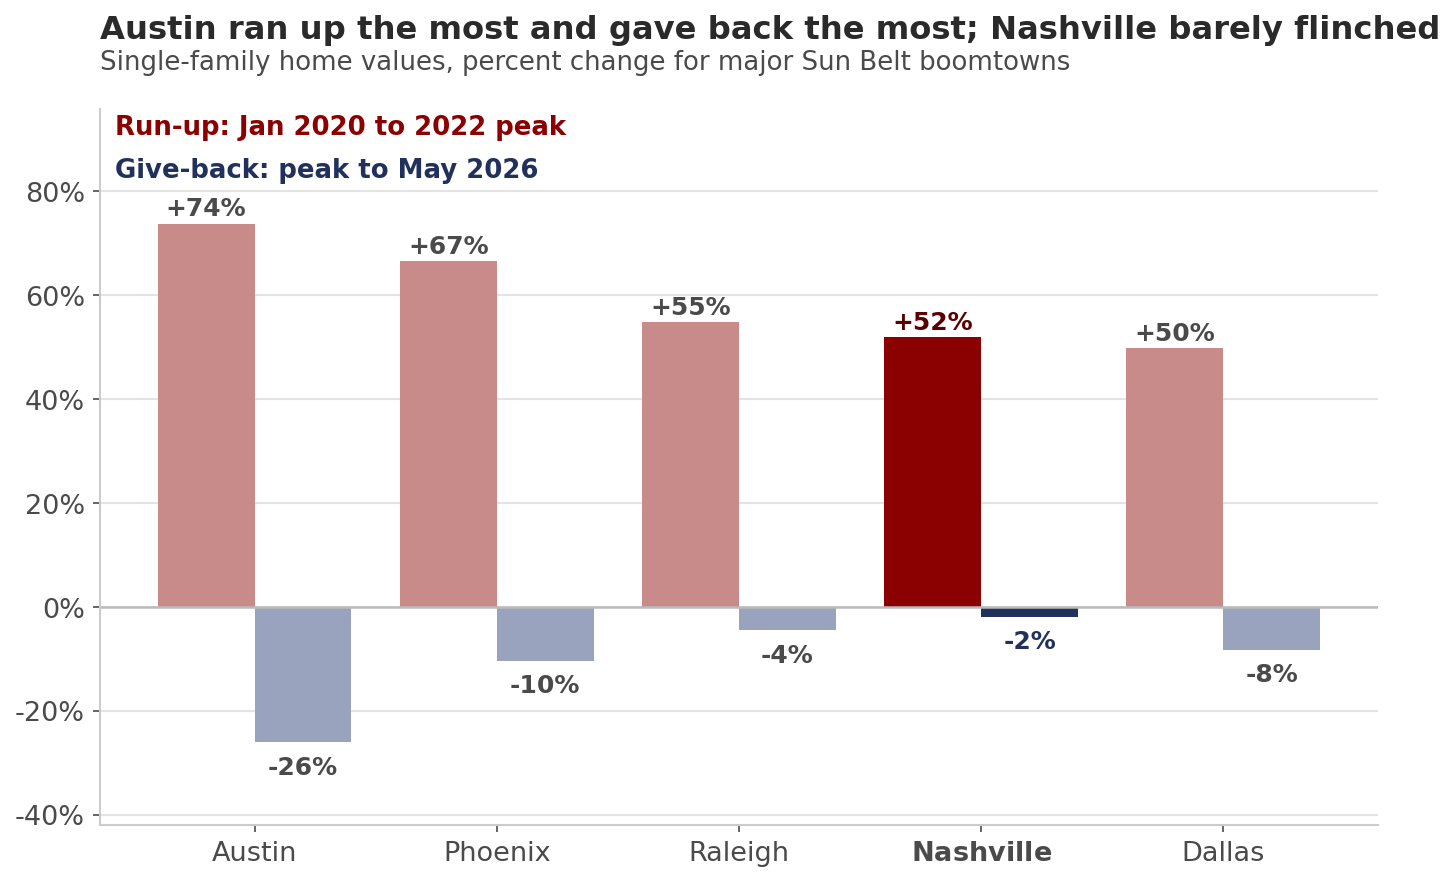
Not quite, and the difference is the heart of the story. From January 2020 to each city's own peak, the run-ups were not equal:
| Metro | Jan 2020 to peak | Peak month | Value at peak |
|---|---|---|---|
| Austin, TX | +73.8% | Jun 2022 | $589,221 |
| Phoenix, AZ | +66.6% | Jul 2022 | $511,586 |
| Raleigh, NC | +54.8% | Aug 2022 | $463,468 |
| Nashville, TN | +52.0% | Aug 2022 | $472,097 |
| Dallas, TX | +49.8% | Aug 2022 | $402,389 |
Austin climbed half again as much as Nashville during the boom. Its typical home pushed past $589,000, well above Nashville's $472,000 peak. So the two were never running the same race. Austin sprinted; Nashville moved up at roughly the national boom pace.
Does a steeper climb invite a steeper fall? The next section is where the lines split.
3. What happened after the 2022 peak?
Every boomtown in the table above peaked within a ten-week window in mid-2022. What they did next is where Nashville separates from the pack. Measured from each city's own peak to May 2026:
| Metro | Off its 2022 peak | Latest YoY |
|---|---|---|
| Nashville, TN | -1.9% | -0.9% |
| Raleigh, NC | -4.4% | -2.1% |
| Dallas, TX | -8.2% | -3.3% |
| Phoenix, AZ | -10.4% | -1.7% |
| Austin, TX | -26.1% | -6.0% |
Nashville gave back almost nothing. It is within 1.9% of an all-time high set nearly four years ago, the tightest hold of any major Sun Belt boomtown in this group. Austin gave back better than a quarter of its value and is still falling at -6.0% year over year.
The net effect over the full pandemic era is striking. Since January 2020, Nashville is up +49.2% and Austin is up +28.5%, even though Austin climbed far higher at the peak. The give-back erased most of Austin's lead.
4. Is Nashville the strongest market, or the steadiest?
Here the data asks for honesty. Over the full 25 years, Nashville is not the top performer, not even close to the national leaders. Among large metros, Tampa (+251.4%) and Knoxville (+242.5%) both out-appreciated Nashville, and they sit +17.6% and +14.6% ahead of the U.S. benchmark against Nashville's +6.1%. Nationally, Nashville ranks 122nd of 430 metros on 25-year appreciation; the raw leaderboard is dominated by resort markets like Kahului and Steamboat Springs.
So "outperforming" has a specific meaning in this data, and it is worth stating plainly:
- Nashville has beaten the national benchmark for a decade, and the margin is widening.
- Among the big inland boomtowns that spiked and corrected, Nashville has held its value better than every peer measured here.
Nashville's edge in this dataset is resilience, plus a steady lead on the country. It is the boomtown that climbed hard and then barely flinched. That is a different claim from "biggest gainer," and the data supports the first one, not the second.
5. So what could be driving the gap between Nashville and Austin?
This is the open question, and the data marks the outcome without naming the cause. Same country, same rates, same calendar, very different results. A few threads worth pulling, each stated as a question rather than an answer:
- Supply. Austin permitted and delivered a large wave of new homes and apartments through 2021 to 2023. Did that supply arrive into the rate shock and pull prices down faster than in slower-building Nashville? The ZHVI shows the price outcome; it does not measure the permits behind it.
- How far prices ran from incomes. Austin's typical home reached $589,000 at the peak, a +73.8% climb in under three years. Did that overshoot stretch further past local incomes than Nashville's +52.0% climb to $472,000, leaving more room to fall?
- The shape of the job base. Austin's growth leaned heavily on technology employment; Nashville's leans on healthcare, logistics, music, and corporate headquarters relocations. Did a more concentrated employment base make Austin more sensitive to one sector's pullback?
- Who was buying. Both metros drew investor and out-of-state demand during the boom. Did the mix of buyers differ in a way that changed how quickly each market cooled? The price index cannot see the buyer.
- Migration. In-migration drove both. Did the pace of arrivals hold up differently after 2022? That is a population question this housing series does not contain.
The data shows the divergence is real and large. It does not tell us which of these, or which combination, produced it. Each is testable against permit records, income data, employment series, and migration estimates, and none of them is settled by the price line alone.
What this adds up to
Five things the data shows, with no inference past them:
- Nashville home values are up +217.1% since 2000, +6.1% ahead of the +198.7% national figure, a lead that opened in October 2016.
- Nashville and Austin were never twins at the peak: Austin ran up +73.8% from January 2020 to a $589,000 high, Nashville +52.0% to $472,000.
- Since the 2022 peak, Nashville is off just -1.9%, the steadiest hold among major Sun Belt boomtowns, while Austin is off -26.1%.
- Over the full 25 years, Nashville is not the strongest market. Tampa and Knoxville appreciated more; Nashville's distinction is resilience plus a durable lead on the country.
- The Nashville-versus-Austin gap is documented but unexplained. Supply, price-to-income overshoot, job-base concentration, buyer mix, and migration are open questions, not conclusions.
The thing to watch over the next 30 to 60 days is whether Austin's discount to Nashville keeps widening or starts to close. Austin is still falling at -6.0% year over year while Nashville sits at -0.9%. If that gap narrows, the correction is maturing. If it widens, the two boomtowns are still diverging, and the driver questions above only get more interesting.
Data: Zillow Home Value Index (ZHVI), single-family homes, mid-tier (33rd to 67th percentile), smoothed and seasonally adjusted, January 2000 to May 2026.