This week, the $300K–$500K single-family band in Greater Nashville flipped from leading the market to trailing it. SFH pending contracts in this band came in at 1,058 listings vs 1,076 in the same week last year — a YoY count diff of −18. Four weeks ago this same band was sitting at +105 ahead of 2025. Across 6 SFH price bands, this is the only one with negative YoY contracts this week.
The $300K–$500K band is the bread-and-butter price tier — the largest single bucket of buyers and the segment most exposed to mortgage rates. When everything below it (entry-level) and everything above it (move-up through luxury) is positive, but the middle isn't, that's not a story about aggregate supply or demand. It's a story about the median household.
1. Five weeks, off the rails
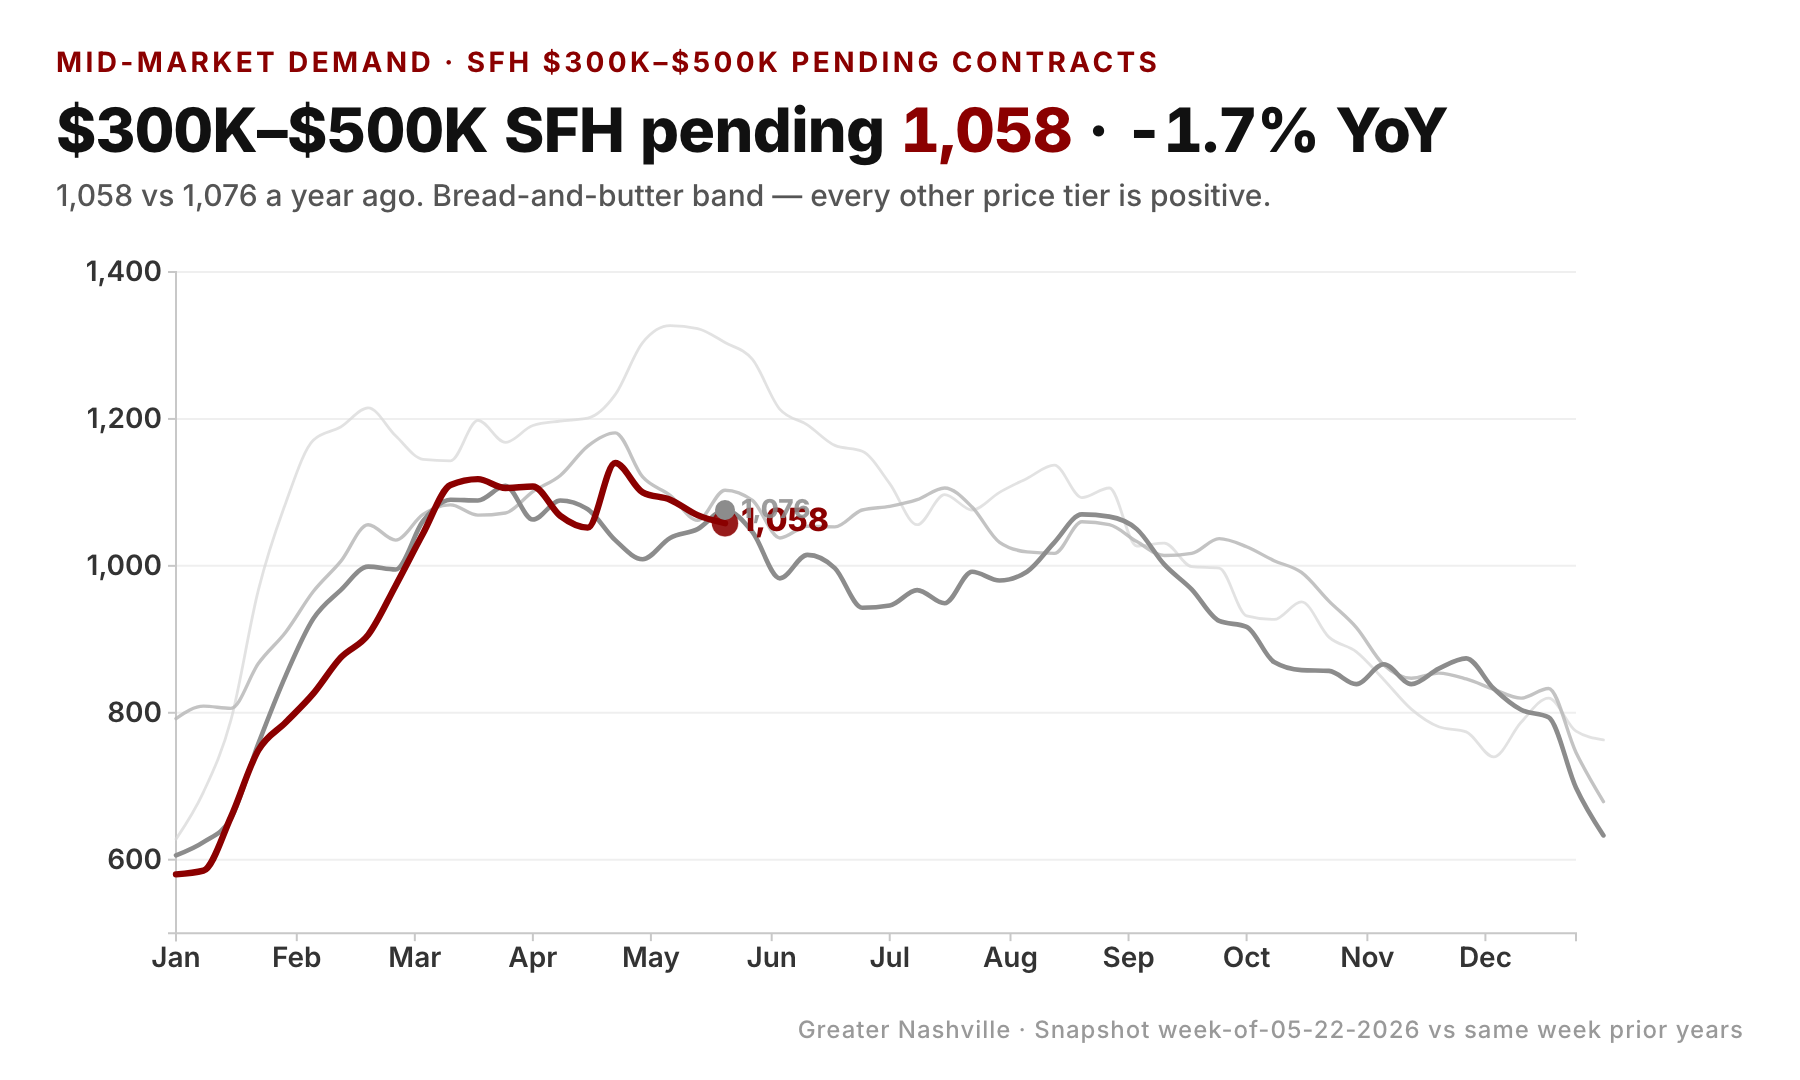
The $300K–$500K SFH band ran a clean rally for two months. March 28 (week 13), 2026 was effectively tied with 2025. By April 25 (week 17), it was +105 ahead. Then the bottom fell out in four weeks: +105 → +91 → +52 → +19 → −18. That's a 123-listing reversal in 28 days, while 2025's same-week comparison stayed in a tight band around 1,050–1,090 contracts.
The level matters as much as the trend. This week's 1,058 contracts is below 2025 (1,076), below 2024 (1,103), and well below 2023 (1,304) at the same point in the calendar. 2026 spent most of spring outpacing 2025 by 50–100 listings per week. This week the entire 2026 lead in this band evaporated.
One week wouldn't matter. Five weeks of consistent deceleration is signal.
2. The missing middle
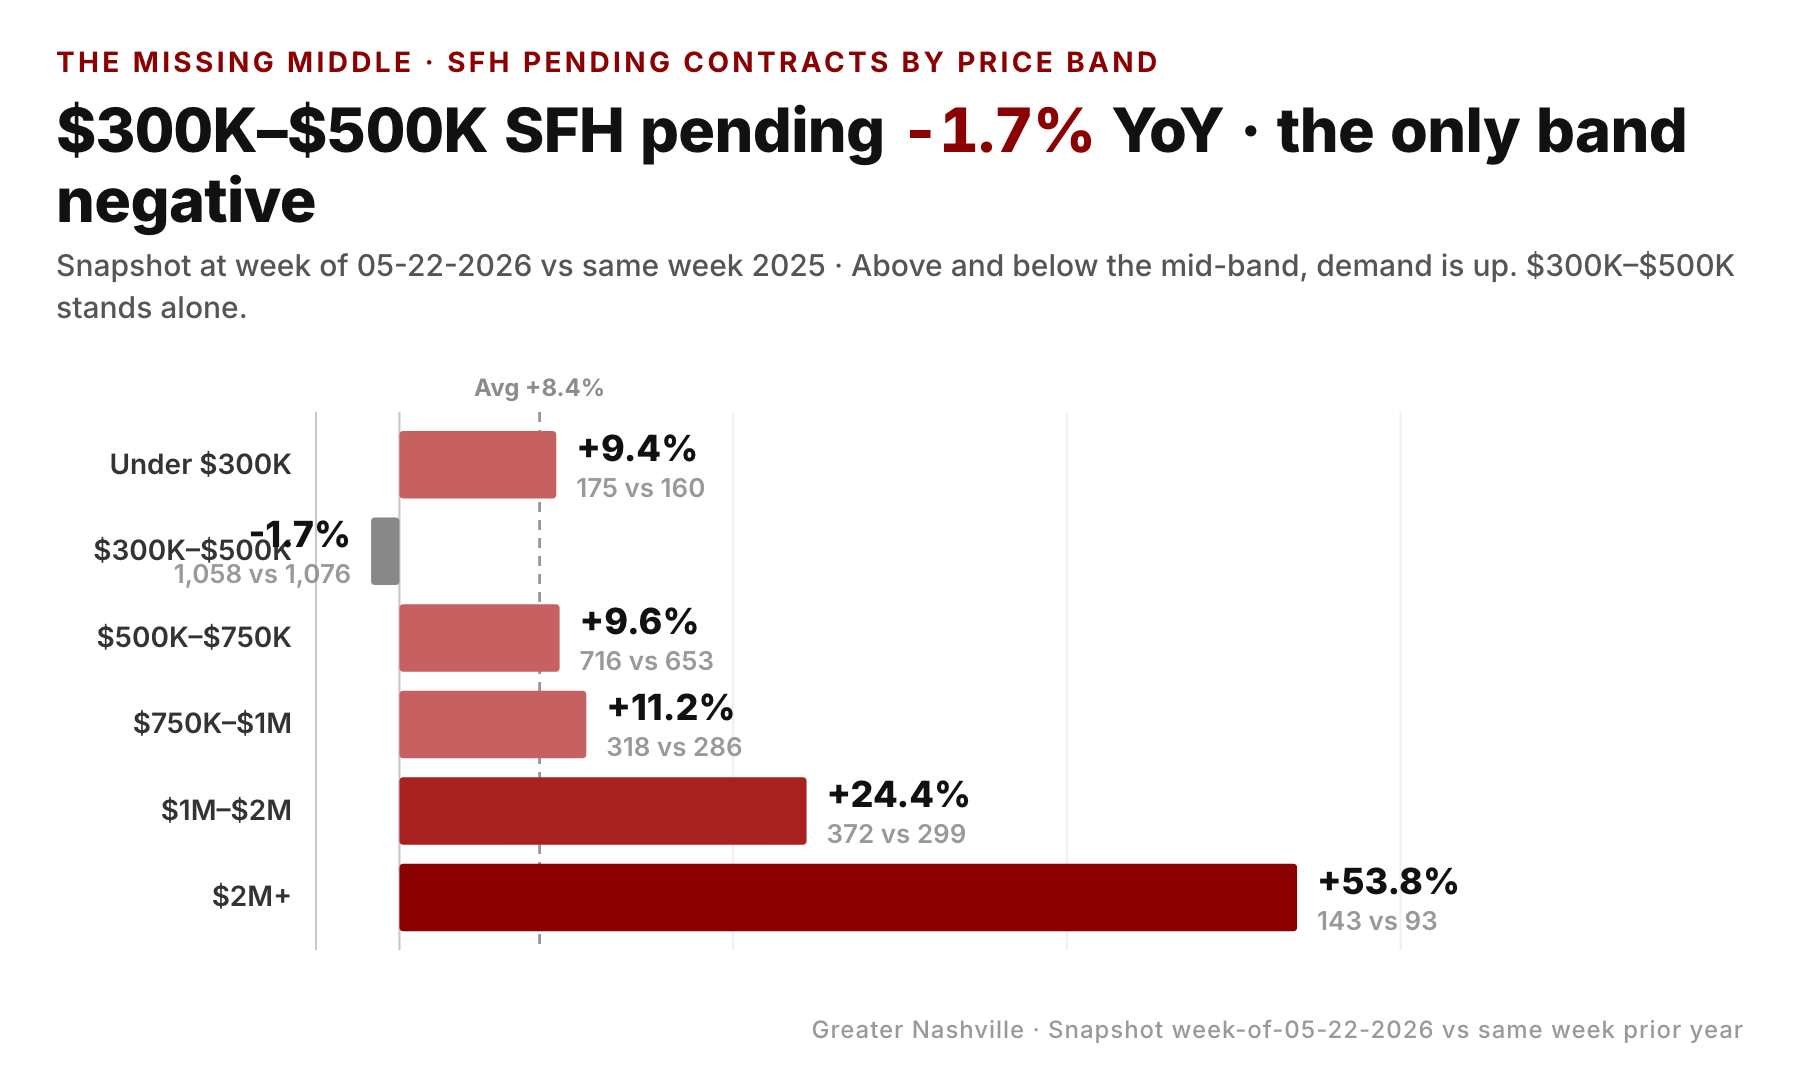
Here's what makes this week unusual. SFH contracts YoY by price band, all six tiers:
- Under $300K: +9.4% YoY
- $300K–$500K: −1.7% YoY (the only negative)
- $500K–$750K: +9.6% YoY
- $750K–$1M: +11.2% YoY
- $1M–$2M: +24.4% YoY
- $2M+: +53.8% YoY
A textbook K-shape would have entry-level weak and luxury strong. What we have instead is a barbell with a hollow middle. Households shopping under $300K are accelerating (cash buyers, FHA, USDA). Households shopping at $500K and up are accelerating across every band. The buyers stuck at $300K–$500K — the rate-sensitive median household — are pulling back, even as everything around them moves higher.
The intuitive read: this is the band where the marginal buyer is most sensitive to monthly-payment math. Entry-level buyers are often cash-constrained anyway and lean on government loans. Move-up buyers already in $300K–$500K homes are locked into sub-4% mortgages and don't list. Higher-end buyers are bringing equity or paying cash, so rates matter less to them. The middle is the rate-sensitive zone — and it just gave way.
3. Davidson crossed the same week
Layered on top of the band story: Davidson County SFH contracts also flipped negative this week. 730 contracts vs 741 a year ago — a YoY count diff of −11. Four weeks ago Davidson was sitting at +27 YoY.
Davidson is where SFH activity is densest in the metro, so a metro-wide mid-band crack shows up here first. Davidson has oscillated above and below 2025 several times this year, so a single negative print doesn't prove a county-level trend in isolation. But the timing — same week the metro mid-band crosses — is consistent with the same buyer pullback rather than a Davidson-specific quirk.
What it does suggest: the urban core, where a $300K–$500K SFH is most often a smaller older home rather than a starter in the burbs, is the most exposed submarket inside the most exposed band.
4. Inventory isn't the explanation
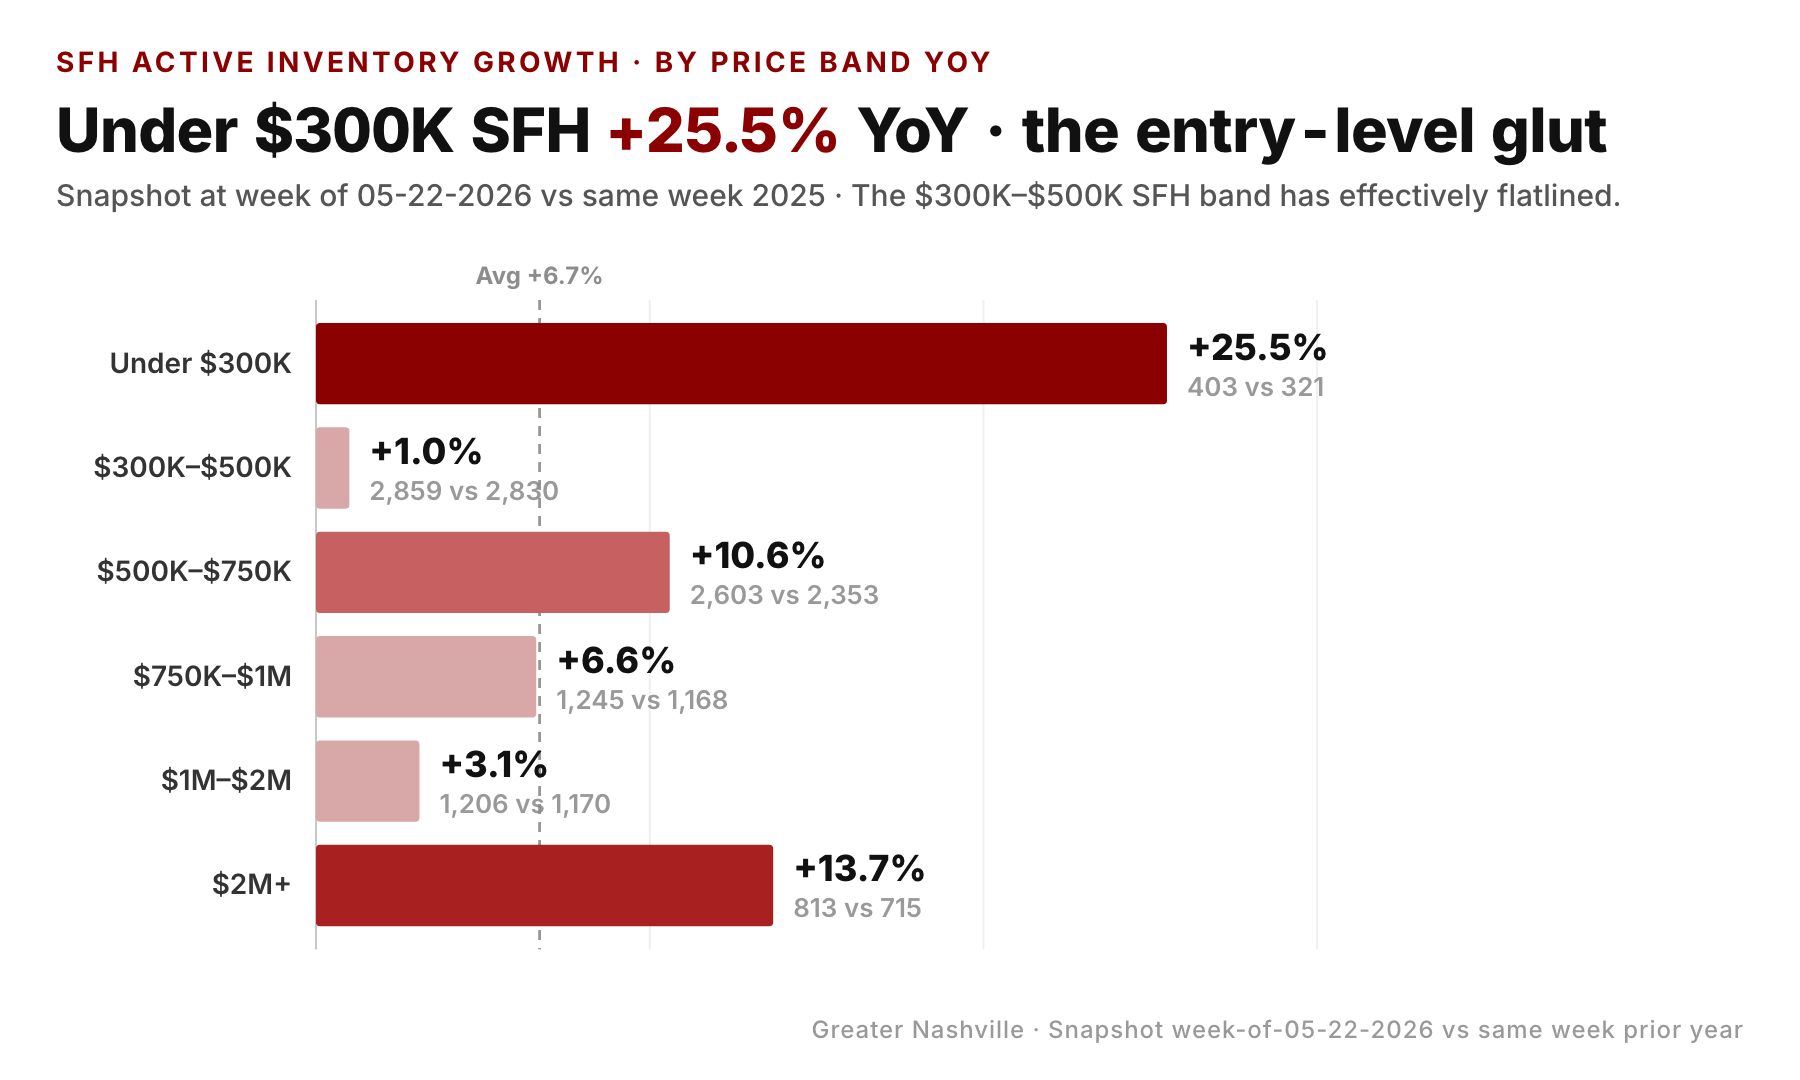
This isn't a supply-flood story. SFH active inventory by band, YoY:
- Under $300K: +25.5%
- $300K–$500K: +1.0% (smallest growth)
- $500K–$750K: +10.6%
- $750K–$1M: +6.6%
- $1M–$2M: +3.1%
- $2M+: +13.7%
The $300K–$500K band has the smallest active inventory growth of any SFH band — up just 1% YoY. Sellers in this band aren't flooding the market more than last year. The contracts shortfall is demand-side, not oversupply.
Inside the band, the existing-vs-new split sharpens the story further. SFH new-construction contracts at $300K–$500K are +1.4% YoY (+4 contracts). SFH existing-resale contracts at $300K–$500K are −2.8% YoY (−22 contracts). All the weakness is on the resale side — exactly where the rate lock-in effect bites the hardest. Builders are still moving spec inventory in this band; current homeowners aren't trading.
What this adds up to
- SFH $300K–$500K contracts flipped to −18 YoY this week after running +105 ahead just four weeks ago — a clean 4-week deceleration that's now bigger than any single-week move this band saw all spring.
- Among 6 SFH price bands, this is the only one negative this week. Every band above and below is up by mid-single-digit-percent or much more.
- Davidson County SFH crossed negative the same week, consistent with the urban core being the most rate-sensitive submarket.
- Active inventory in the mid-band is +1% YoY — the smallest of any SFH band. This isn't a supply story.
- Inside the band, all the weakness is on the existing-resale side. New construction is holding up — meaning the lock-in effect is doing the work, not new builder pricing pressure.
For buyers shopping $300K–$500K SFH: this is the segment where negotiating posture improved most over the last four weeks. Active inventory in the band is stable, the contracts pipeline is suddenly thinner than last year's, and the lock-in dynamics that have kept resale supply tight mean any seller who is listed has a stronger-than-usual reason to move. Push harder than you would have in April.
For sellers in $300K–$500K SFH: don't anchor on April's market. The 4-week swing from +105 to −18 in your price band means the comp pool that closed quickly six weeks ago is now sitting longer. If your home has been listed for 30+ days, the price set in April is probably too high for May.
For the metro narrative: the K-shape isn't just upper-vs-lower. It's a barbell with a hollow middle. When the median household is the one pulling back, that's a sharper diagnosis of where rate-sensitivity is binding than any aggregate price-cut percentage.
Watch this over the next 30 days: if SFH $300K–$500K contracts stay negative for 3+ more weeks, the spring rally in this band was a head-fake and Q3 closings in the segment should come in noticeably below the 2025 comp. If the band flips back to +20 or higher within 2 weeks, this reading was noise from a single off-week and the band's spring momentum is intact. Either result will be informative.
Data through week ending 05-22-2026, Greater Nashville (9 counties: Davidson, Williamson, Rutherford, Wilson, Sumner, Maury, Dickson, Cheatham, Robertson). Source: market_pulse_yoy_data.json.