The scary version of this week's data writes itself: Greater Nashville contract growth peaked at +12.7% year-over-year on May 2 and has fallen every single week since — six straight lower readings, down to +2.9% now. My first draft of this post led with exactly that story. Then I asked the question that should precede every year-over-year number printed this spring: what was last spring doing? Last spring was Liberation Day — the April 2, 2025 tariff announcement that froze buyers in their tracks for six weeks. Measure this year against the two springs before the shock, and both the surge and the fade largely disappear.
That doesn't mean nothing is happening — it means the real signals are hiding under a distorted base. Re-based against 2023 and 2024, Nashville demand is steady, two specific markets (Davidson County and the $750K–$1M band) are genuinely weak against every baseline, and the luxury tier is genuinely on fire. Here's the honest version, chart by chart.
1. Only the 2025-base line shows a rollercoaster
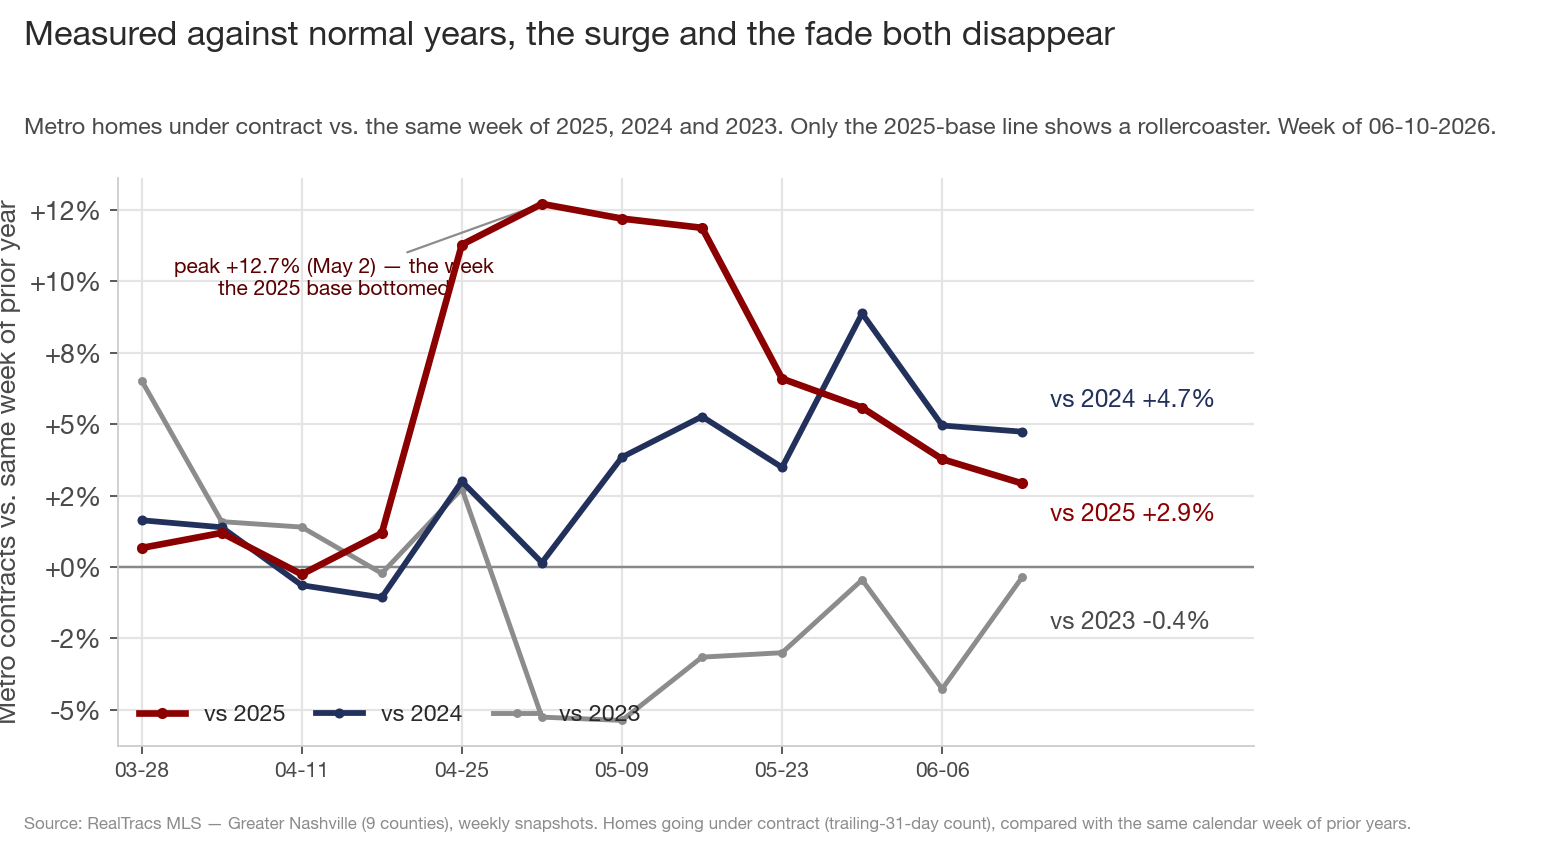
The maroon line is the number everyone quotes: contracts versus the same week of 2025. It's a rollercoaster — +12.7% at the May 2 peak, +2.9% now. The navy and grey lines are the same 2026 contracts measured against 2024 and 2023. They're nearly flat: versus 2024, this year has held between +3.5% and +8.9% since late April and sits at +4.7% this week, with no six-week slide. Versus 2023, the metro has actually improved — from −5.4% in early May to −0.4%, dead even, this week.
Why the difference? Contracts are a trailing-31-day count, so the April 2, 2025 tariff shock loaded fully into the 2025 base by the May 2 snapshot — which is precisely when the 2025-vs-2024 comparison bottomed at −11.1%. This year's +12.7% "peak" was measured against the bottom of that crater. And the "fade" since is substantially the crater refilling: 2025's spring recovered from −11.1% to +1.8% by mid-June. Decompose the 278-contract swing in the year-over-year margin since May 2 and only 150 of it is 2026 declining — the other 128, fully 46% of the swing, is the 2025 base climbing back. Half the scary headline is arithmetic.
2. 2025 was the odd year out. It's also this year's denominator.
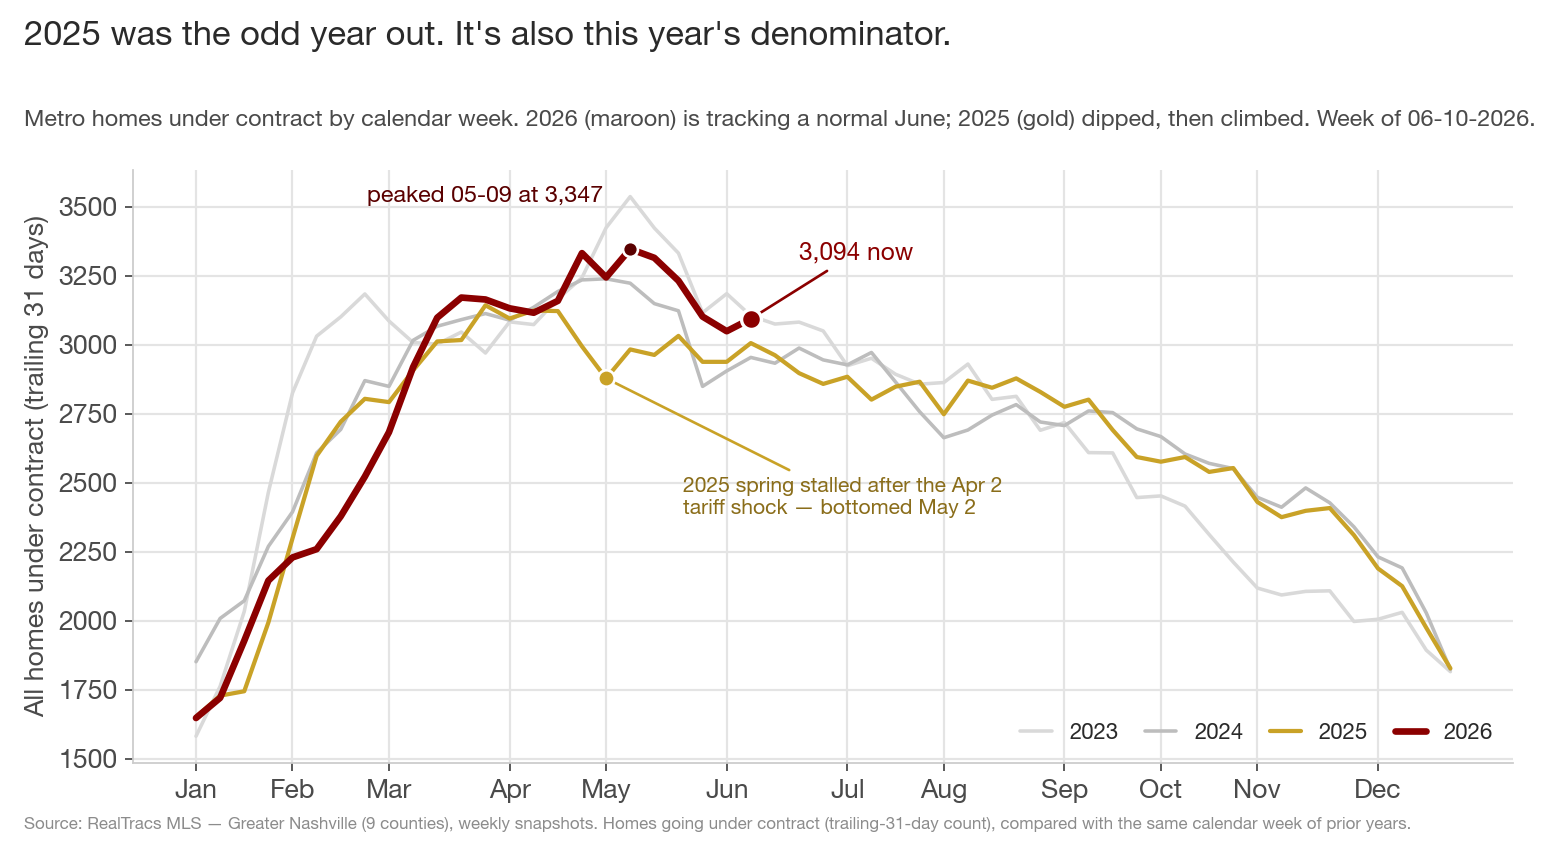
The other half of the swing — 2026's own decline from its 3,347 May 9 peak to 3,094 now — looks alarming only until you ask what a normal June does. From their spring peaks to this week: 2023 fell −12.2%, 2024 fell −8.8%, and 2026 has fallen −7.6% — the mildest June pullback of the three normal years. The only year that didn't decline into June was 2025 (+0.8% over the same window), and now we know why: its spring demand had been shoved into a hole in April and was climbing out. The year I originally framed as the healthy comparison — "last year kept climbing into June" — was the anomaly, not the baseline.
For level-headed context: 3,094 contracts is still the second-busiest June 10 reading in the four years of data (2023: 3,105). This is a normal-shaped year wearing a funhouse-mirror base.
3. The re-based county map: what's echo, what's real
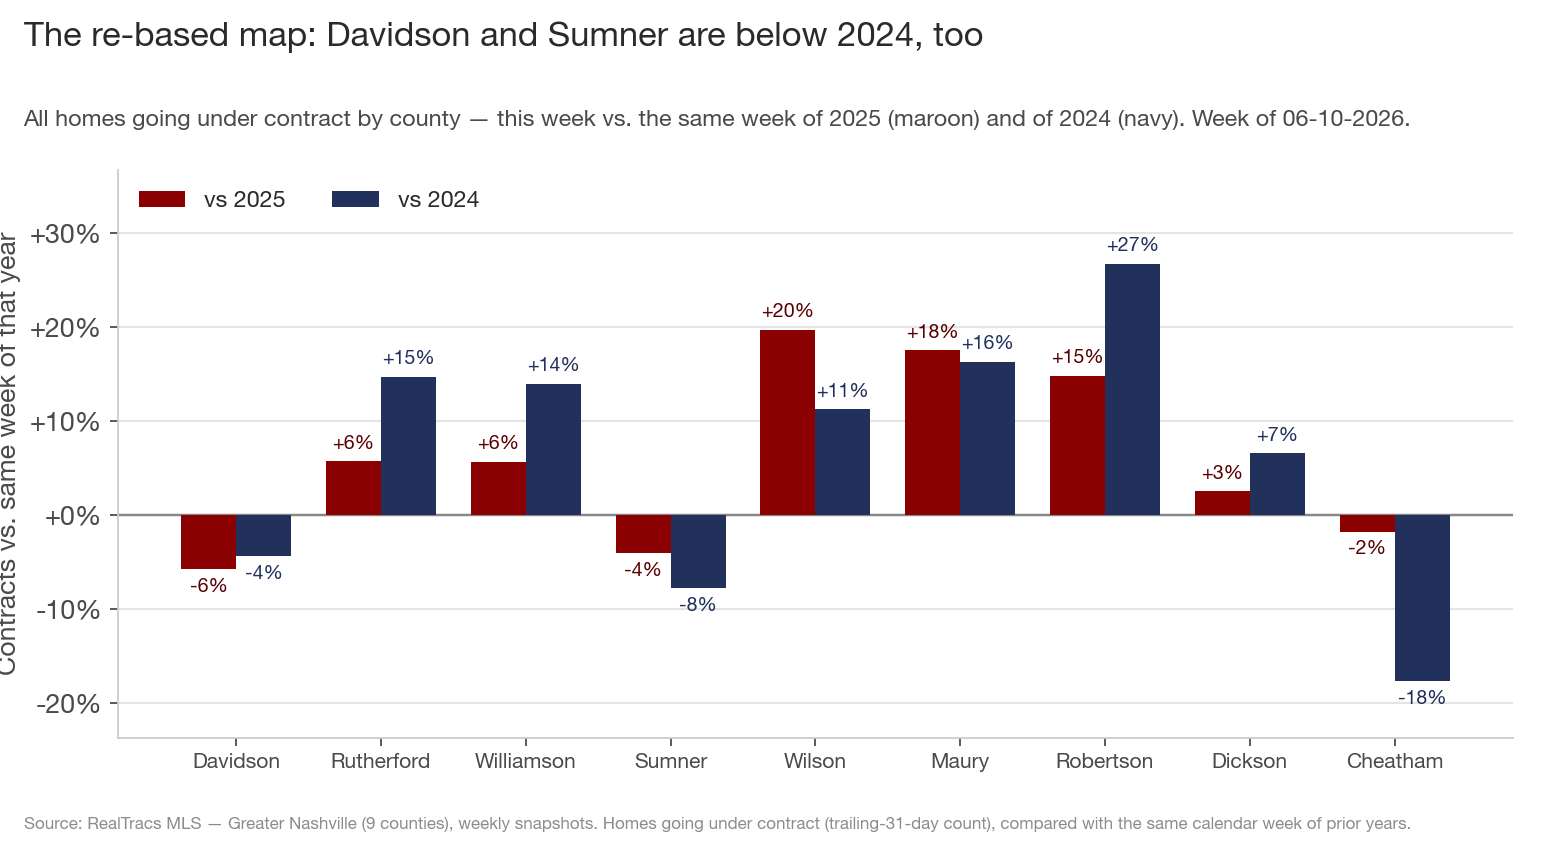
Run every county against both baselines and the map sorts itself into echo and signal. Echo: Williamson and Rutherford "decelerated" hard against 2025 over the past month — but against 2024 they're up +13.9% and +14.7%. Their spring slowdown was mostly the base effect; demand there is fine. Signal: Davidson is negative against both baselines — −5.7% vs 2025, −4.4% vs 2024 (and −7.4% vs 2023). So is Sumner: −4.0% vs 2025, −7.8% vs 2024. Those two are the real soft spots, and they carry 41% of the metro's contracts between them. (Cheatham is also below 2024, but at 56 contracts it's too small to read.)
The outer-county growth is real, too: Wilson is +11.3% against 2024, Maury +16.3%, Robertson +26.7%. Buyers are still buying — disproportionately where the price of entry is lower.
4. Davidson: the one big-county problem that survives every baseline
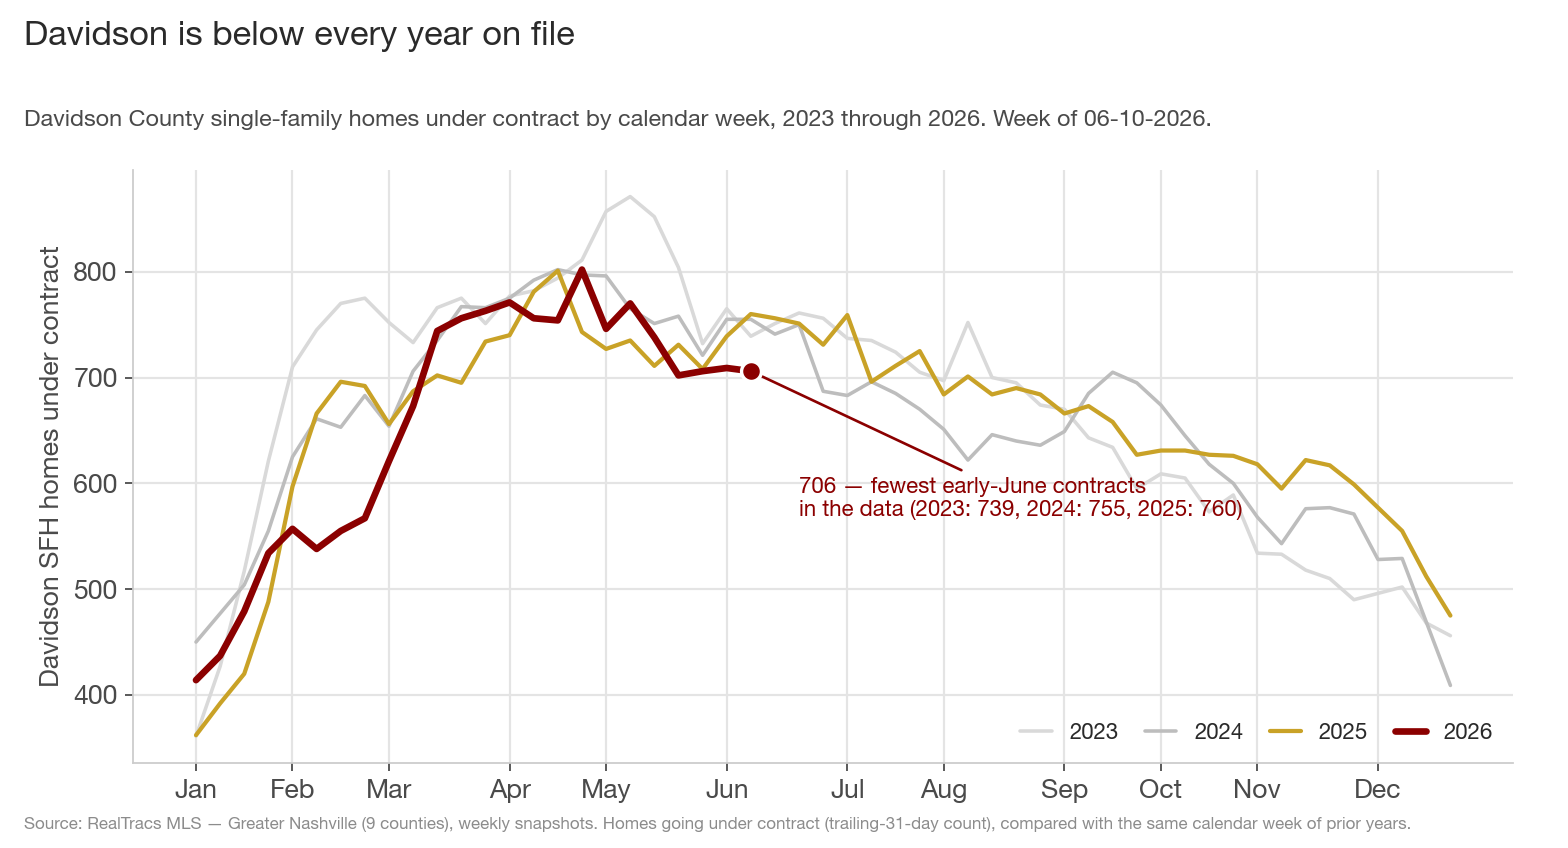
Strip away the base distortion and one big-county fact stands on its own: Davidson has signed fewer single-family contracts than 2025 for four straight weeks (−29, −2, −30, −54) — and unlike the metro numbers, that's not the echo talking. This week's 706 is the fewest early-June single-family contracts in all four years of the data — below 2025 (760), 2024 (755), and 2023 (739). All-property tells the same story: 920, versus 962–993 in the three prior years.
This is the same county that set a record $550K single-family median two posts ago. Record prices on four-year-low forward demand is the sharpest price-versus-volume divergence in the metro, and it's the thread from the median-record post showing up exactly where you'd expect it next: in the pipeline.
5. Sumner: the rearview and the windshield
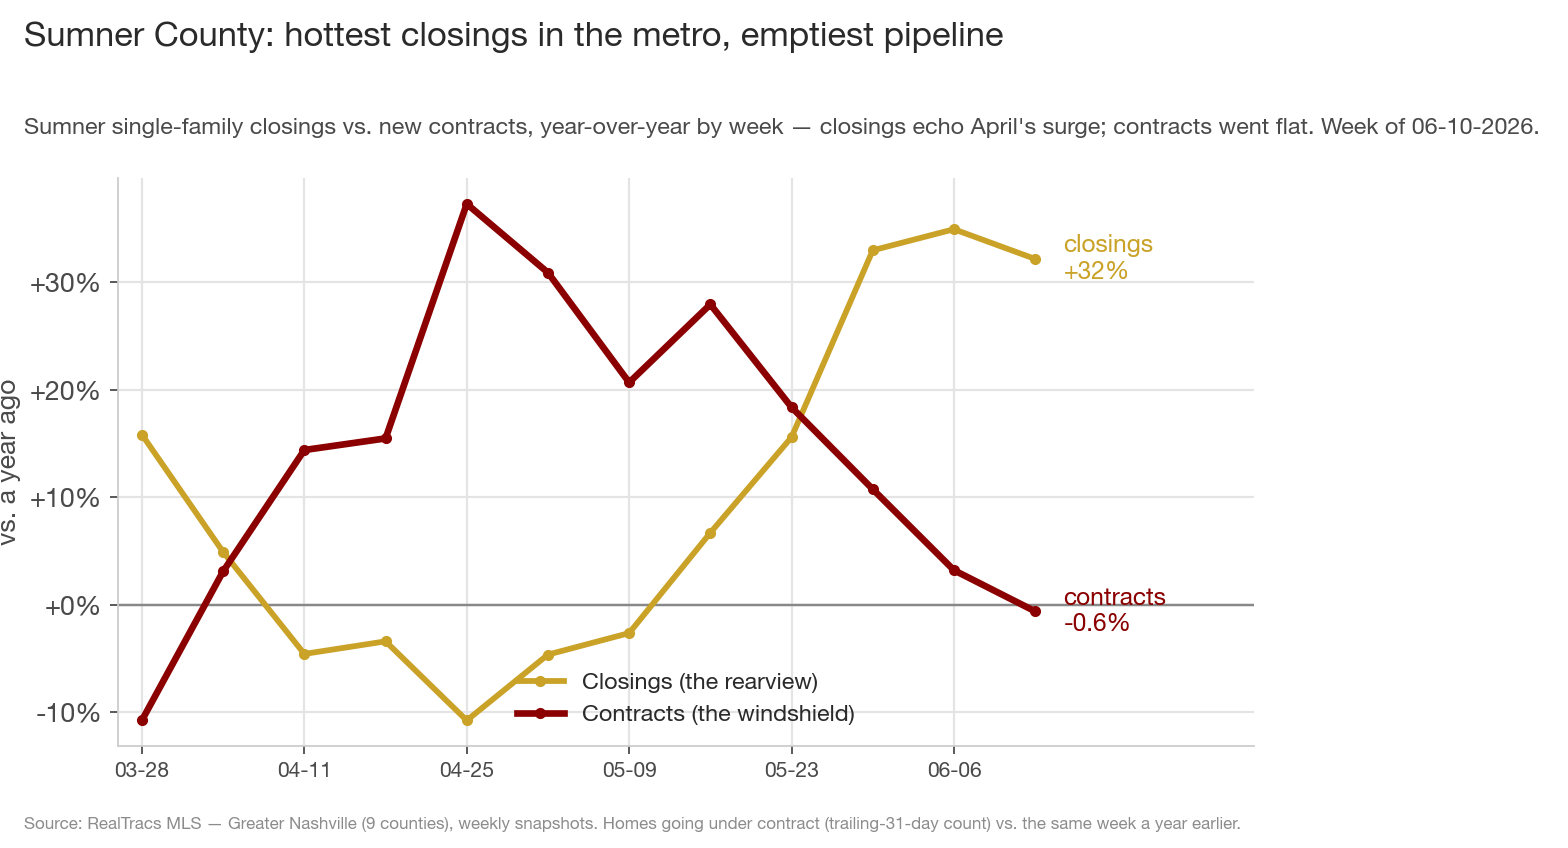
Sumner is the metro's strangest county right now, and the re-basing makes it stranger in both directions. Its closing boom is real, not echo: 337 single-family closings is +32.2% over 2025, but also +24.8% over 2024 and +10.1% over 2023 — the strongest closings of all nine counties against any baseline. And its pipeline weakness is real too: contracts are −0.6% against 2025 and −8.8% against 2024. The rearview mirror (April's contract surge, now closing) and the windshield (a thinning pipeline) genuinely point opposite directions here.
The mechanical prediction from the scissors stands: contracts lead closings by six to eight weeks, so Sumner's closing boom should fade sharply by late July. That one is base-proof.
What this adds up to
- The surge was never as big as it looked, and the fade isn't as scary as it looks. Of the 278-contract swing in the year-over-year margin since May 2, 46% is the 2025 base recovering from the tariff shock. The rest is a June decline milder than 2023's or 2024's.
- Re-based, 2026 is simply steady: +4.7% above 2024, dead even with 2023, second-busiest June 10 in the data.
- The real weak spots survive every baseline: Davidson (four-year-low contracts, against record prices), Sumner's pipeline (−8.8% vs 2024), and the $750K–$1M band (−12.9% vs 2024, the one price tier below its pre-shock pace).
- The real strength survives, too: $1M–$2M contracts are +49.5% above 2024 and $2M+ is +41% (and +58% over 2023) — the luxury melt-up is no echo. Under $300K is +15.6% over 2024. The barbell is real; it's the middle-upper rung that's soft.
- The base distortion has another act coming. The 2025 base keeps recovering through June — so the vs-2025 headline number will likely keep falling and may well print negative within a few weeks.
That last point is the one to pre-register, because it's checkable: when Greater Nashville's year-over-year contract number goes negative in late June or July — and on current trajectory it will — the tempting headline will be "Nashville demand is shrinking." Unless something else changes, that print will be the echo, not the signal: this June is outperforming the two pre-shock Junes. The honest tell is the navy line: 2026 versus 2024. If it holds above roughly +3% through July, this is a steady year and the negative headlines are arithmetic. If it breaks below 2024's path too, the fade is real and I'll write that post. For sellers, the actionable version: Davidson and the $750K–$1M band are genuinely soft — price accordingly — but metro-wide, don't panic off a YoY headline this summer. For buyers, real leverage lives in exactly those two places, plus Sumner once its closing boom rolls over. For agents, late June is when the scary YoY prints arrive; be the one in the room who knows what last April was.
Data through the week ending June 10, 2026, Greater Nashville (9 counties: Davidson, Williamson, Rutherford, Wilson, Sumner, Maury, Dickson, Cheatham, Robertson). "Contracts" are a trailing-31-day count of homes going under contract; baselines compare the same calendar week of 2025, 2024, and 2023. Metro and county figures cover all property types unless noted as single-family; closings are a trailing-31-day count of closed sales. The April 2, 2025 "Liberation Day" reference marks the tariff announcement whose demand shock appears in the 2025 contract data from mid-April through May. Source: RealTracs MLS.