For six years, new construction was a remarkably steady 27% to 30% of every home sold in Greater Nashville. This year that slice slipped to 24.9%, the lowest in seven years of records, and by the most recent month it is running closer to 21%. Something changed.
What follows is a walk through the evidence, chart by chart: how far the share fell, whether it is fewer new homes or a stronger resale market, what the demand pipeline says, how builders are pricing, where the pullback is concentrated, and what and who builders are building for. The clues are all on the table. Which of them is actually driving the shrinking share is the part I will leave for you to decide.
1. How much has the slice actually shrunk?
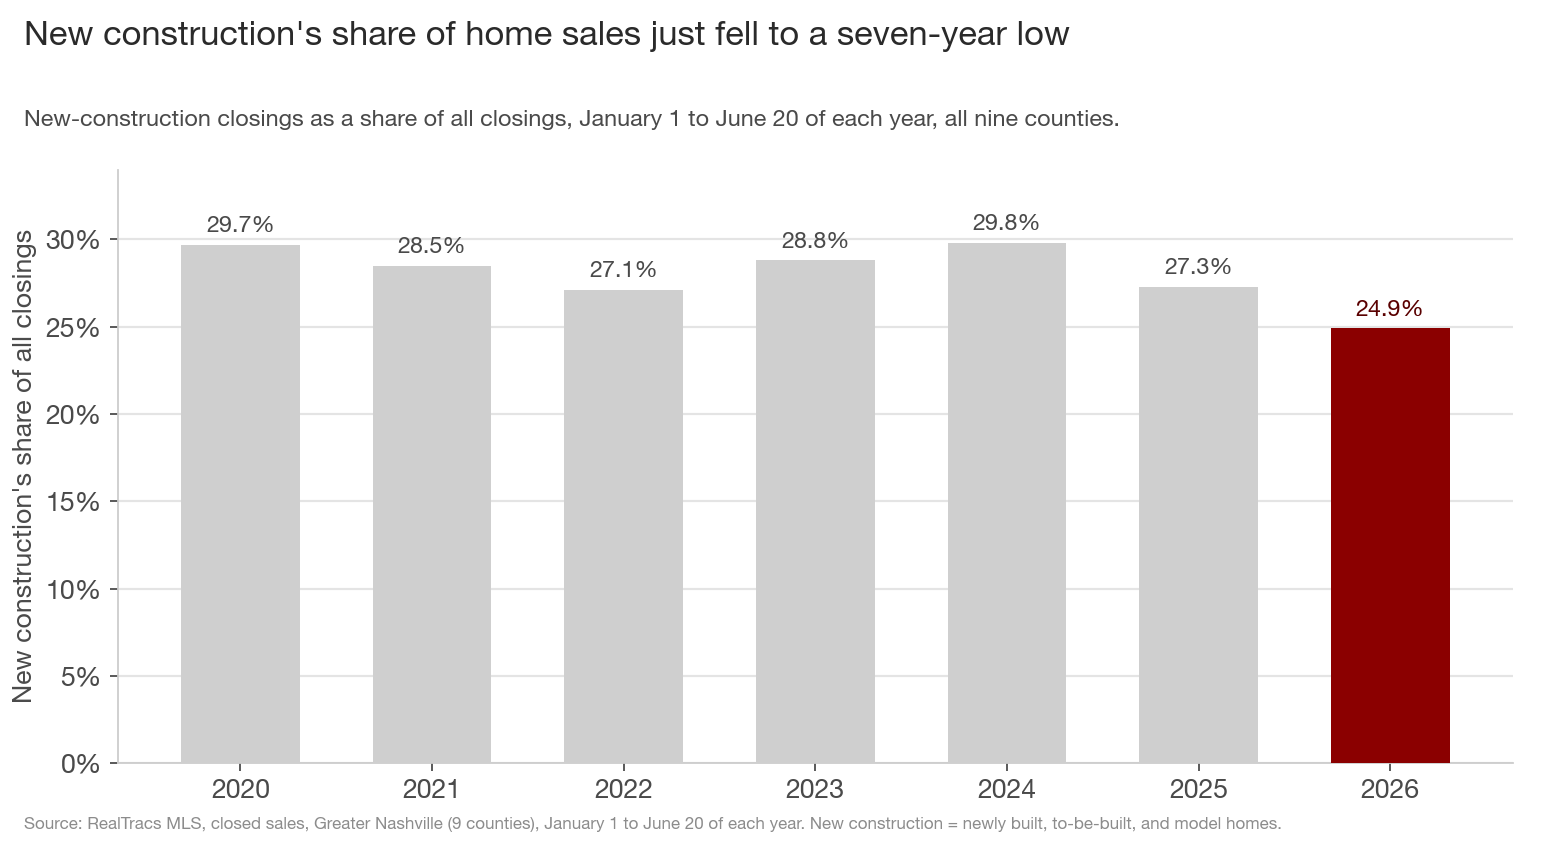
Pull the lens all the way back to every closed sale in the nine counties since 2020, measured the same way each year (January 1 through June 20). New construction held 27% to 30% of the market from 2020 through 2025, then dropped to 24.9% in 2026, the lowest share on record. New-construction sales fell to 3,663 so far this year, the fewest in seven years and down from a 2021 peak near 5,700, while total sales held roughly flat at about 14,700, in line with 2023 through 2025. Builders sold fewer homes into a market that did not shrink with them.
That is the question this whole post is chasing. (One note on the measure: this year-to-date figure runs a few points above the trailing-31-day snapshot used later, which already has the share near 21%, so the slice may be shrinking faster than the annual number shows.) The rest is the search for what is behind it.
2. Is new construction simply selling fewer homes?
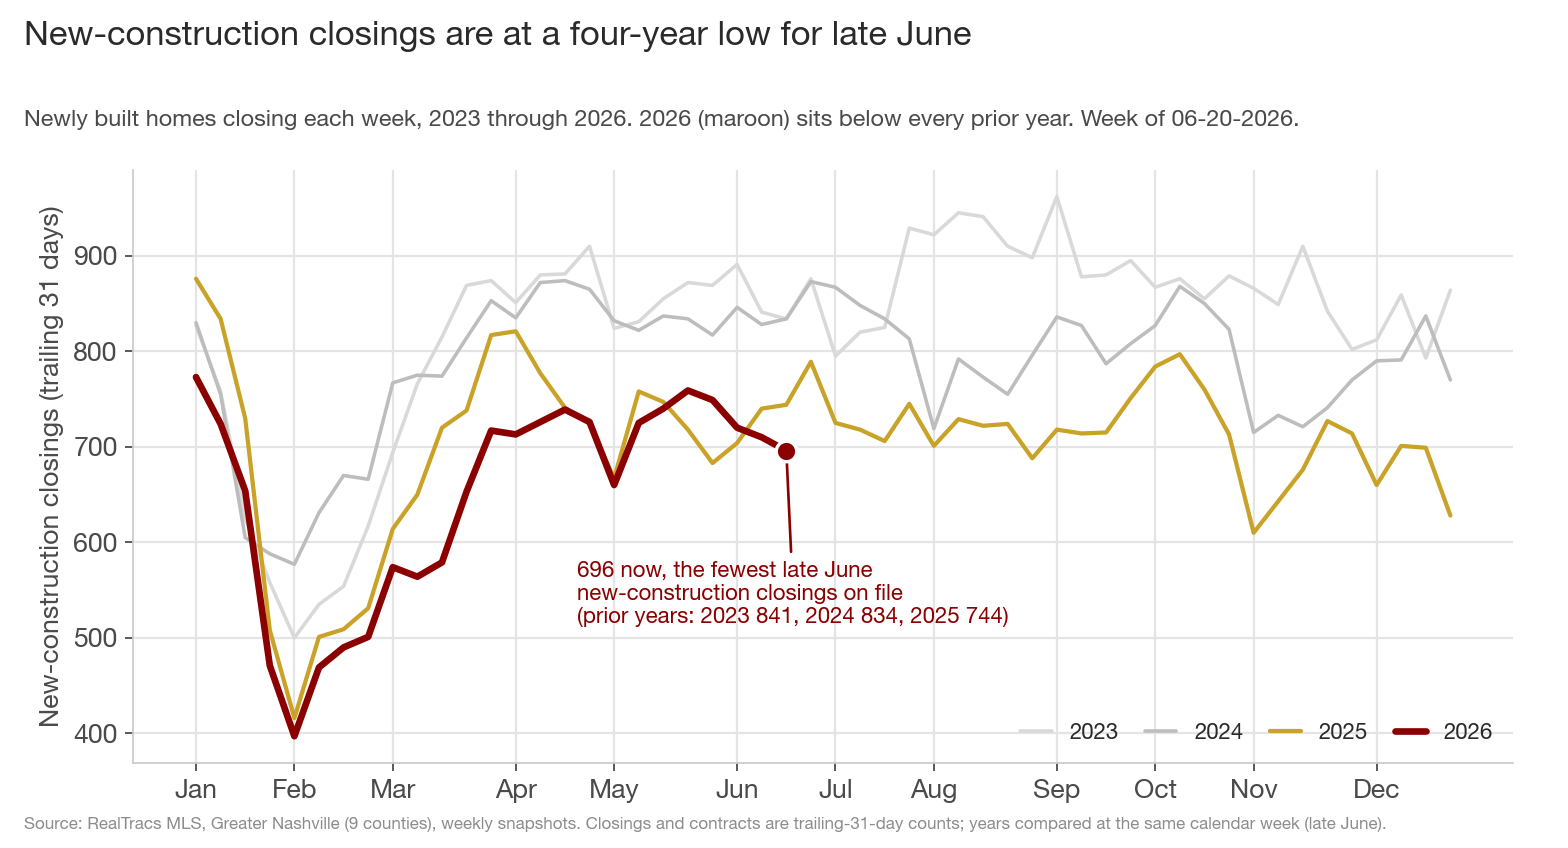
Start with the simplest possibility: builders are closing fewer homes. They are. Greater Nashville builders closed 696 newly built homes in the trailing month, the fewest for late June in the four years of weekly data, down 17% from 2023 and 16% from 2024. The 2025 base here is the post-Liberation-Day tariff trough, an easy comp, and new closings are still down 6.5% even against that, so the weakness survives every baseline. The line has been grinding lower for a month: 759 in late May, then 749, 720, 710, and 696 now.
A note on what this measures: closings are a rear-view mirror. A home closing in late June went under contract back in roughly April. So this is really a picture of where builder deliveries landed after the 2023-24 building boom worked through, and they landed low.
3. Or is resale bouncing back?
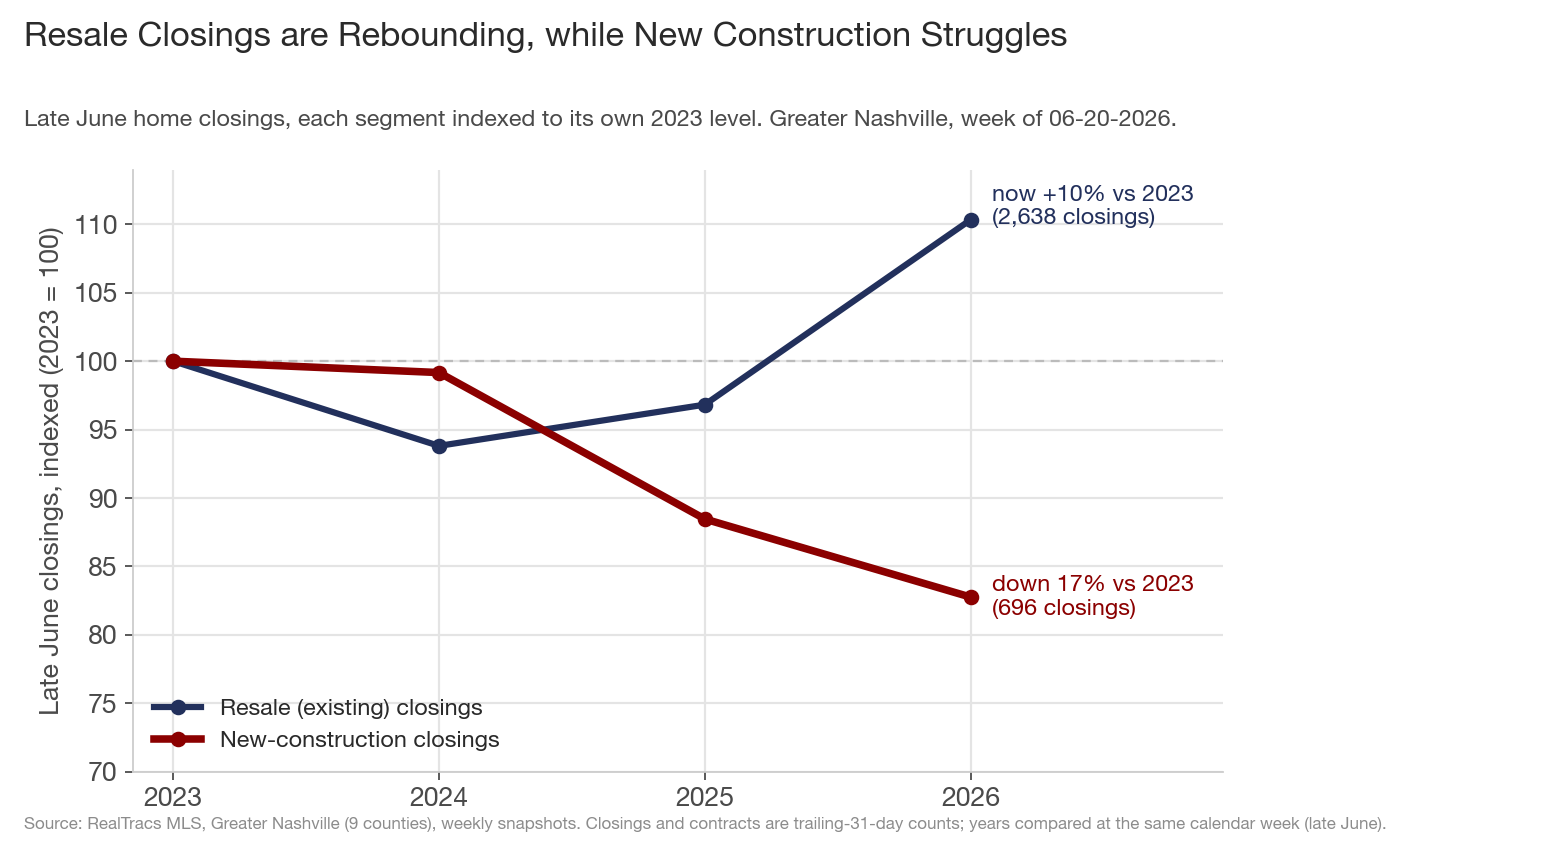
Here is the twist, and it matters for a market-share question. The shrinking slice is not only about new construction falling. Resale came back hard. Index each segment to its own 2023 level and resale closings climbed to 110 (2,638 closings, a full 10% above 2023), while new construction went the other way, to 83. Resale recovered and kept going.
So new construction's share can shrink even without builders collapsing, simply because the resale half of the market grew while theirs did not. That accounts for a good part of the market-share drop on its own. The open question underneath it is whether new-construction demand is also genuinely weakening, which is the next thread.
4. Is the demand pipeline drying up?
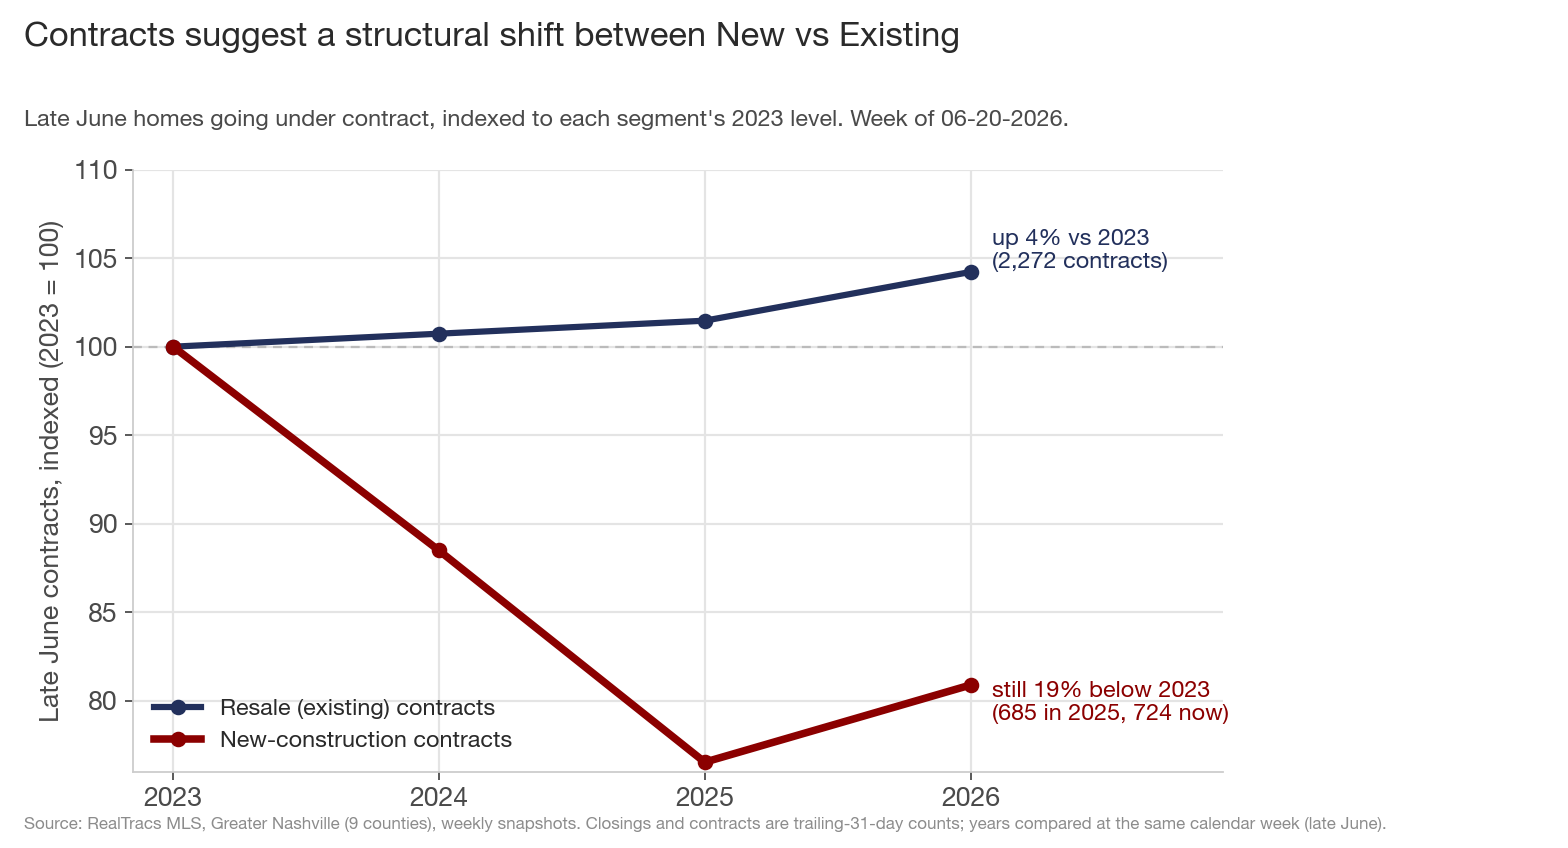
Closings are the rear-view. For the windshield, look at contracts, which are forward-looking versus closings that went under contract as far back as 60 to 90 days ago. New-construction contracts fell from a 2023 baseline of 895 to a low of 685 in 2025, and sit at 724 now, still about 19% below 2023, with no recovery back toward it. Resale contracts did the opposite, climbing to 104% of their 2023 level.
New-construction demand did not collapse; it reset to a lower level around 2024-25 and has held there. With the pipeline still a fifth below 2023, the low closing count looks like the new running rate rather than a seasonal wobble that snaps back next month. New active listings are flat year-over-year (-0.6%), the one inventory line in the metro that is not climbing, while existing listings are up 11% and condos up 19%.
5. Are builders choosing price over volume?
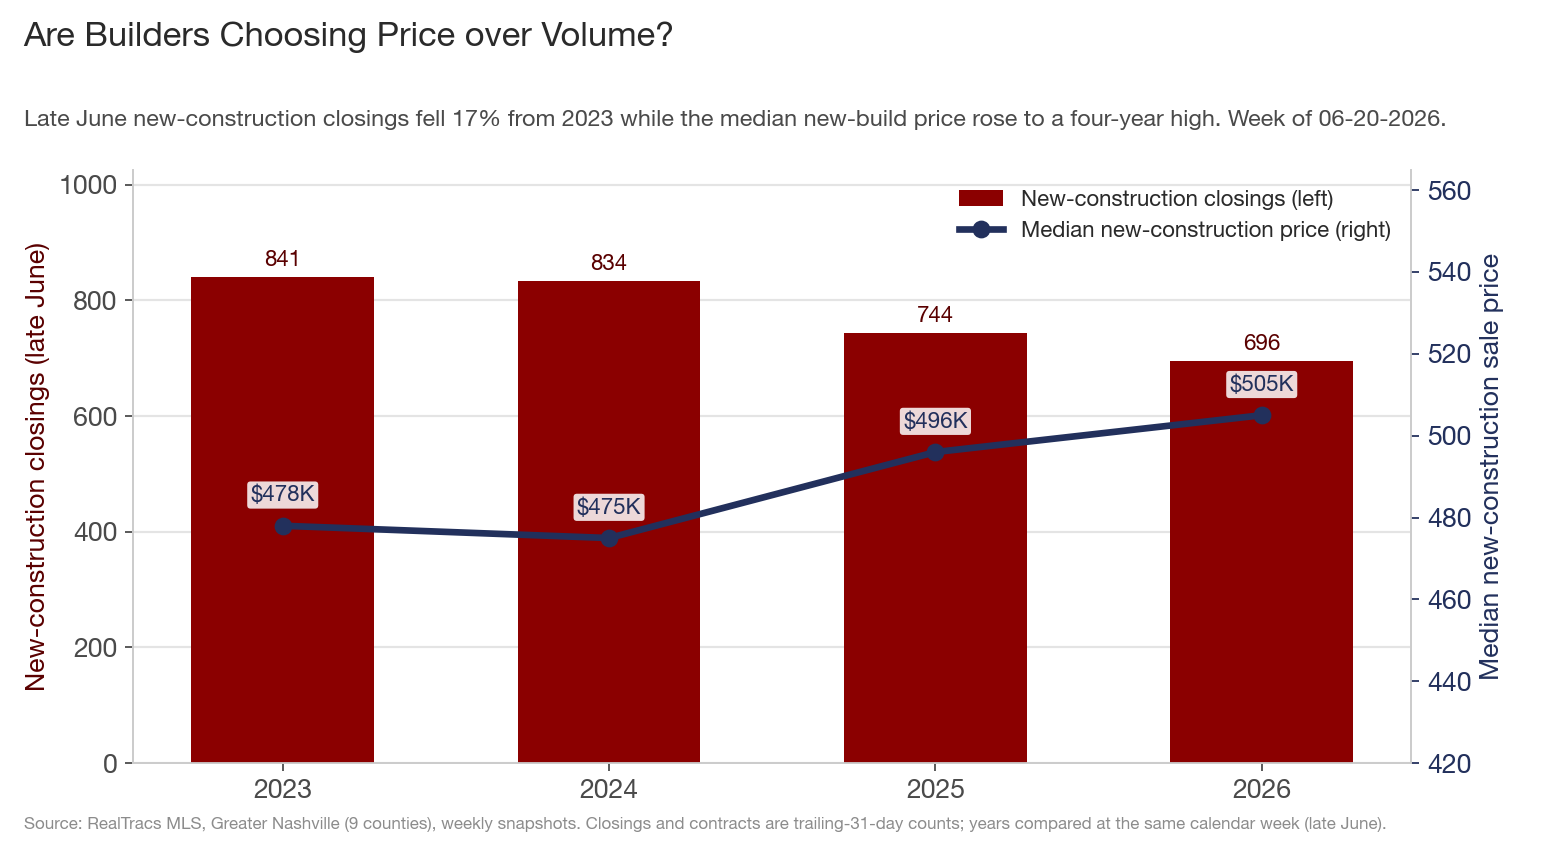
If demand reset to a lower plateau, did builders fight to defend their volume or did they hold price and let volume go? They held price. As closings fell 17%, the median new-construction sale price rose to $505,000, a four-year high. Only 21% of new-construction listings carry a price cut right now, against 43% on the resale side, and new-build price per square foot is holding (+0.4%) while resale's is slipping (-1.2%).
Builders are selling fewer homes at higher prices, on purpose. That choice protects margins and their share of the market's dollars, and it does nothing to defend their share of units, which is what the market-share number counts. It is worth sitting with that the next time you read a builder's earnings call.
6. Where is the pullback happening?
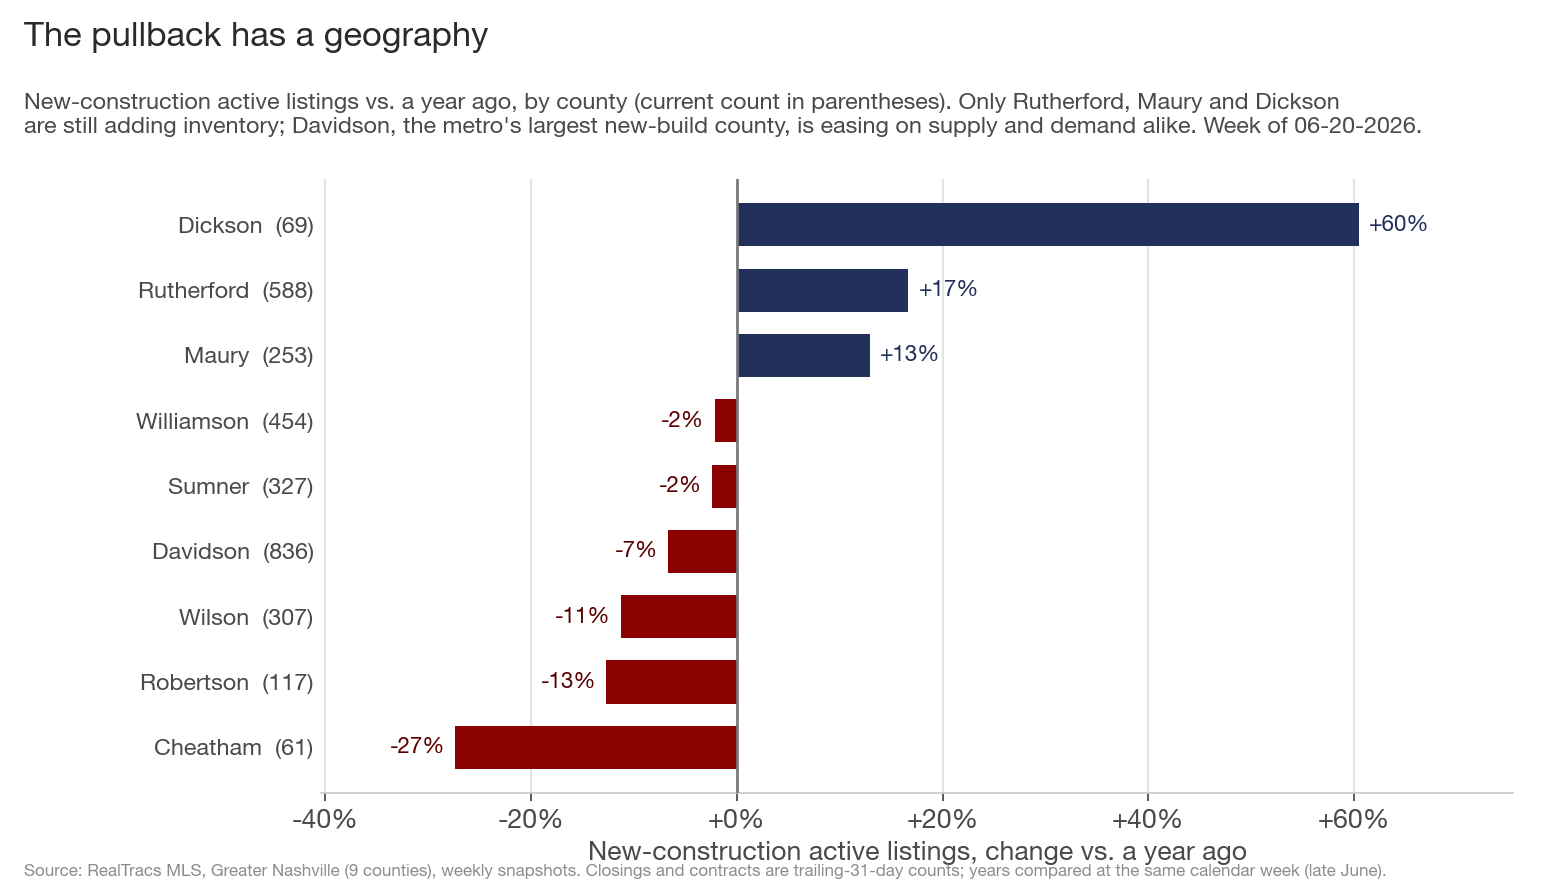
The slowdown is not uniform, and where it is and is not tells you something. New-construction active inventory is rising in just three of nine counties: Rutherford +17%, Maury +13%, and Dickson (off a tiny base). Everywhere else it is flat to falling.
The clearest pullback is in the metro's biggest new-build county. Davidson is easing on both sides of the ledger: inventory down 7%, closings down 20%, contracts down 13%. The exception that says this is not a collapse is Rutherford (Murfreesboro), booming on both sides, inventory +17% and closings +23%. The affordable I-24 growth corridor is still absorbing everything builders put up, while the urban core cools.
7. What are builders actually building now?
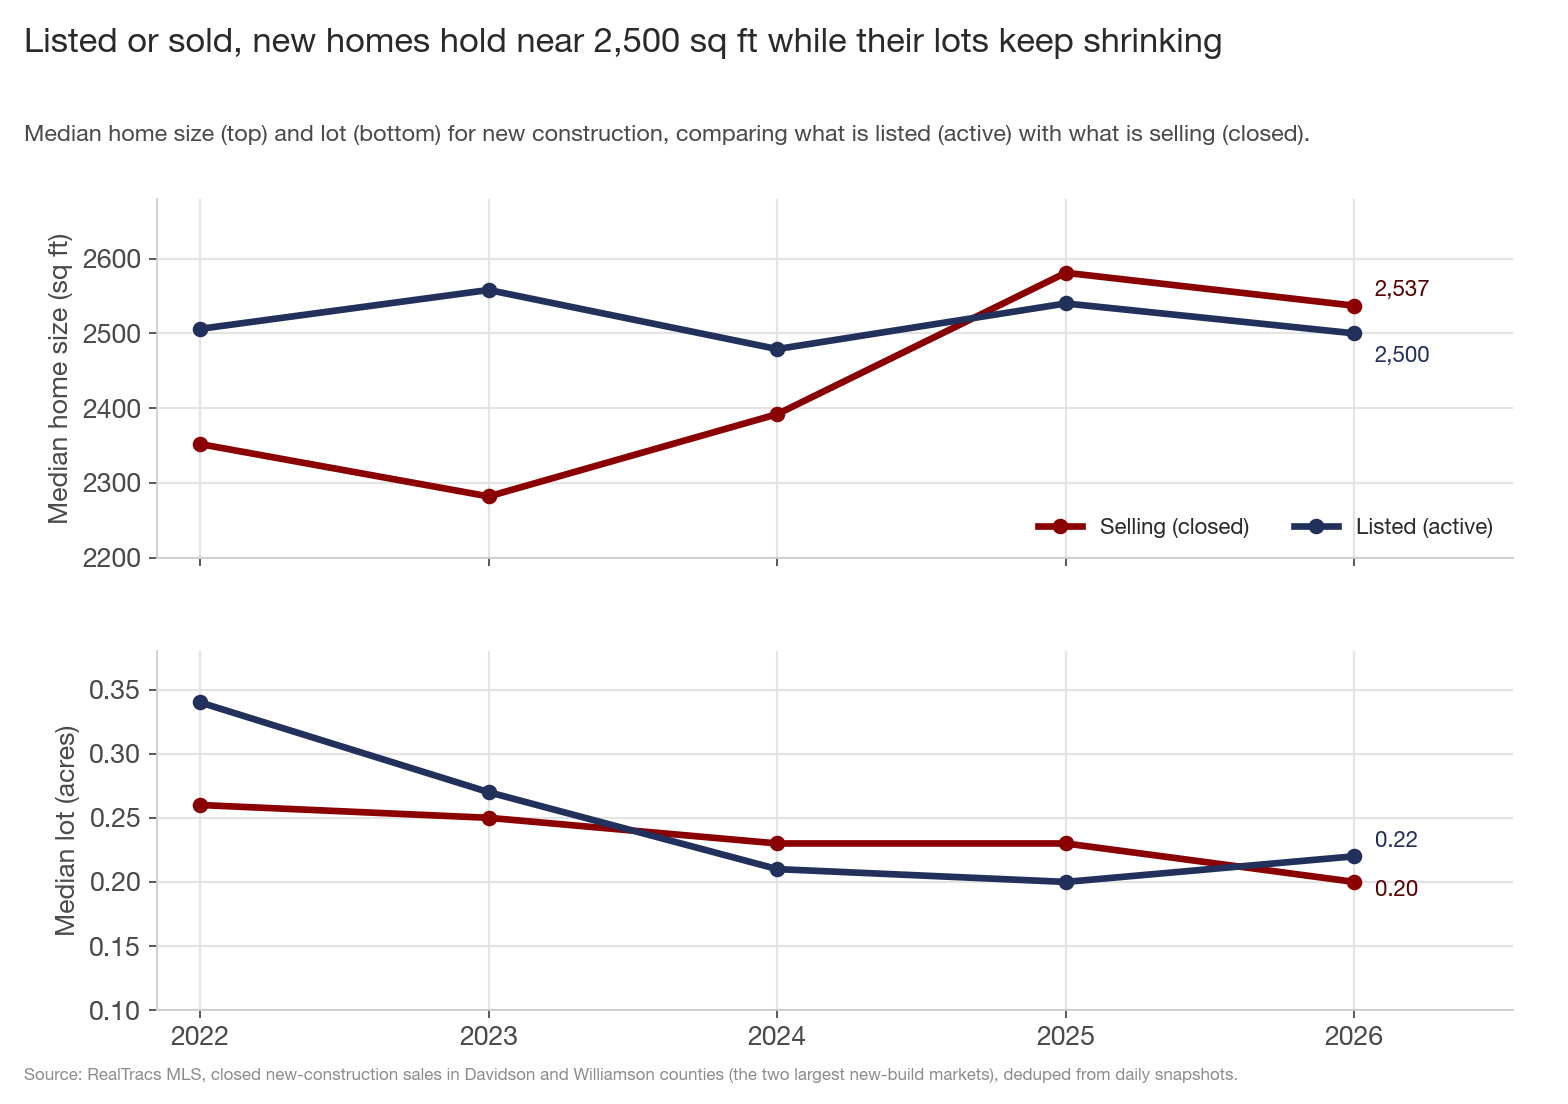
Look at the product two ways: what builders have listed (active) and what is actually selling (closed). They line up. A new-construction home runs about 2,500 square feet whether it is sitting on the market or going under contract, and either way it is bigger than resale, a median around 2,620 square feet for recent closings versus 2,225 for resale. What is selling crept up to that size, from about 2,350 square feet in 2022 to 2,540 now, in line with the roughly 2,500 builders have been listing all along.
The part that keeps moving is the land. The median lot, listed or sold, shrank from roughly 0.3 acres to 0.2 since 2022, and about three in four new homes now sit on less than a quarter-acre, against about 55% of resale. Builders are putting a steady, roomy box on an ever-smaller footprint, and the active inventory mirrors what is selling, so there is no pile of oversized homes that buyers are refusing. A move-up buyer who wants a yard simply finds more land on the resale side, where lots are larger and inventory is now growing 11%. Whether that thins the appeal of new construction is a judgment call, and it is yours to make. (Size and lot figures are Davidson and Williamson, the two largest new-build counties; "listed" is the mid-June active inventory, "selling" is closed sales.)
8. Who are builders building for?
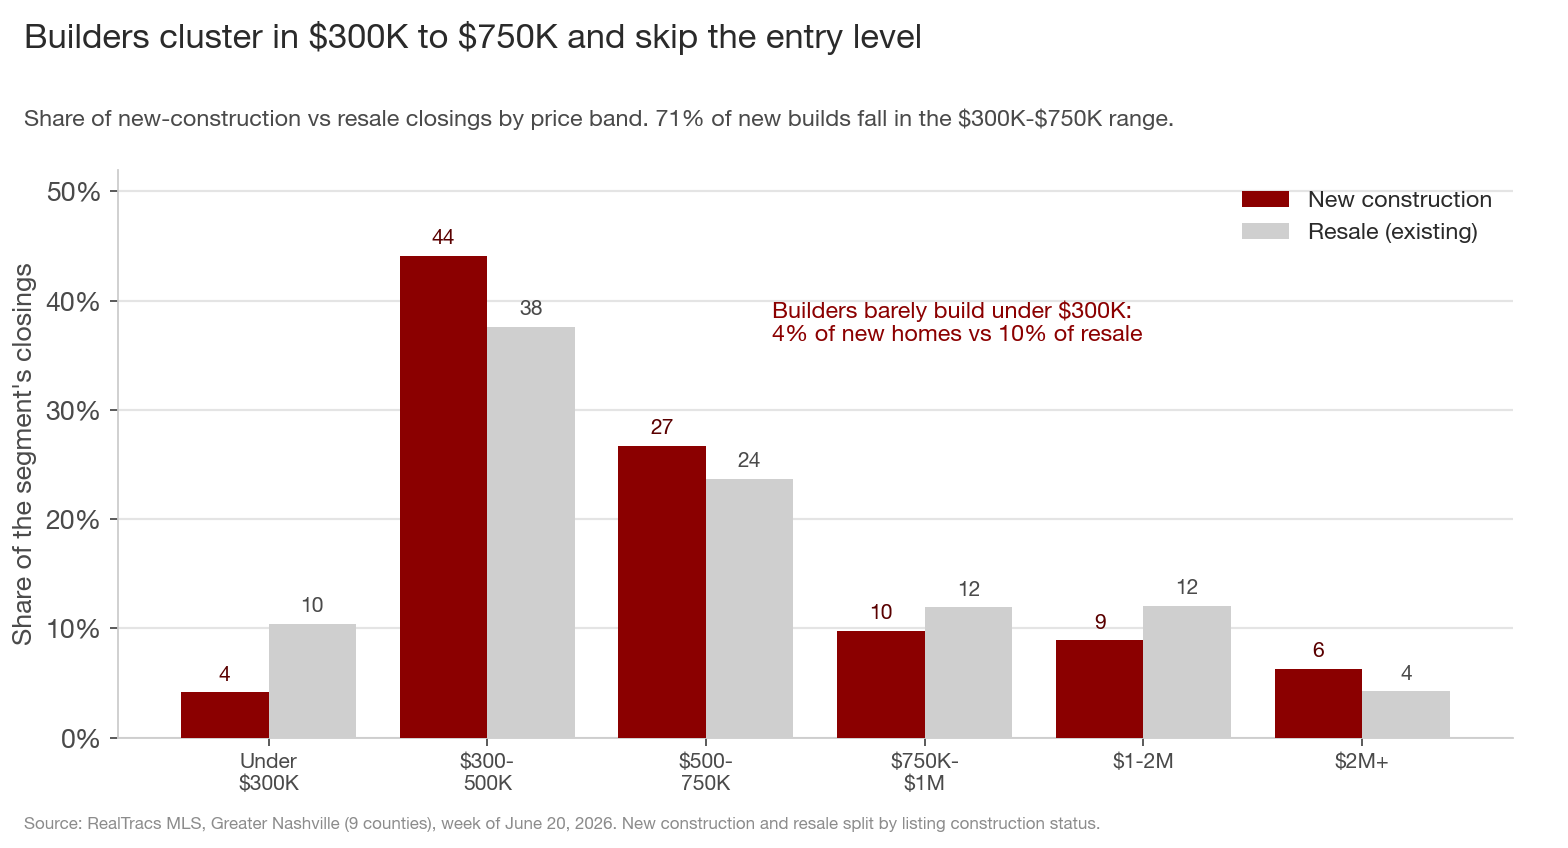
Now look at the price tag and the financing behind it. Builders did not spread their bets. 71% of new-construction closings fall in the $300K to $750K range, and they have nearly walked away from the true entry level: only 4% of new homes close under $300K, versus 10% of resale, and that sub-$300K share has halved since 2023 (8.3% to 4.2%).
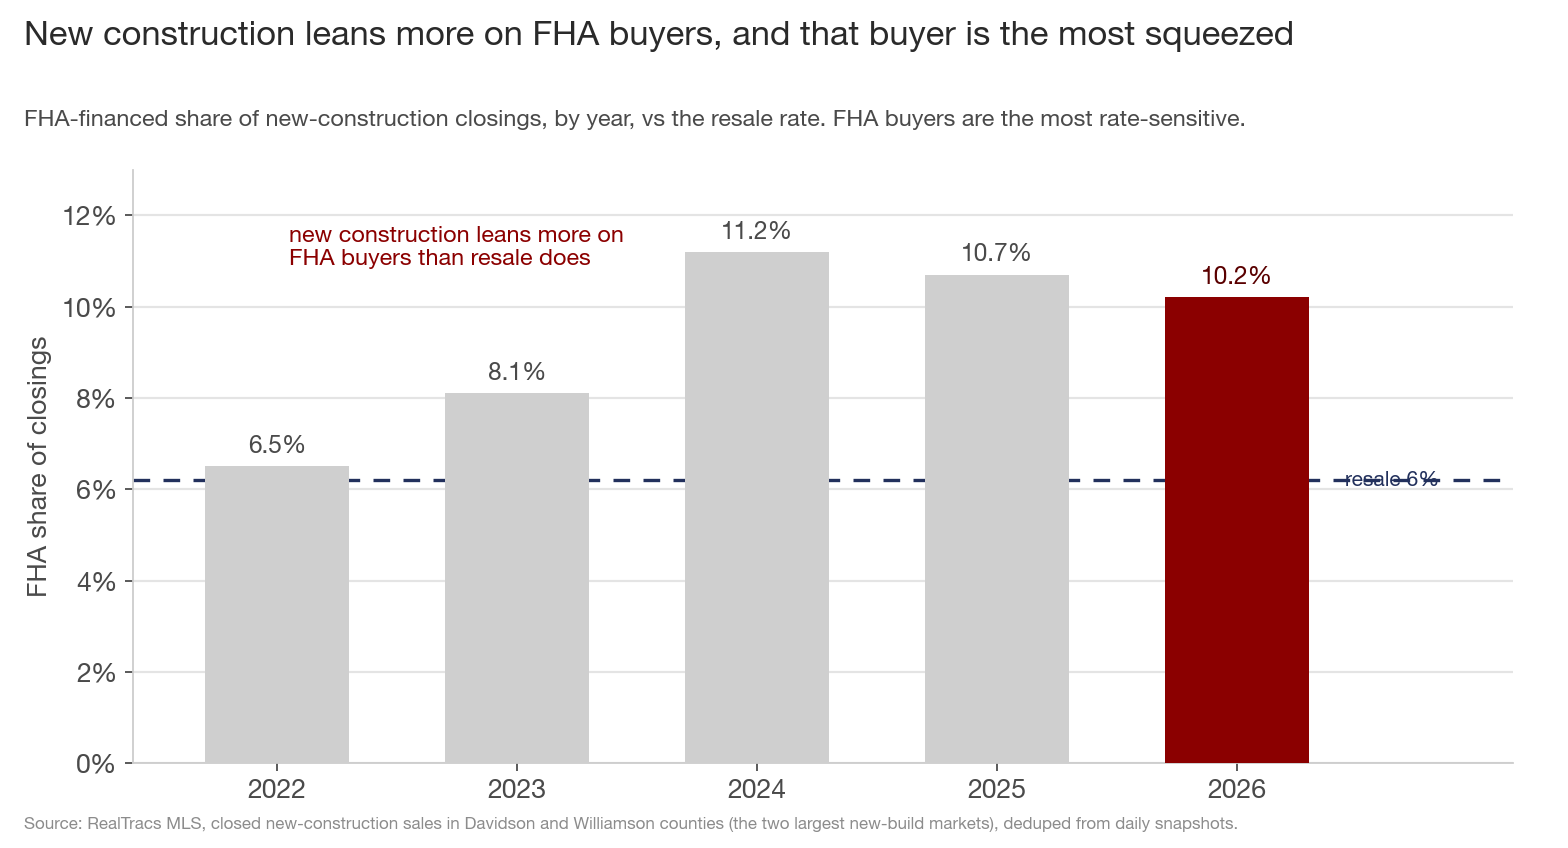
That band runs on the most rate-sensitive buyer in the market. The FHA-financed share of new-construction closings, a stand-in for first-time and lower-down-payment buyers, climbed from 6.5% in 2022 to about 10%, well above the 6% resale rate. New construction leans on the first-time, payment-stretched buyer more than resale does, the same buyer who got knocked out first when mortgage rates parked near 7%. It also explains the price discipline from section 5: cutting the sticker price barely helps a buyer who cannot qualify on the monthly payment, so builders spend instead on rate buydowns and closing-cost credits. (Price-band shares are nine-county; FHA shares are Davidson and Williamson.)
9. Is the new-build brand losing buyers?
One more thread, harder to measure but well documented: the reputation of the national volume builders who put up most of Nashville's new homes. Complaints and defect litigation against the three largest production builders, D.R. Horton, Lennar, and PulteGroup, all active across Middle Tennessee, have been climbing. D.R. Horton's reserves for construction-defect claims rose 57% to $1.1 billion between fiscal 2022 and 2025, as the Wall Street Journal reported, and investigations including Hunterbrook's "House from Hell" and Moneywise's reporting have catalogued homeowners alleging cut corners, cheaper materials, and poorly supervised subcontractors as builders pushed volume. Closer to home, contractor and home-improvement disputes top the complaint list at Tennessee's Division of Consumer Affairs, which the state Attorney General flagged in 2025.
The builders push back, and the pushback is fair to print: they argue defects show up in a small fraction of the homes they deliver and usually trace to subcontractors or aggressive litigation rather than a systemic drop in quality.
I cannot measure how much any of this moves a Nashville buyer's decision, and none of it is proof about a specific local home. But when the dominant new-construction product carries a national brand with a rising defect-claim bill, and buyers suddenly have a growing pile of resale homes to choose from instead, reputation is at least a thread worth weighing alongside the others.
So, why is the share shrinking?
Every thread above is visible in the data. None of them is the single answer, and they are not mutually exclusive:
- The resale half of the market rebounded to 10% above 2023 while new construction fell to a four-year low. Builders lost share partly because the other side grew, not only because they shrank.
- New-construction demand reset to a plateau about 19% below 2023 and has stayed there for two years.
- Builders chose price over volume, holding the line on price (cuts at half the resale rate) and accepting fewer sales.
- The pullback has a geography, concentrated in Davidson and the rural fringe while Rutherford still booms.
- The product drifted to a bigger house on a smaller lot, thinning the reason to pick new over resale if you want land.
- Builders built for the $300K to $750K, FHA-reliant buyer that 7% rates hit hardest, and walked away from the entry level.
- The national volume builders who dominate the new-build market carry a documented, rising defect-claim bill.
Which one is driving the shrinking share? The data can lay the clues out, and it cannot rank them for you. A builder will tell you it is interest rates and a resale market that came back faster than anyone expected. A frustrated shopper might tell you it is the quarter-acre lots or the brand on the yard sign. The honest read is that all of it is happening at once, and you are now better equipped than most to decide which threads carry the weight.
The one thing the data lets us pre-register: with new-construction contracts stuck about 19% below 2023, the share should keep drifting toward 1-in-5 through summer rather than rebounding. If builders' contracts break back above their roughly 790 ceiling, or their price cuts climb toward the resale 40s (watch Davidson first), that is the first sign the slide is bending. Until then, the slice keeps shrinking, and the why is yours to weigh.
Data through the week ending June 20, 2026, Greater Nashville (9 counties: Davidson, Williamson, Rutherford, Wilson, Sumner, Maury, Dickson, Cheatham, Robertson). "Closings" and "contracts" are trailing-31-day counts; "new construction" and "resale (existing)" split listings by construction status, and each year is compared at the same calendar week (late June). Market-share figures are closed sales, January 1 to June 20 of each year. Lot, size, and FHA figures are Davidson and Williamson, the two largest new-build counties. Source: RealTracs MLS.