There's no field in the MLS for "this is an Airbnb." So to track the investor short-term-rental market, you have to read the listing remarks — and in Davidson County, the tell is four letters in all caps: NOO-STR, for non-owner-occupied short-term rental. It's the permit investors actually want, because Metro caps them across most of the county's residential zoning.
That scarcity is supposed to make these properties valuable. The data says the resale market for them has quietly become one of the most lopsided corners of the county. As of this week there are 186 of these listings sitting active in Davidson County, and just 8 went under contract in the past month — about 23 active listings for every one that found a buyer, which works out to roughly two years of inventory at the current pace. And the most recent move is the part that should worry anyone holding one: after thinning over the winter to ~124 in February, the spring listing wave piled it right back up — to 193 by mid-May, near last June's record of 203, and 186 now — while the number of buyers didn't budge.
Here's the full picture — four years of weekly snapshots, plus the hotel-tax data on whether the travel demand underneath these bets is even still growing.
1. Supply ran away from demand
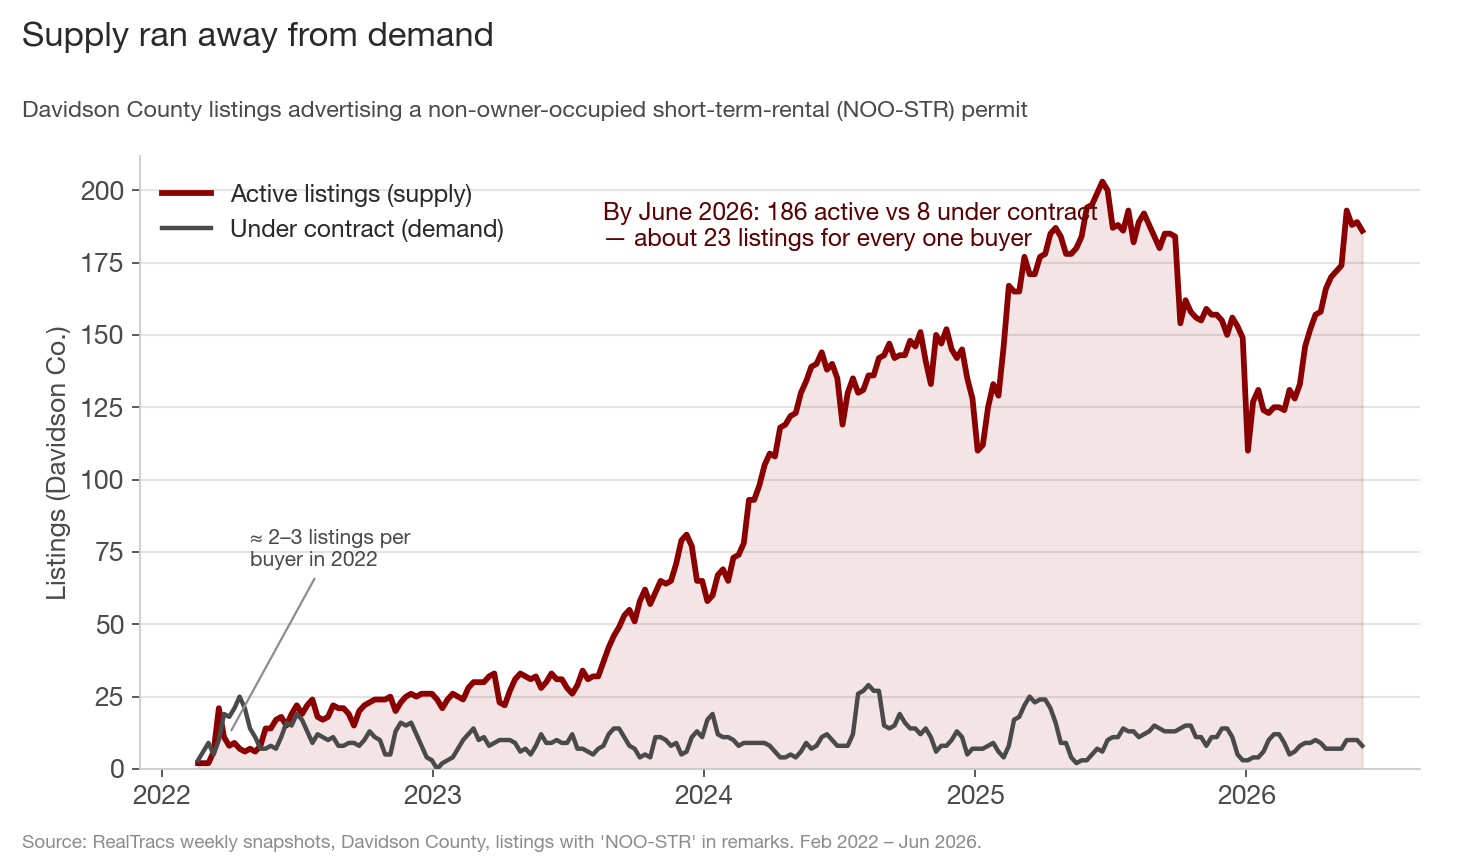
This is the whole story in one chart. The maroon line — active NOO-STR listings — has gone from a couple dozen in 2022 to 186 today, peaking near 203 last June. The grey line is demand: listings actually going under contract. It has never moved. That number is a trailing-31-day count — how many went under contract in the prior month — and across every month of the last four years it has bounced between roughly 5 and 12. It was 7 in June 2022, 9 in 2023, 11 in 2024, 5 in 2025, and 8 now.
So the supply-to-demand ratio — active inventory measured against the listings going under contract each month — went from about 2–3 in 2022, a normal balanced market, to roughly 23 today. Put another way: at the current pace of going under contract, it would take about two years to clear the active NOO-STR shelf, against a few months in 2022. Supply built a mountain. Demand stayed a molehill. The investor thesis that powered the 2021–2022 buying spree — buy the permit, the rest takes care of itself — has run into a wall of people all trying to sell into the same tiny pool of buyers.
2. The travel demand that's supposed to pay for them has flatlined
There are two kinds of demand in this story, and Section 1 only covered one. That chart's grey line was demand for the asset — someone willing to buy an investor-Airbnb, of which there's almost none. But the whole reason to own one is the other demand: travelers paying to sleep in it. That nightly rent is the cash flow the entire thesis rests on — so is it still growing?
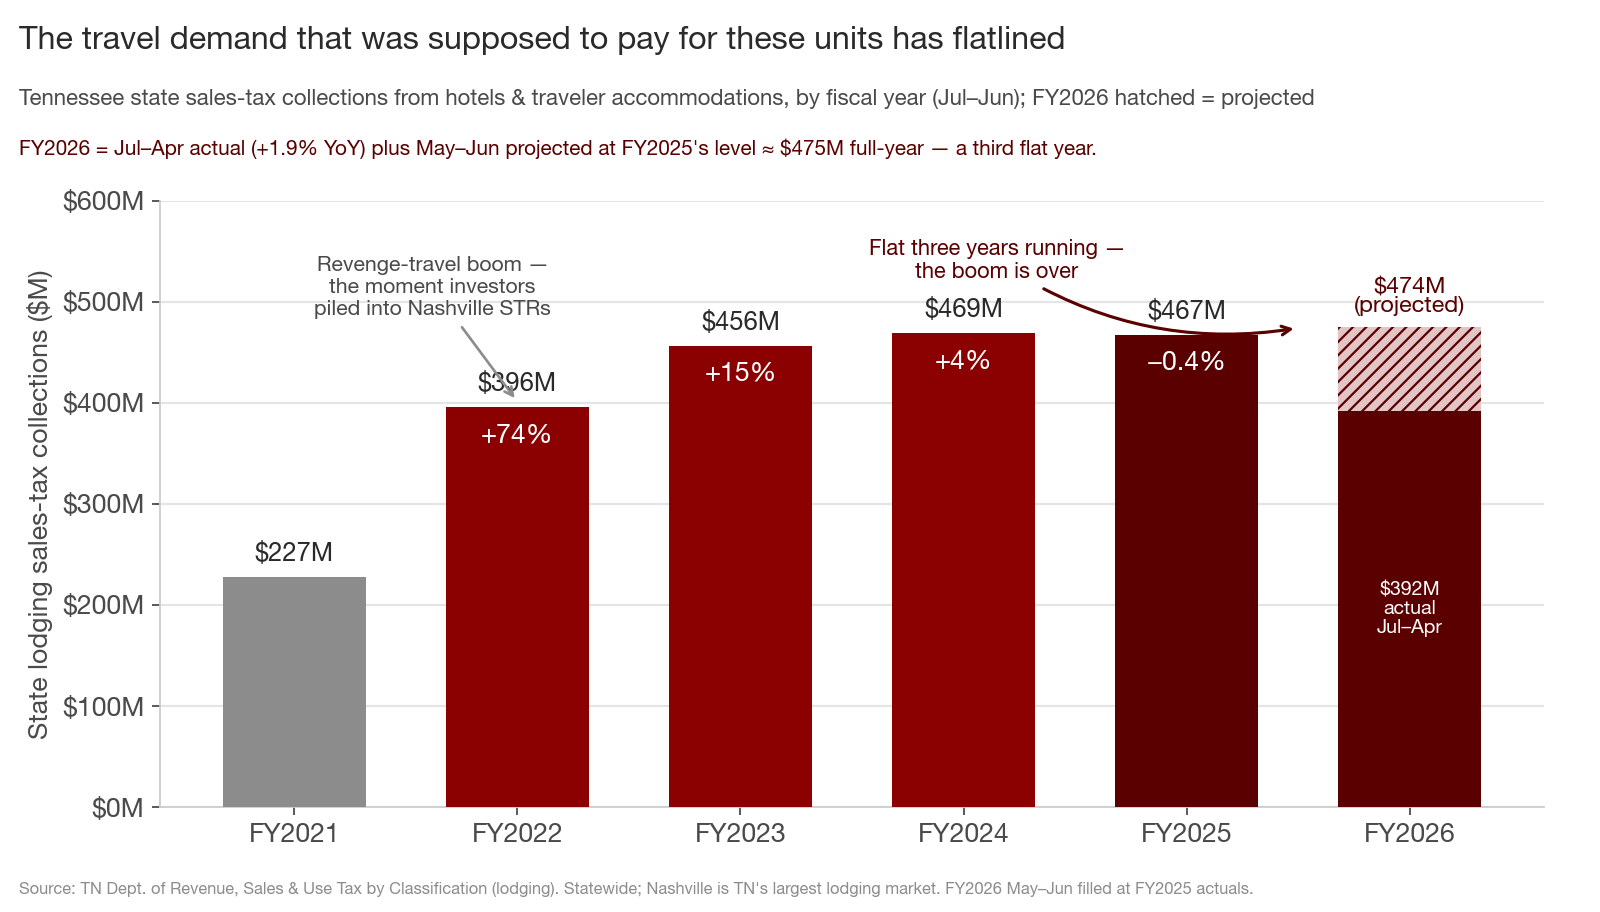
The cleanest public meter on lodging demand is the tax the state collects on it. Tennessee breaks out sales-tax collections by industry, and the line for "Hotels, Bed and Breakfast Inns, and All Other Traveler Accommodations" — the exact category a short-term rental competes in — tracks how much travelers are spending on rooms. It exploded out of the pandemic, up 74% in fiscal 2022 (the year ending that June), from $227M to $396M, as revenge travel roared back. That was the moment investors piled into Nashville STRs: rent checks were growing so fast that almost any purchase price penciled. Then it folded a step at a time — +15% in FY2023, +4% in FY2024, and −0.4% in FY2025, the first down year since the pandemic. Through the first ten months of FY2026 (July–April), collections are up just 1.9% over the same stretch a year earlier — barely positive before inflation, and negative after it. Fill the two unreported months (May–June) at last year's level and full-year FY2026 projects to about $475M — essentially flat with FY2025 and FY2024 (the hatched bar), a third straight year on the same plateau.
So the room-revenue pie stopped expanding around 2024 — exactly as the supply of units fighting over it climbed 6× (Section 1). Flat pie, more forks: revenue per unit falls. That's the quiet math that broke the thesis, and it surfaces downstream as the price cuts (Section 4) and the marked-down asset (Section 5). A buyer running the numbers today isn't looking at the 2022 growth curve — they're staring at flat rents and more competition every month.
One honest caveat: this is statewide Tennessee — the state doesn't publish lodging tax by county in this series. But Nashville is its single largest lodging market, so the statewide line is heavily a Nashville line, and the Nashville-specific read agrees. STR, the firm that tracks hotel performance, ranks Greater Nashville a top-25 U.S. hotel market; in late January 2026 it was one of the hardest-hit big markets in the country when Winter Storm Fern moved through — weekend revenue per available room down 52% in a single week, against flat-to-negative national hotel demand. One storm week isn't a trend, but it's a reminder of what nightly-rental income really is: lumpy, weather- and event-dependent revenue, not a lease.
3. It's not a labeling quirk — the segment genuinely tripled
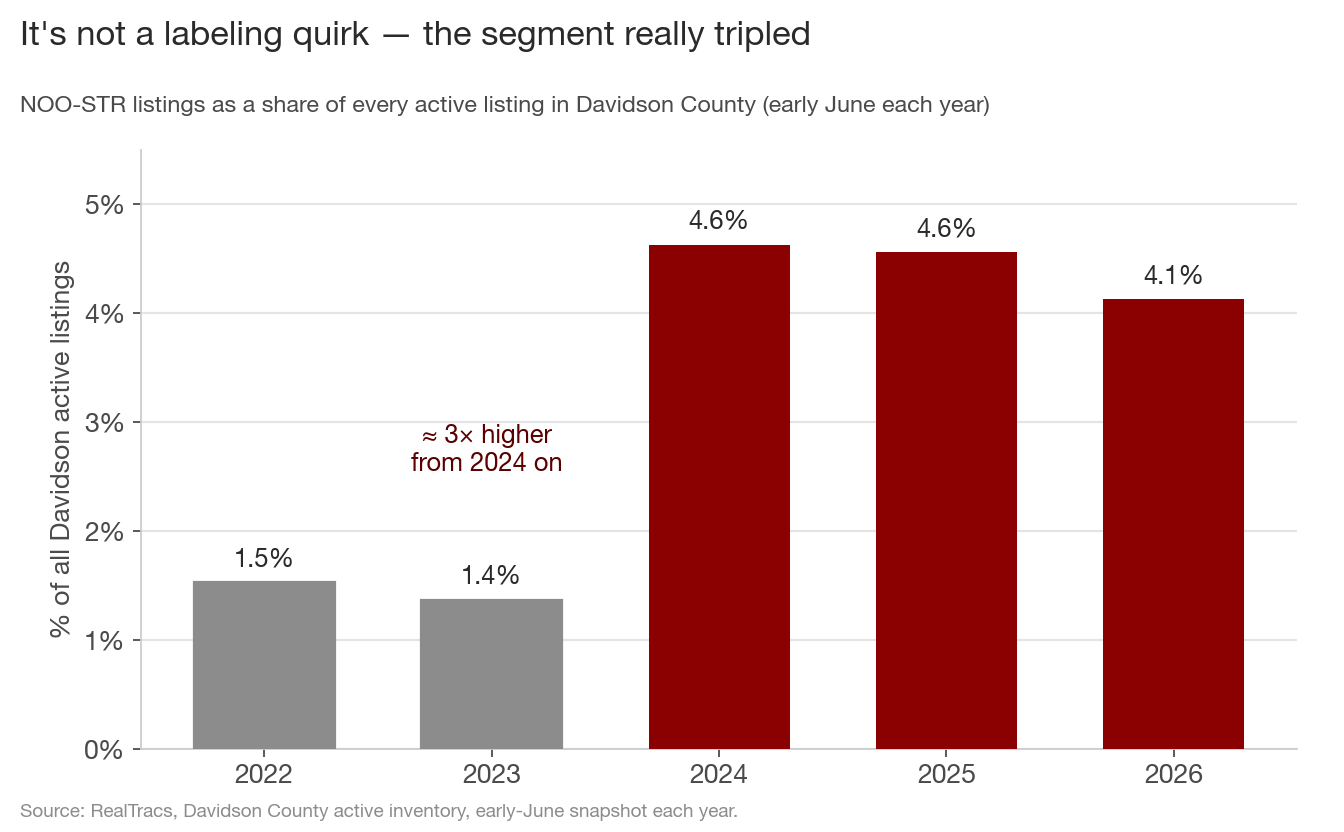
Whenever a metric is pulled from free-text remarks, the honest first question is: did the thing grow, or did agents just start typing the tag more? So I checked it against the one denominator that can't be gamed — every active listing in Davidson County.
In 2022 and 2023, NOO-STR listings were about 1.4–1.5% of all active inventory. From 2024 on they've held around 4.1–4.6% — roughly triple the footprint, even measured against a total market that itself grew sharply over the same span. This isn't a tagging artifact. A real, growing slice of everything for sale in Davidson County is now investor short-term-rental product that someone is trying to offload. The share has plateaued near its high, not receded — the pile isn't clearing.
4. A third of these listings are already cutting price
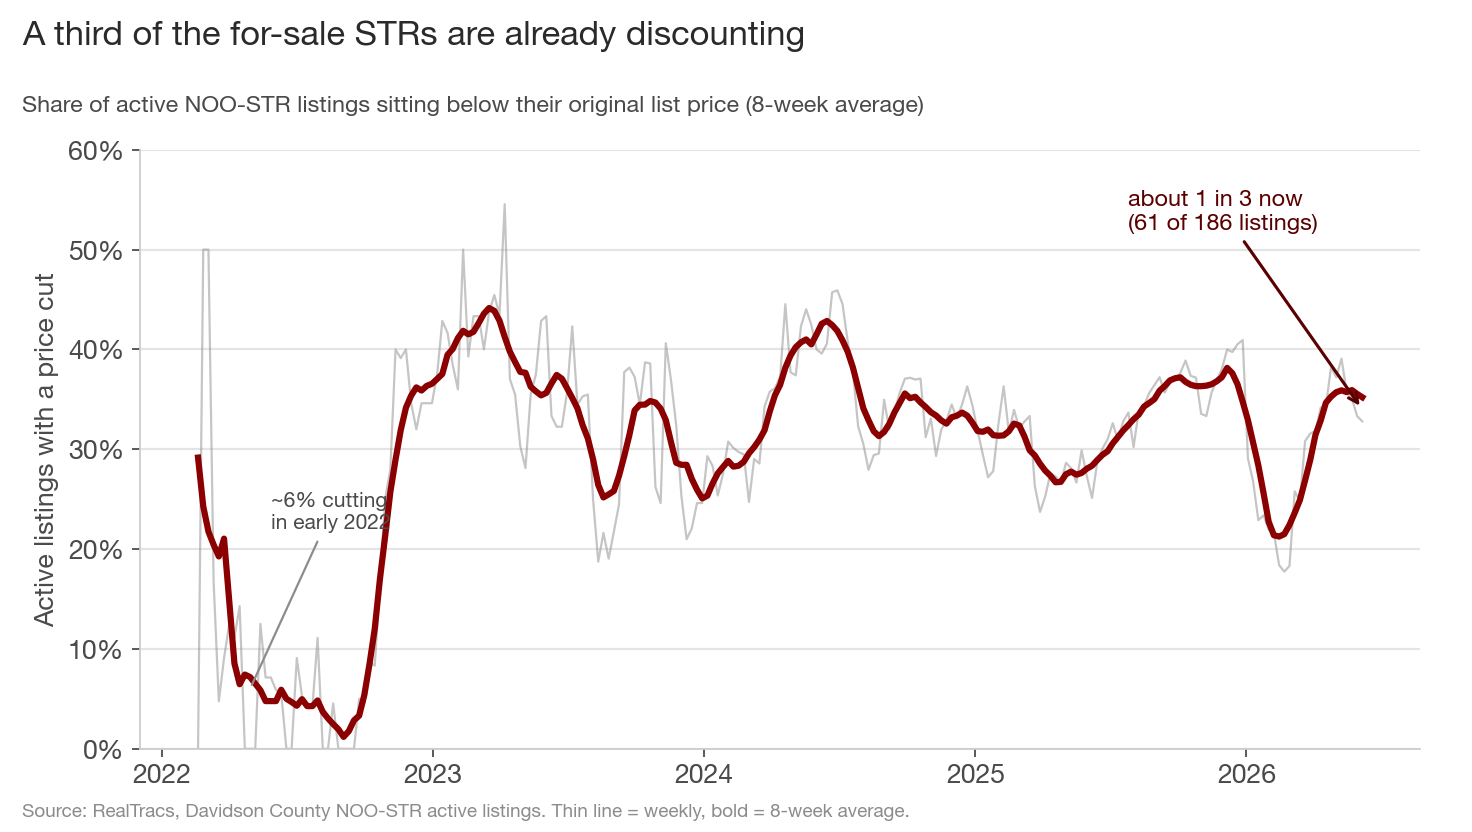
When supply outruns demand by 23 to 1, sellers blink. In early 2022, about 6% of active NOO-STR listings sat below their original ask. That rate climbed through 2023 and has lived in the 30–44% range ever since. This week, 61 of the 186 active listings — right at one in three — are carrying a price cut. Three weeks ago the count hit 69, the most NOO-STR listings discounting at once in the four years I've tracked this.
For context, the broader Greater Nashville market crossed a 35% price-cut rate this spring and made headlines for it. This niche got there earlier and has more or less stayed there. A third of sellers cutting isn't a panic — but it's a market where the marginal seller has already conceded that the original number was a fantasy.
5. The asset itself has repriced — and only the cheap end is moving
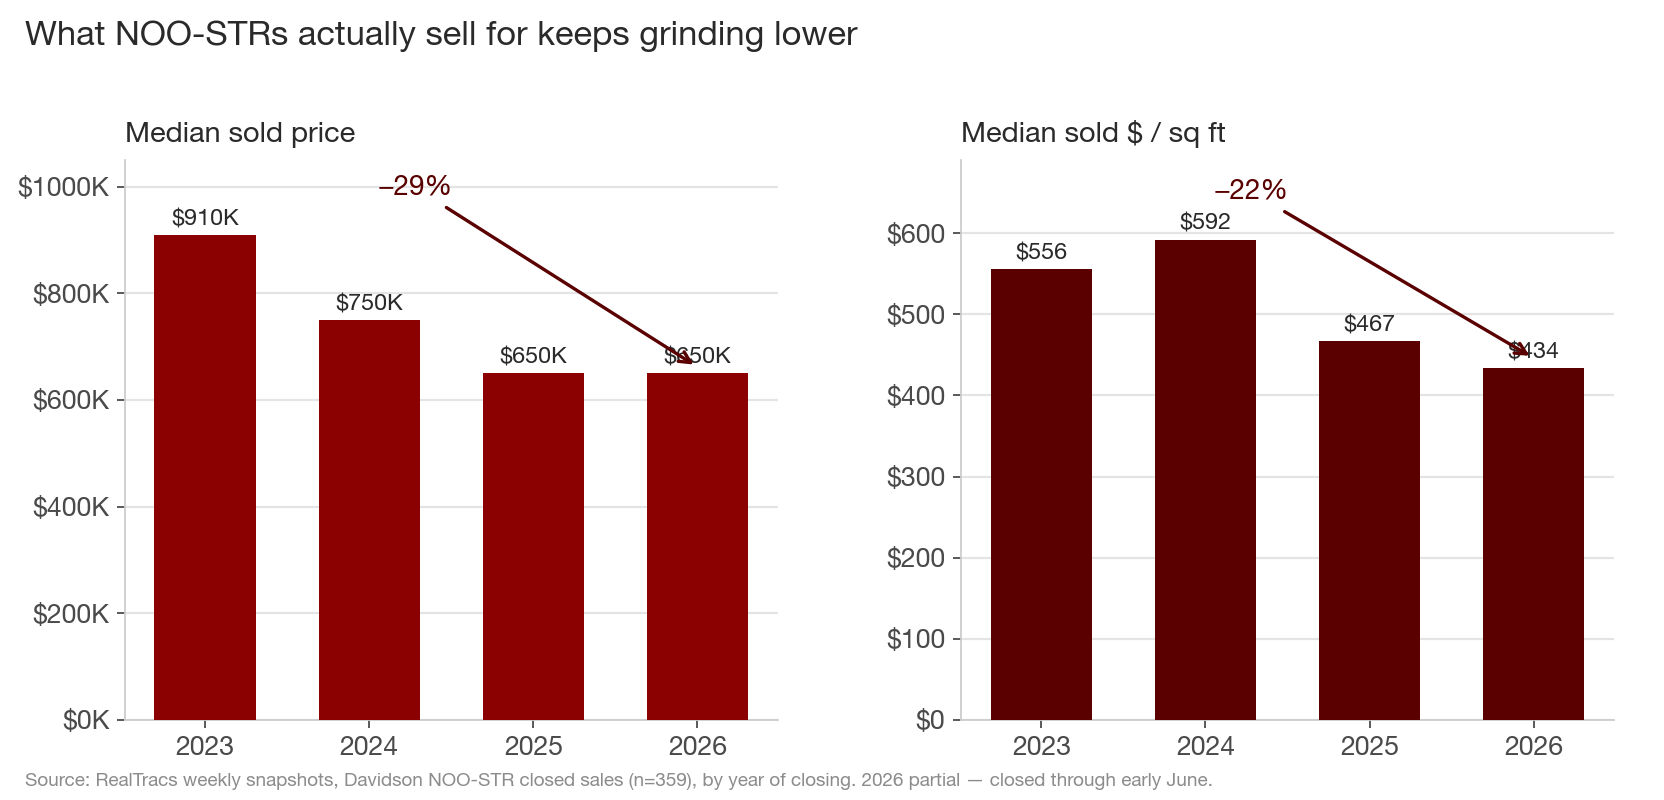
Cuts on individual listings are one thing; the whole asset class resetting is another. Look at what these properties actually sell for — not what sellers ask. The median sold price of a NOO-STR has fallen every single year: $910K in 2023 → $750K in 2024 → $650K in 2025, and $650K so far in 2026 — down about 29%. Per square foot, the closing price has slid from $556/sq ft in 2023 to $434 now, roughly −22% (and −27% off the 2024 peak of $592). That's a steeper drop than the asking prices show — sellers keep listing high, but the closing table keeps marking the asset down.
The demand side confirms which properties clear. The handful of NOO-STRs that went under contract in the past month did so at a median around $505K — below even those depressed sold medians. Buyers, where they exist at all, are picking off the cheapest, most-discounted units; the $800K-and-up tier is largely sitting — 62 active listings ask $800K or more, 29 of them above $1M.
6. The glut is an urban-core, tall-skinny story
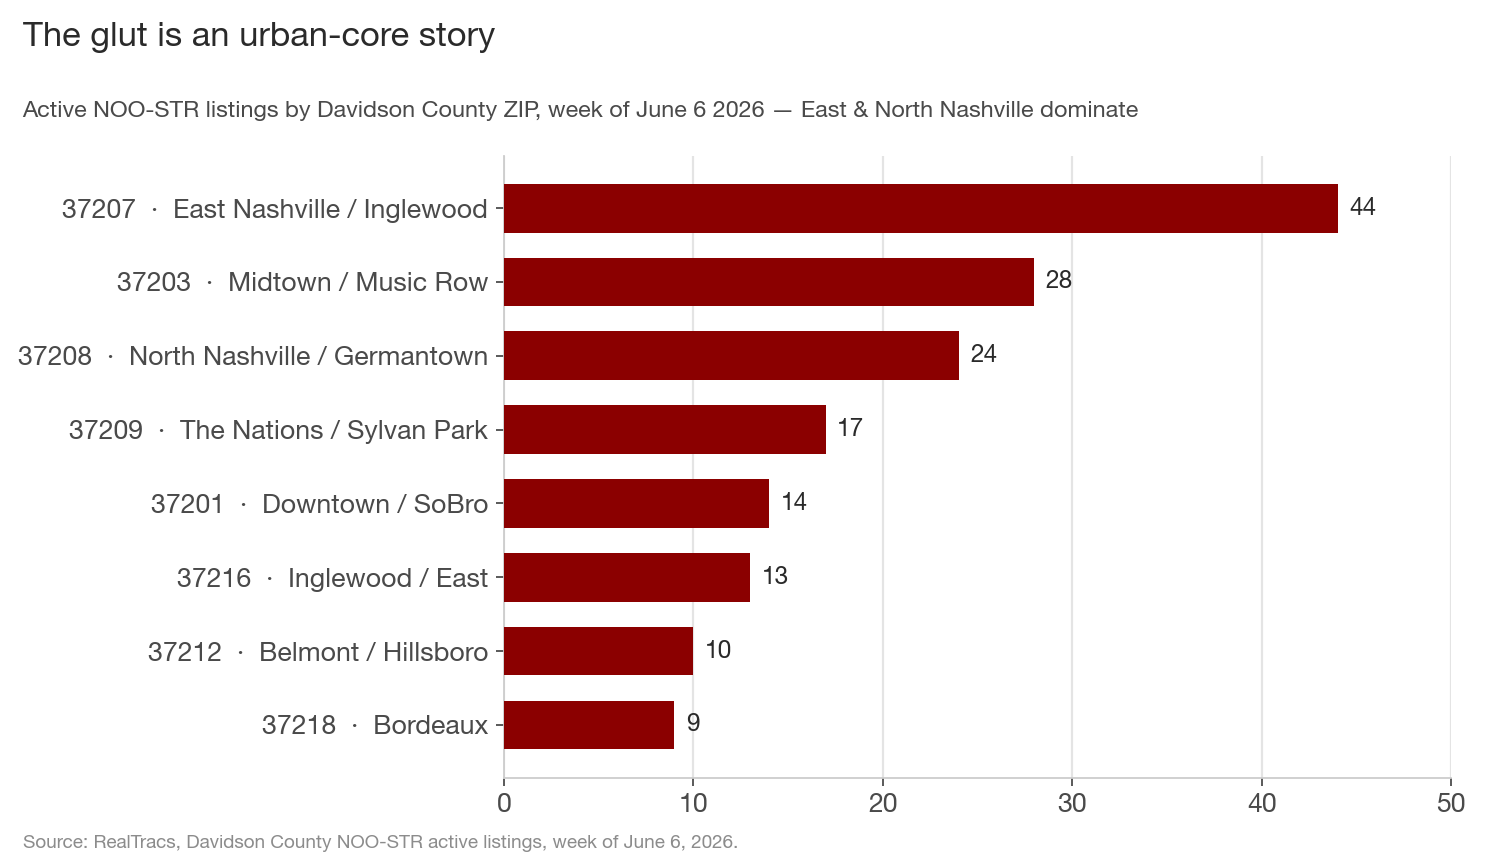
This isn't spread evenly across the county — it's concentrated exactly where the Airbnb boom was. 37207 (East Nashville / Inglewood) leads with 44 active listings, followed by 37203 (Midtown / Music Row, 28), 37208 (North Nashville / Germantown, 24), and 37209 (The Nations / Sylvan Park, 17). The urban core — the walk-to-Broadway, walk-to-bars geography that tourists pay for — is where the unsold investor inventory has stacked up.
And it's a specific product: of the 186 active listings, the overwhelming majority are attached units, condos, and townhomes — 63 "HPR-Attached" (the tall-skinny duplex halves builders threw up by the thousand for exactly this trade), plus 37 condos, 36 townhomes, and 27 more condos by another label. Single-family detached is a rounding error. One more tell: about 80% are now existing/resale, not new construction — the new-build share of this segment has fallen from ~30% in 2023 to ~19% today. Early in the cycle this was builders selling fresh STR product. Now it's existing owners trying to get out.
7. The investor scorecard: the flip is dying
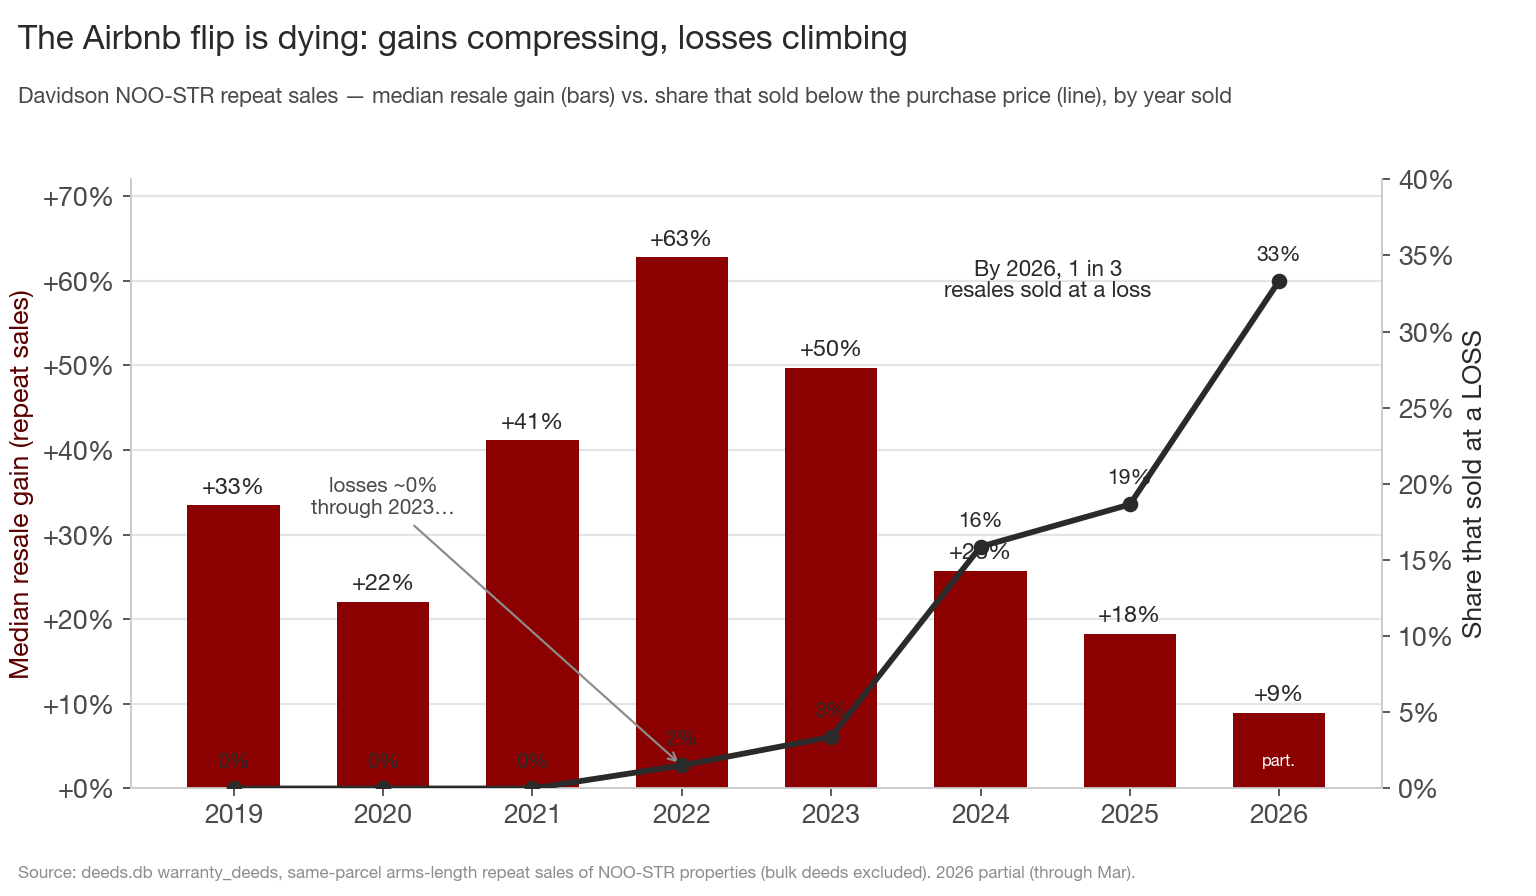
Everything above is asking and selling prices. This last chart is about what investors actually made on the way out. I matched every NOO-STR property to its full deed history and pulled the repeat sales — the same parcel bought and later sold again — to read the realized gain or loss on each flip. Bulk deeds, where a single transaction covers a whole building, are stripped out, so every figure is a true one-unit buy-to-sell.
It's a clean fade. A NOO-STR resold in 2021 booked a median +41% gain; in 2022, +63%; in 2023, +50%. Then it rolls over — +26% in 2024, +18% in 2025, and just +9% so far in 2026. And the downside, which barely existed before, shows up right on cue: almost none of the 2021–2023 resales lost money, but 16% did in 2024, 19% in 2025, and a full third — 33% — of 2026 resales so far have sold for less than the owner paid.
That's the whole thesis in one frame. The trade worked while the asset appreciated fast enough to carry a thin-margin rental; now that sale prices have rolled over (Section 5) and the nightly-rent growth that justified the purchase has gone flat (Section 2), the resale is a coin-flip that increasingly comes up short. The investors who bought the story late are the ones writing the checks.
What this adds up to
- Supply 6× since 2023; demand never moved. Active NOO-STR listings sit at 186 vs. ~30 in 2023, while under-contract volume — a trailing-31-day count — has held at ~5–12 the entire time. That's about 23 active listings for every one going under contract, roughly two years of supply, versus 2–3 in 2022.
- The travel demand behind the bet has flatlined. Tennessee hotel & traveler-accommodation tax collections grew 74% in FY2022, then decelerated to +15%, +4%, and −0.4% by FY2025 — the first down year since the pandemic — and just +1.9% through April 2026. The room-revenue pie stopped growing while the number of units chasing it rose 6×.
- It's real, not a tagging quirk. These listings tripled their share of all Davidson inventory, from ~1.4% to ~4.5%, and have stayed there.
- A third are discounting — 61 of 186 this week, with a record 69 three weeks ago.
- The asset repriced — median sold price is down ~29% since 2023 ($910K → $650K) and sold $/sq ft down ~22%; the listings going under contract now cluster around $505K, below even those depressed sold medians.
- It's an urban-core, attached-product, resale story — East and North Nashville, tall-skinnies and condos, increasingly existing owners heading for the exit.
- The realized scorecard says the same thing. Among Davidson NOO-STR repeat sales, the median resale gain compressed from +41% (2021) to +9% (2026), and the share that sold at a loss climbed from near zero through 2023 to 33% in 2026 — the flip that defined the segment has stopped paying.
For anyone holding a NOO-STR to sell, the comp set is brutal and getting more crowded by the week; the listings that move are aggressively priced and usually already cut. For buyers and investors, this is the rare Nashville segment where leverage is entirely on your side — there are 23 of these for every one going under contract, and the seller pool is visibly tired. For the "permit equals scarcity equals price" thesis, this is the counter-evidence: the permit may be scarce, but permitted listings are not, and the market is pricing the difference.
Here's the falsifiable part to watch over the next 30–60 days. Demand is the variable that has never broken out: monthly under-contract volume (the trailing-31-day count) has not sustainably cleared ~12–15 in two full years. If it finally pushes above ~15 in a month this summer, a bottom is forming. If they don't — the base case — expect the price-cut count to keep climbing past this spring's record of 69 and the median ask to test below $675K. And there's a second dial now on the demand side: another flat-to-down year in Tennessee's lodging-tax prints means the per-unit rent math keeps eroding, with no demand tailwind to bail out the glut. Either way, the share-of-market line is the tell: as long as it holds above 4% while overall inventory keeps rising, the absolute pile of unsold investor-Airbnbs keeps growing.
Data through the week ending June 6, 2026. Davidson County only (including "Davidson (TN)"). "NOO-STR listings" are MLS listings whose remarks advertise a non-owner-occupied short-term-rental permit (matching NOOSTR / NOO-STR / NOO STR / NOO Short-Term) — a proxy, since the MLS has no dedicated STR field. Active counts are point-in-time from weekly RealTracs snapshots; the under-contract figure is a trailing-31-day count of listings that went under contract in the prior month, and closed is a trailing count of recent sales. The under-contract and closed pools are small, so single-snapshot medians are noisy and the ratio and share metrics are the more reliable read. Source: RealTracs weekly Davidson/Williamson exports. Hotel-demand figures: Tennessee Department of Revenue, Sales & Use Tax by Classification (lodging line), fiscal years 2021–2026, statewide — relabeled under NAICS from FY2024 (~1% level seam). Hotel-performance color: STR / CoStar weekly U.S. report, week of Jan. 18–24, 2026.