Originally published on Substack
Last week this was one of my most bullish seller charts. Seven days later, it completely reversed. I think I figured out why it moved so fast.
If you follow these weekly updates, you know I track three core metrics: active listings, contract volume, and price cuts as a percentage of active listings. That third one was solidly bullish for sellers last week.
This week it flipped. Both the current reading and the trend. In seven days. That surprised me enough to change how I track neighborhoods. Let me walk you through what happened.
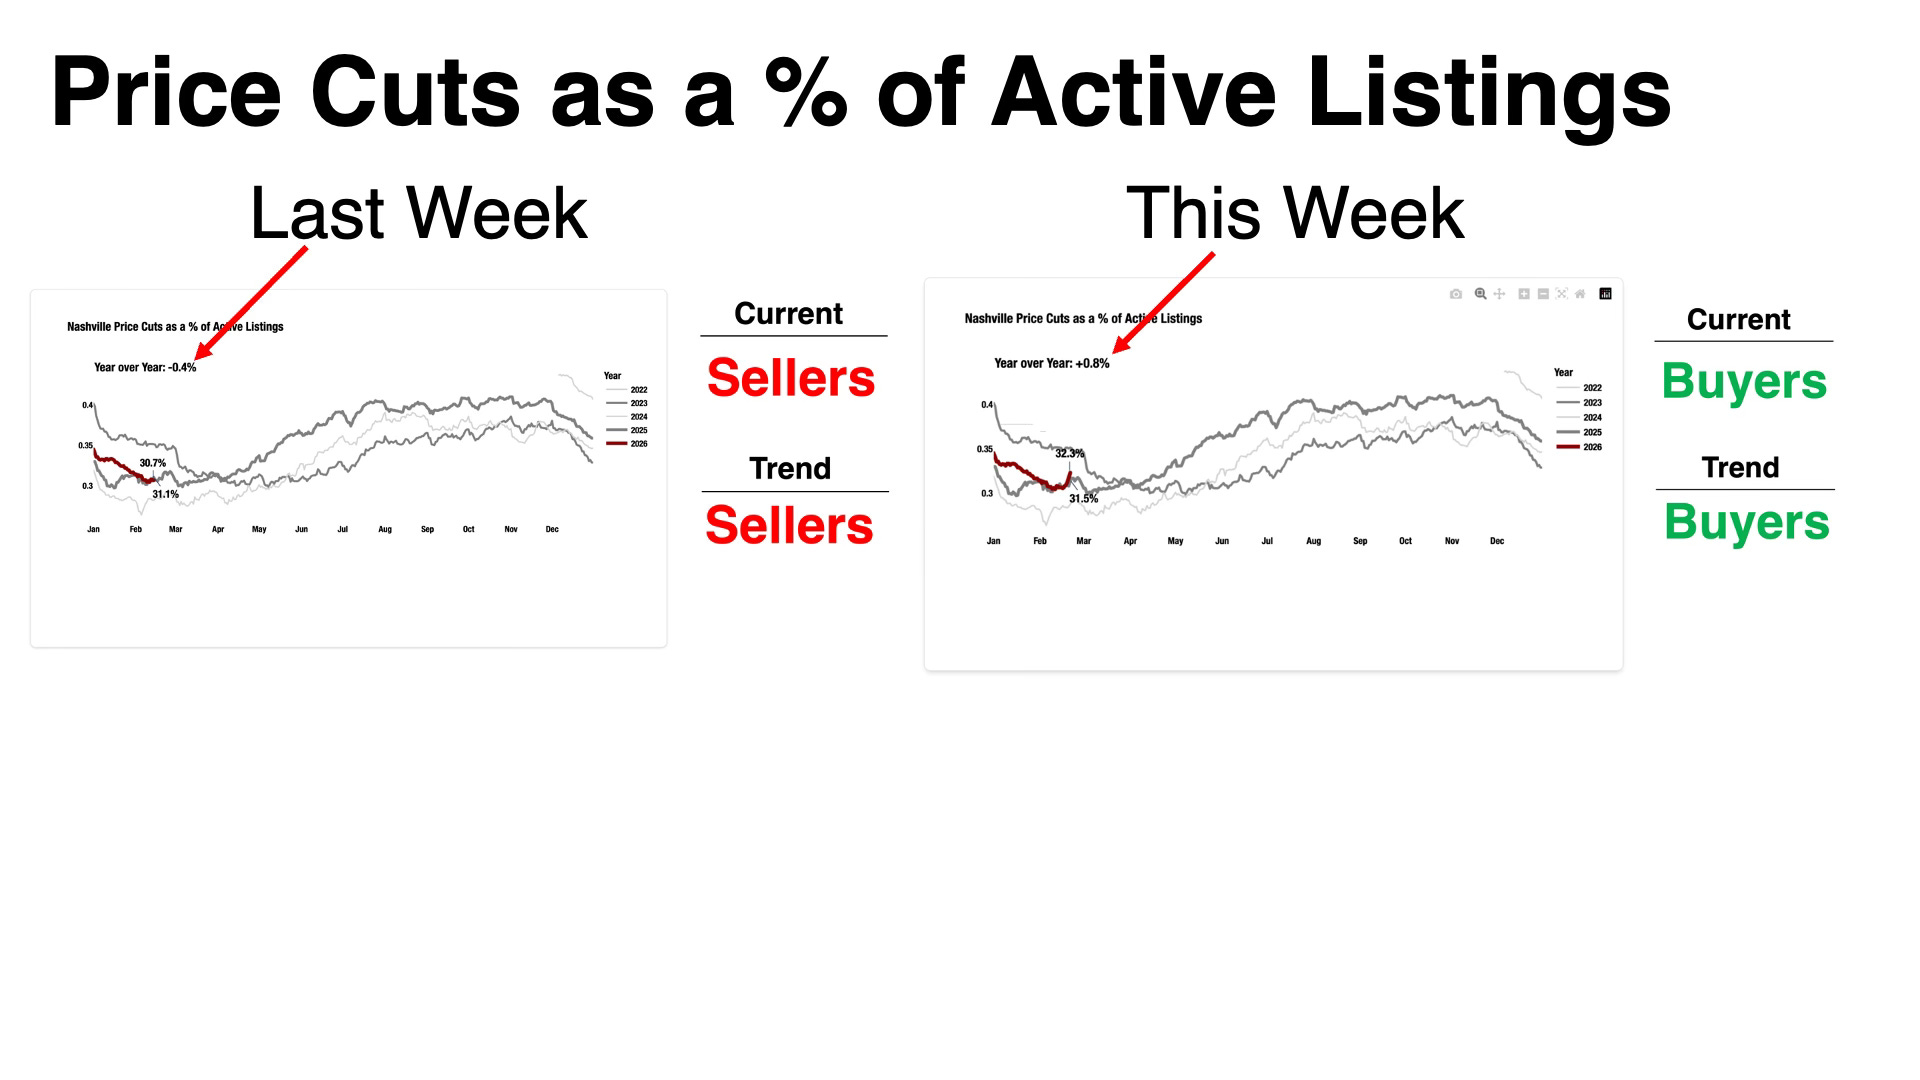
The Flip
Last Week: 30.7% of active listings had a price cut, compared to 31.1% at the same point in 2025. Slightly fewer sellers were cutting prices than last year. (Seller Signal).
This Week: 32.3% versus 31.5%. Now, more sellers are cutting prices than last year. Both the current reading and the trend have flipped from Sellers to Buyers.
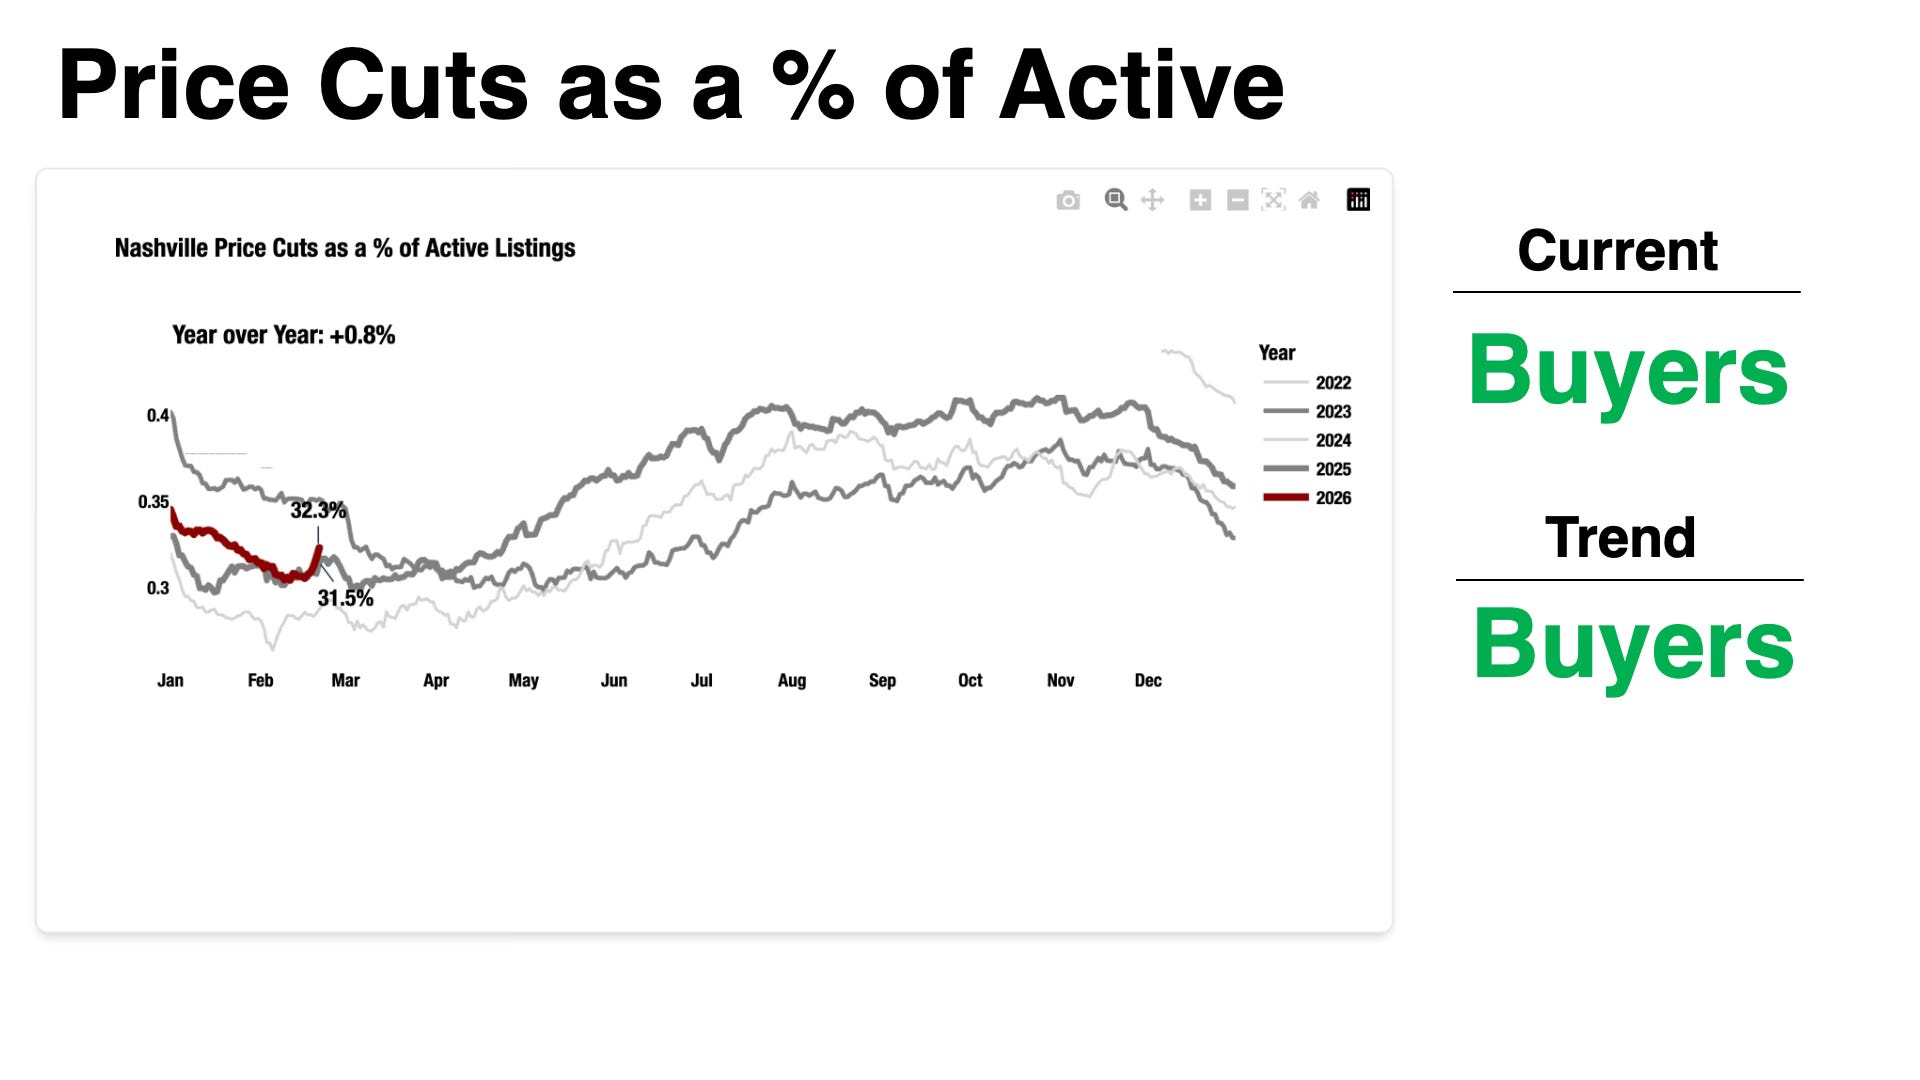
And here’s what keeps nagging at me: this metric undercounts the true amount of Price Cuts.
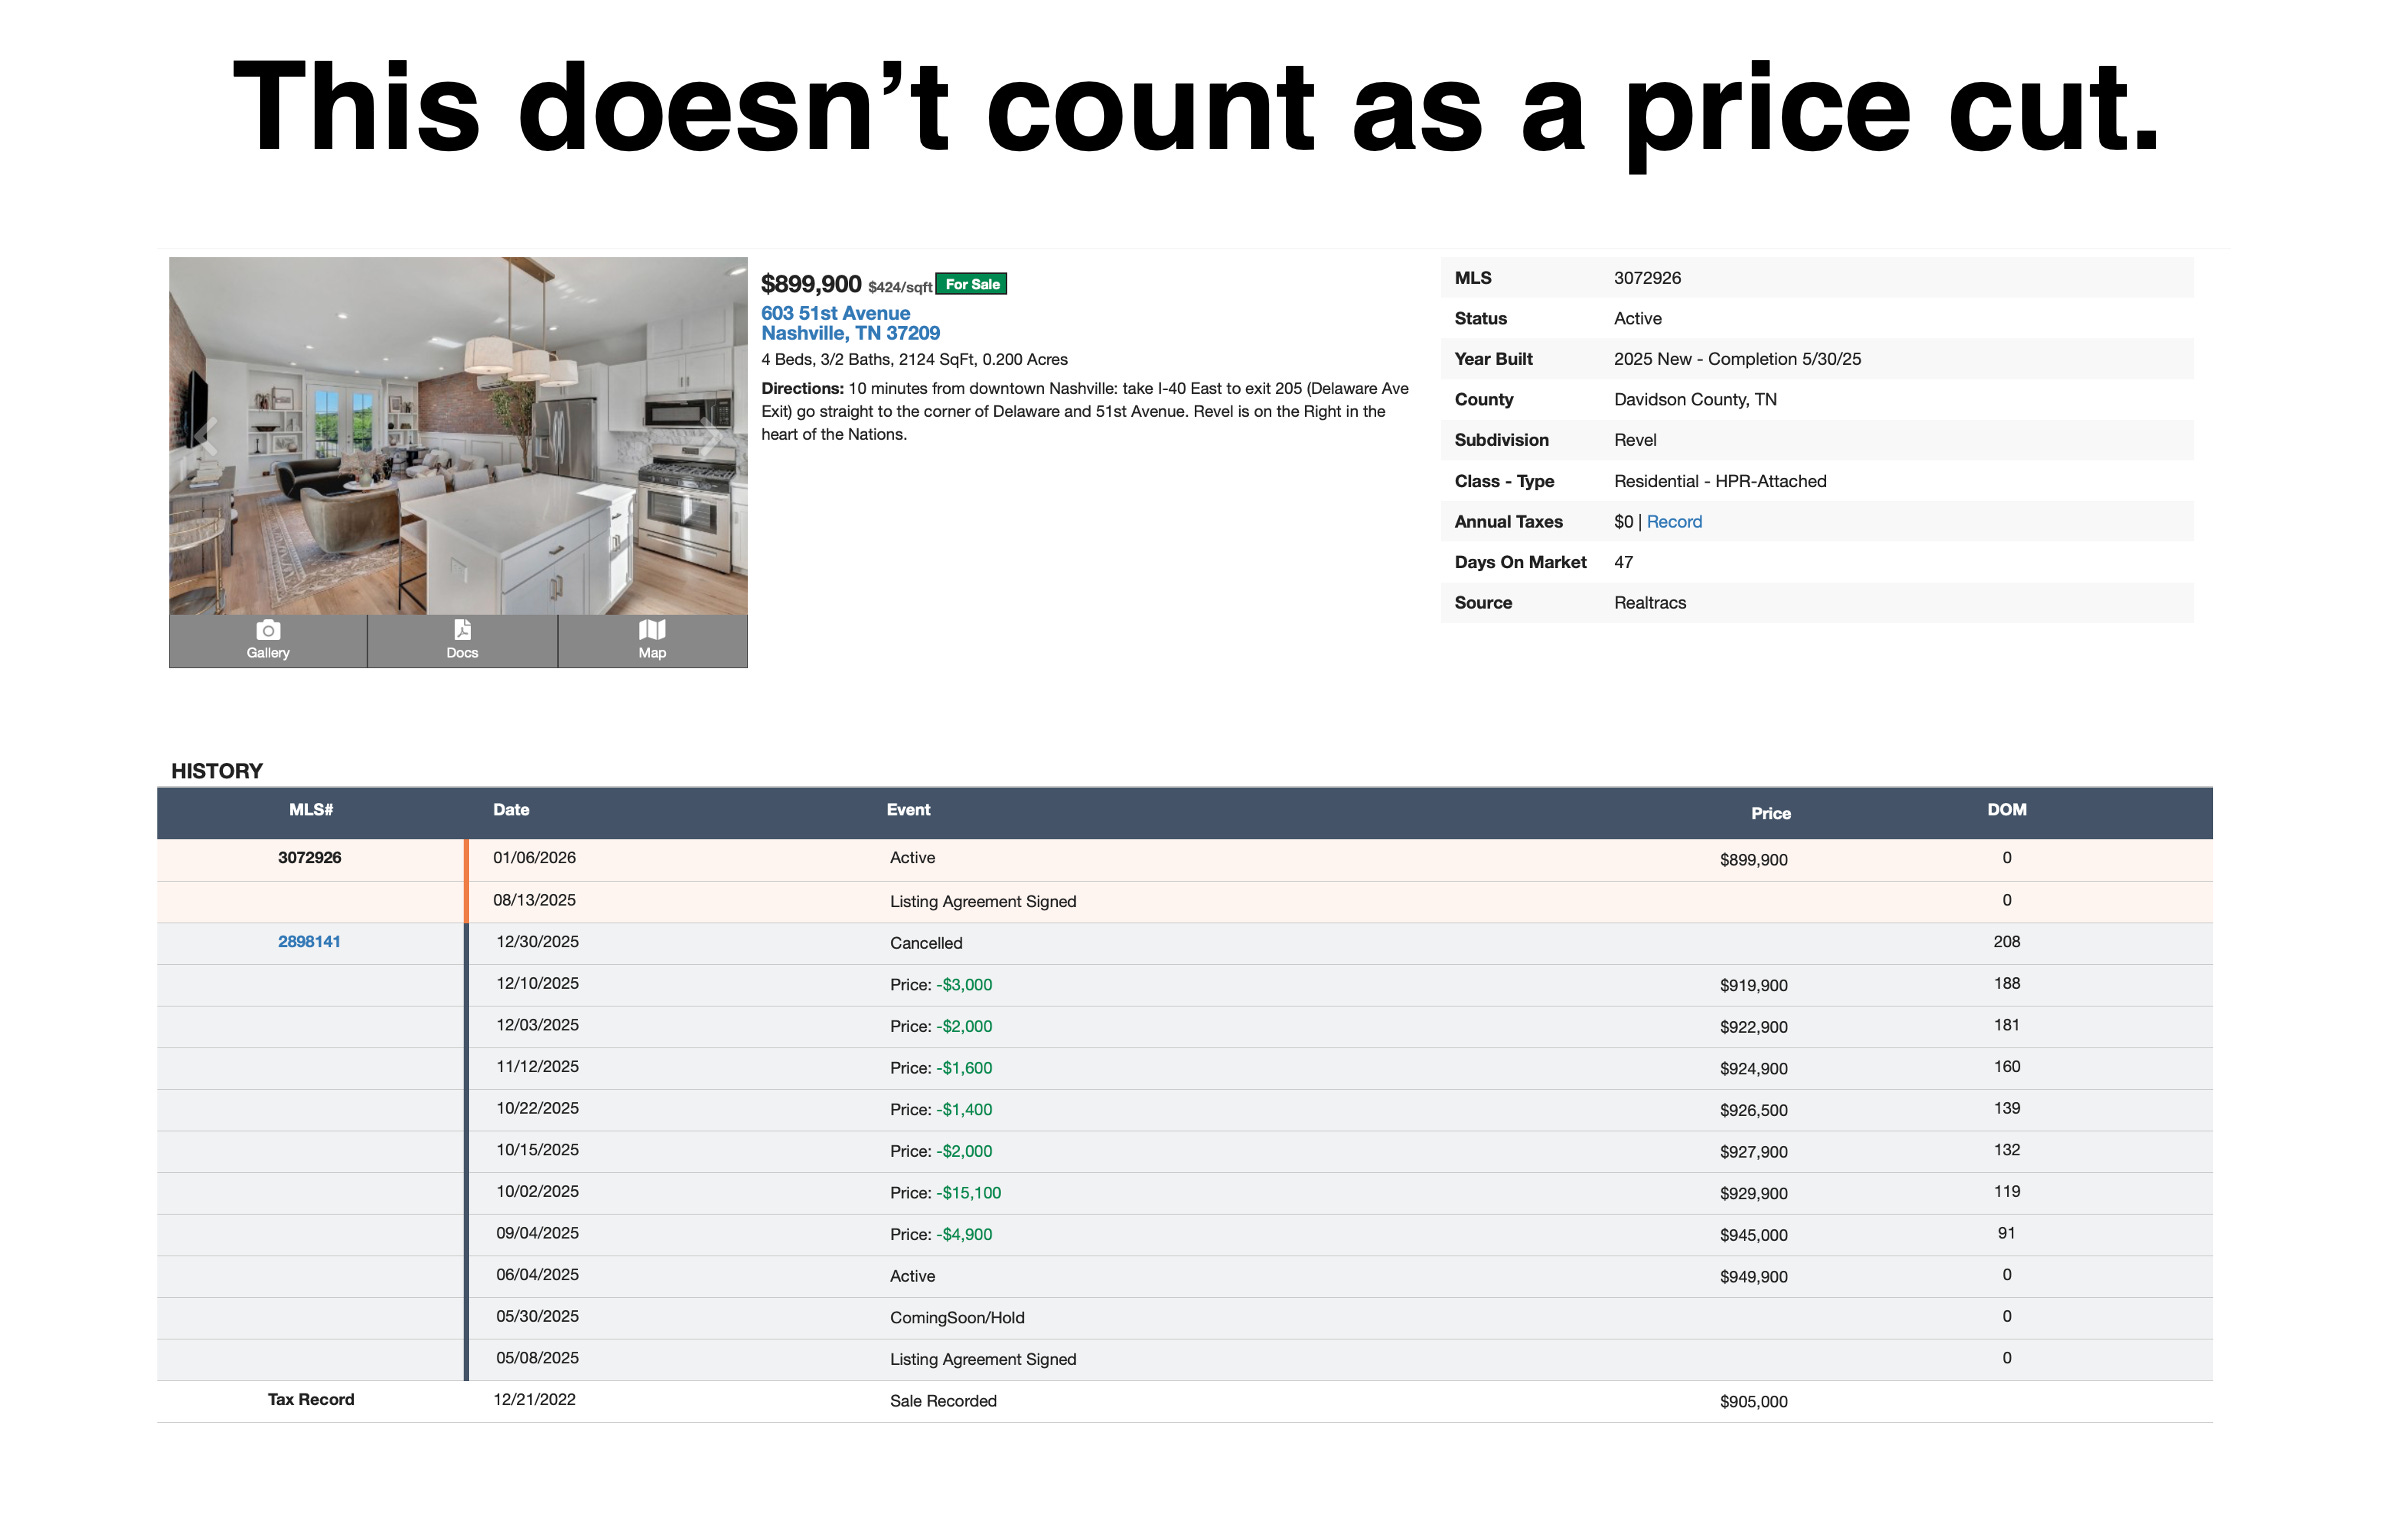
When a seller pulls their listing after months of sitting and re-lists under a new MLS ID at a lower price, that doesn’t register as a price cut. Take 603 51st Avenue, on the market since May 2025, dropped from $950K to $900K across two listings. Invisible in this ratio. How many more are out there like that?
With active listings up 13.5% year-over-year, the real share of sellers reducing prices has to be higher than 32.3%. The question is how much higher?
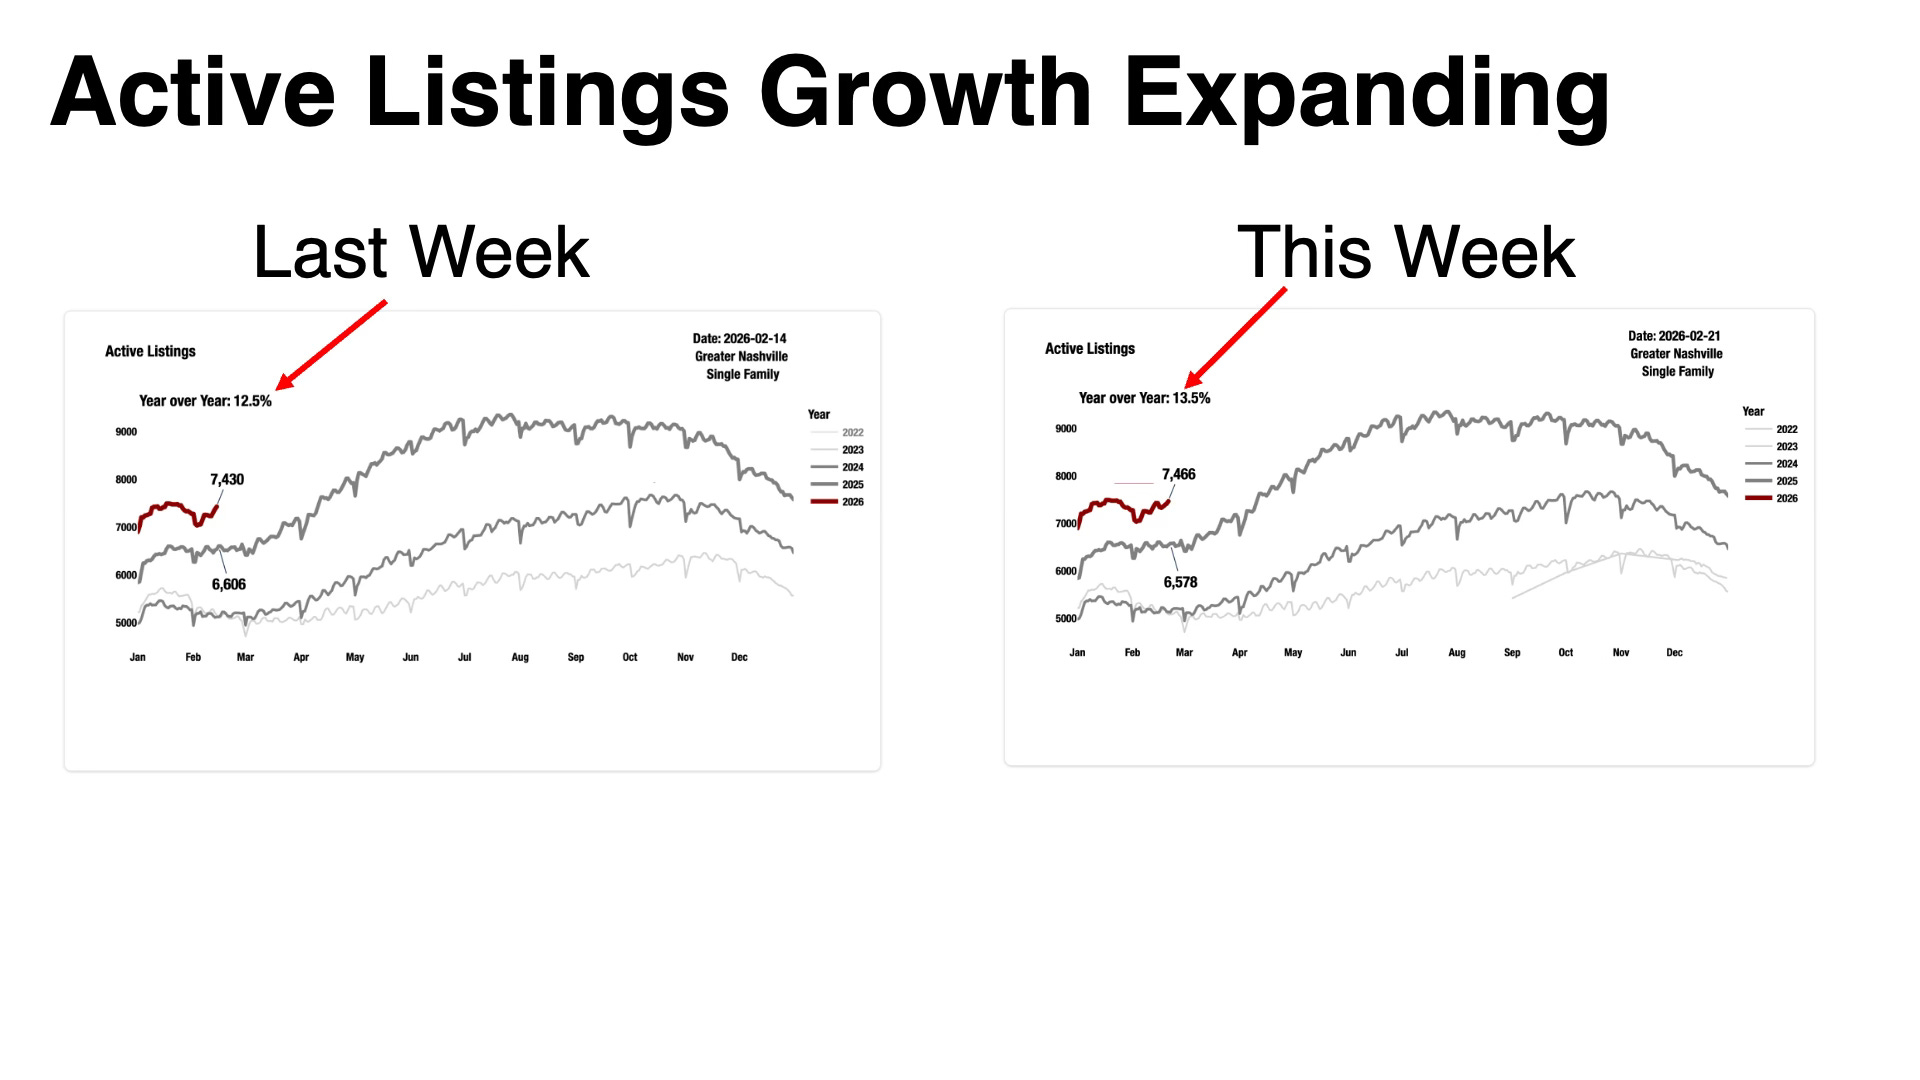
7,466 active single-family listings in Greater Nashville. Up 13.5% from 6,578 at this point last year. Last week that gap was 12.5%.
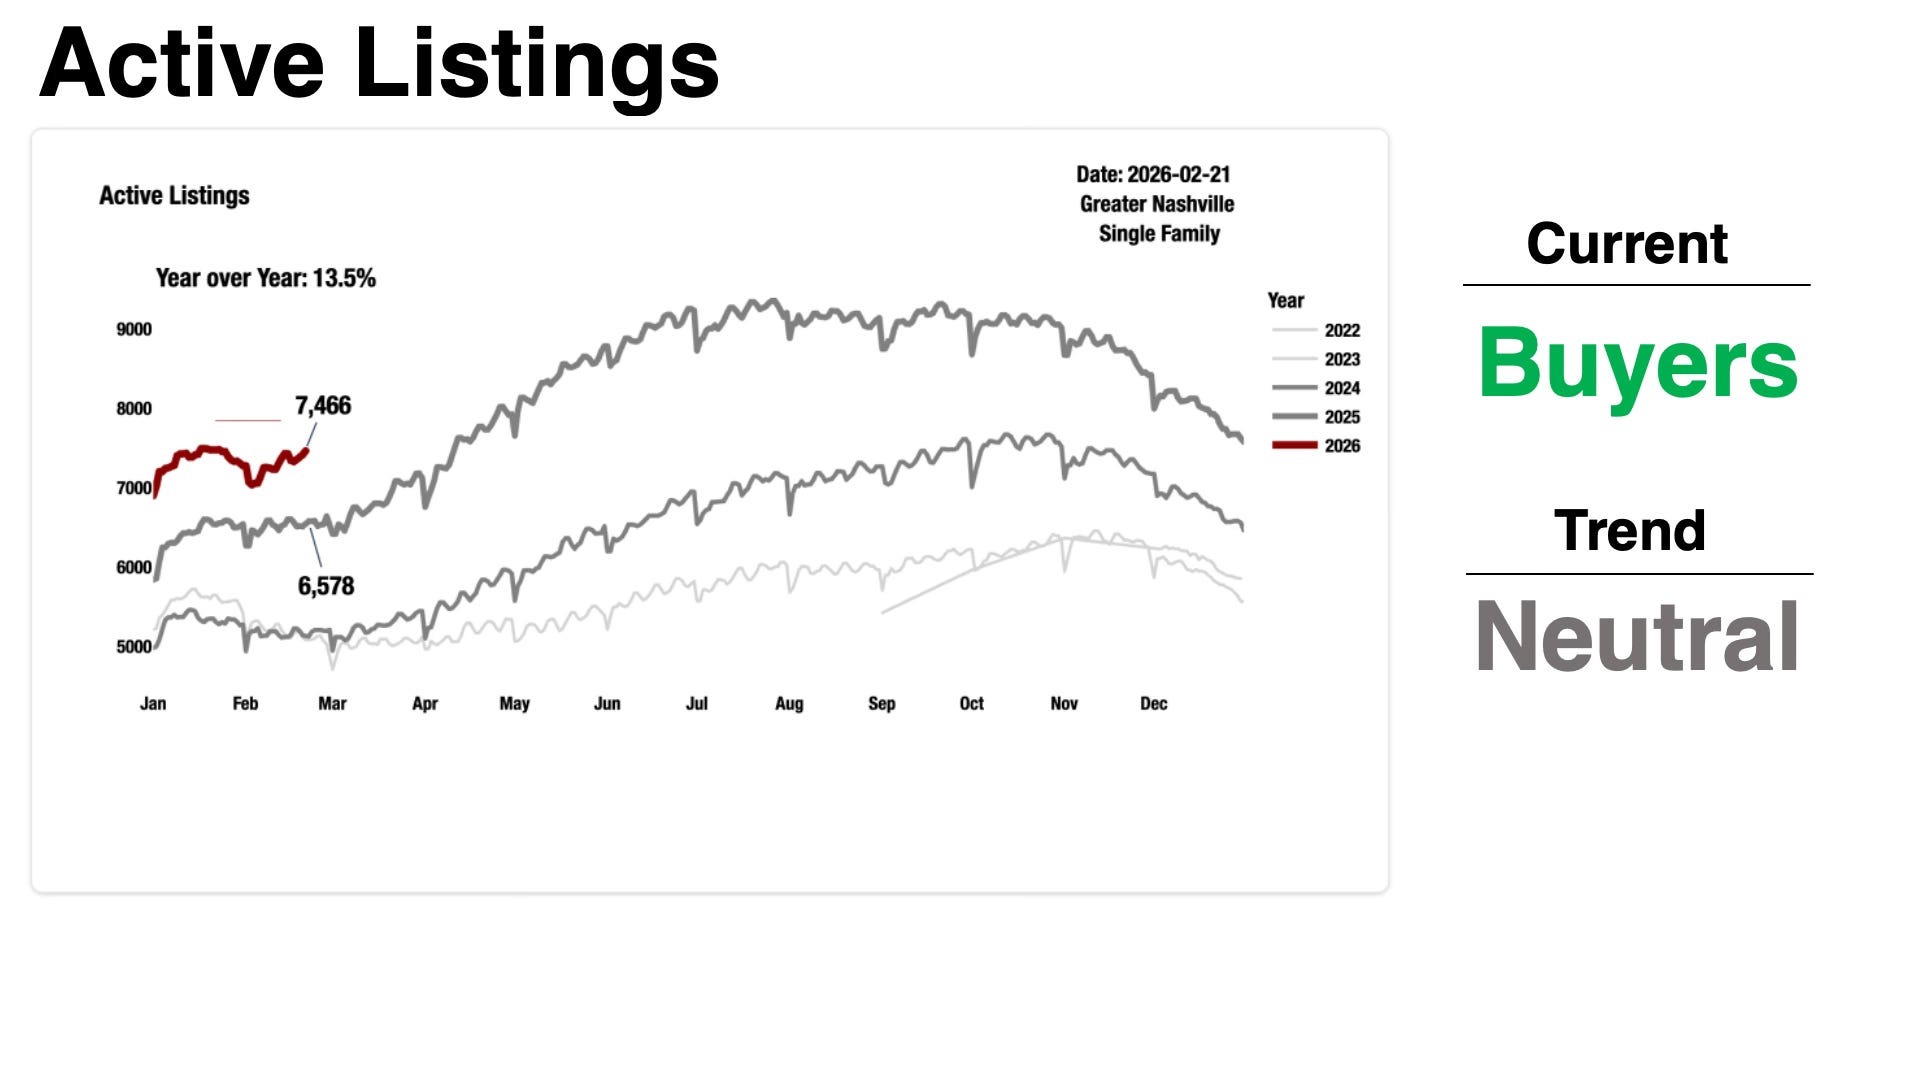
The growth rate isn’t just elevated. The spread between this year and last year got wider, not narrower. Is that going to continue? If 2026 inventory breaks above the January highs before month end, that would be a counter-trend to what we saw in ‘23 and ‘24, and I’d reclassify this from Neutral to a full Buyer trend. We’re not there yet. But we’re getting closer.
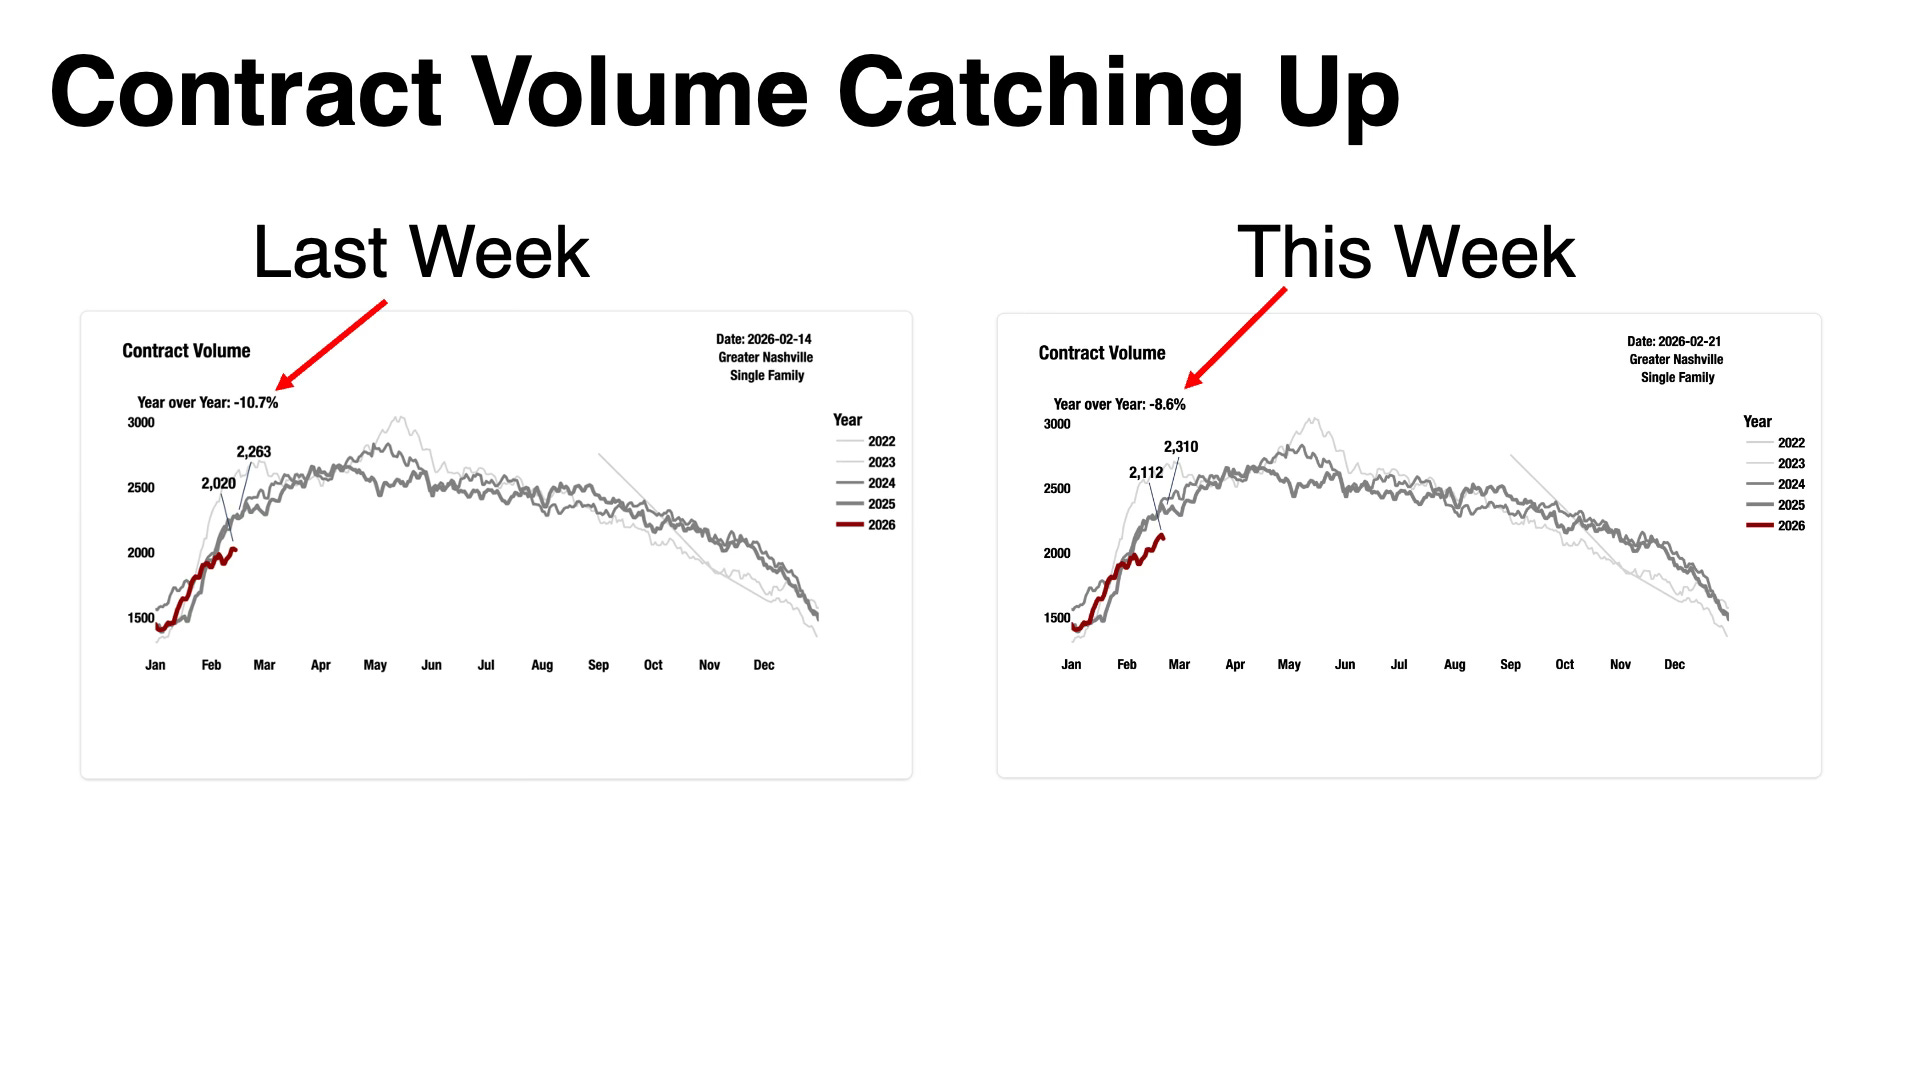
With a monthly pace of 2,112 contracts this week, down 8.6% from last year’s 2,310. Still negative, but it was -10.7% last week. We closed over two percentage points of that gap in seven days.
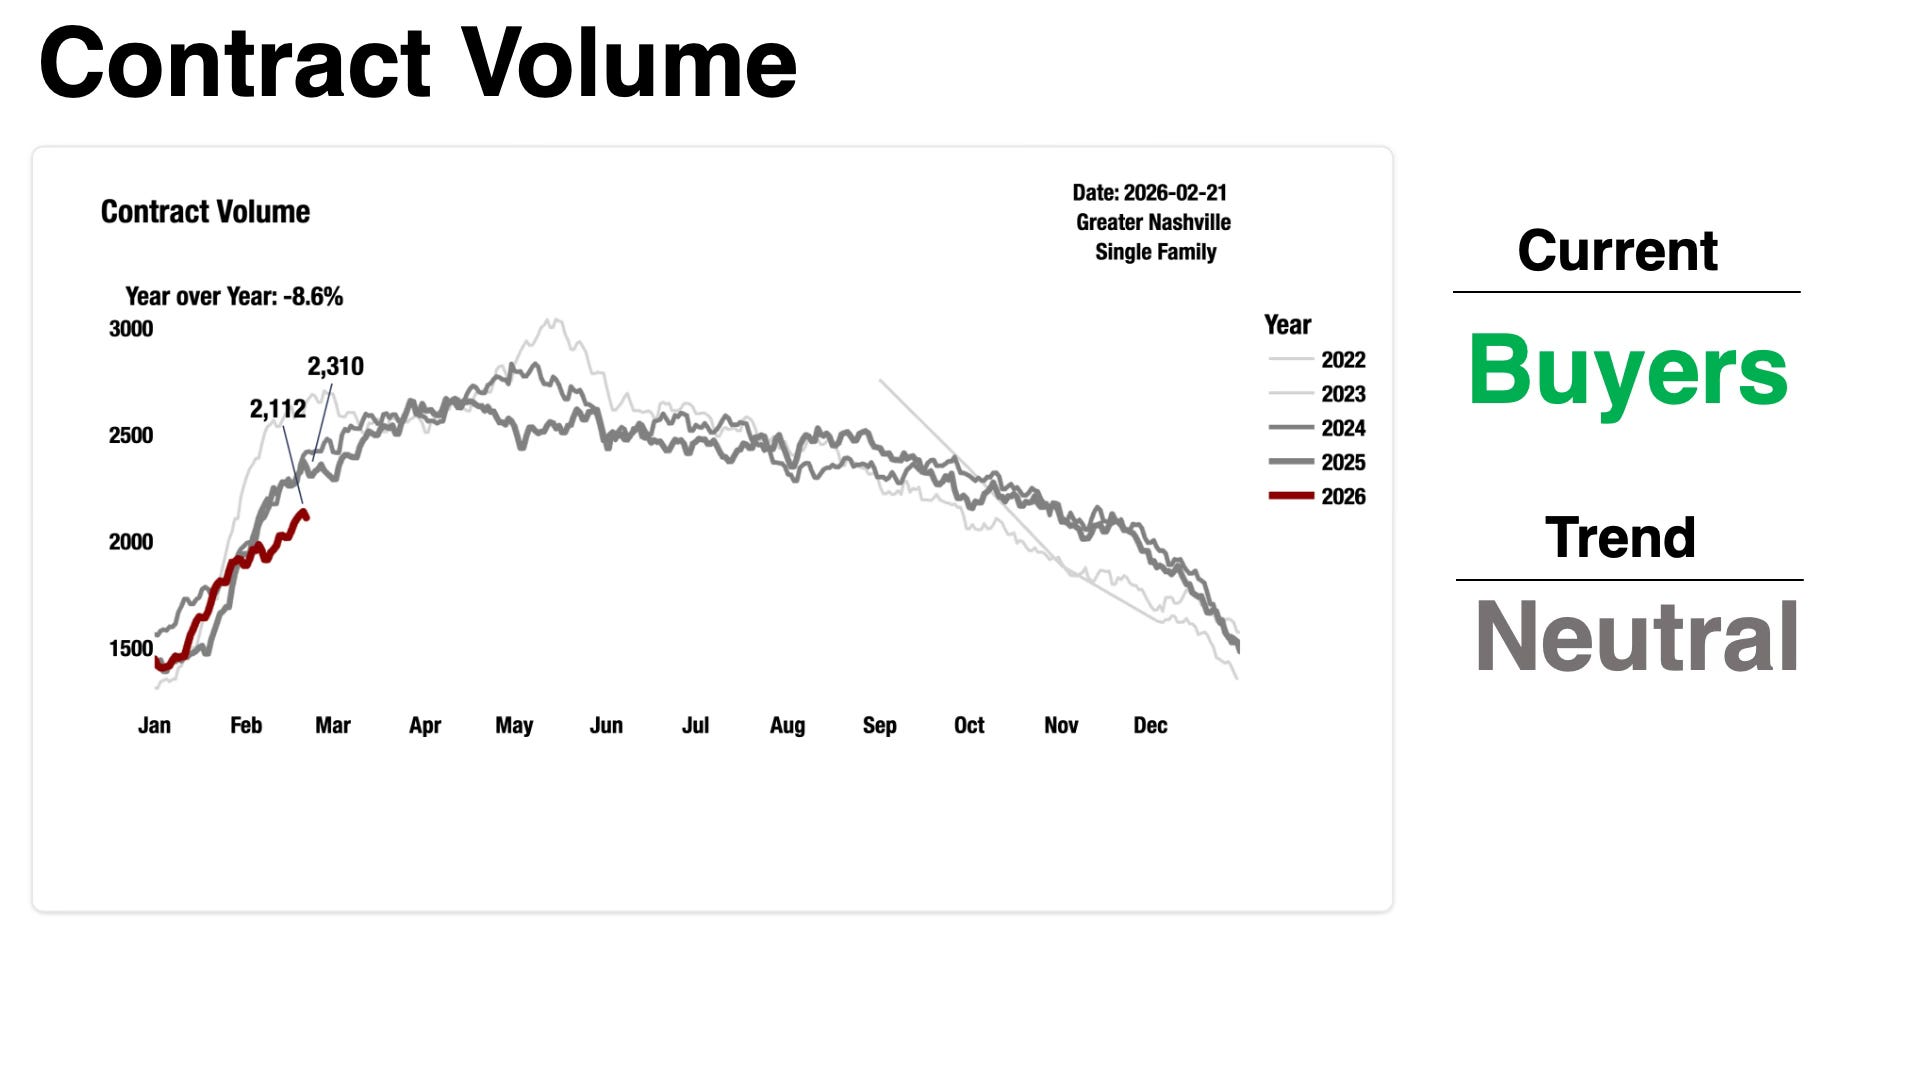
I’ve been talking to a lot of buyers lately. They want to buy. They’re just being very slow and cautious, doing their homework. Is that caution showing up in this number? I think so.
I expect we’ll be under -5% within a week or two. But the bigger question is whether contract volume can actually turn YOY positive? And if so, will active listings keep expanding?