A month ago, the $500K–$1M band — the heart of the move-up market, where families trade up from a starter home — had the strongest contract growth of any price tier in Greater Nashville. Single-family homes going under contract in that range were running +19.5% ahead of a year earlier, led by the $750K–$1M slice at a blistering +36.9%. This week that growth is gone: combined $500K–$1M single-family contracts are −0.8% against last year, and the $750K–$1M slice has rolled all the way over to −4.1%. In four weeks the move-up market went from the hottest tier on the board to the coldest.
What makes it a story and not just noise is where the cooling is — and isn't. Both ends of the market are still growing: entry-level homes under $300K are +13.2%, the $1M–$2M tier is +11.9%, and $2M+ is up an eye-watering +83.8%. The weakness is concentrated in the middle, and it's a forward-looking signal — these are contracts, the homes going under contract this month, which lead closings by weeks.
One caveat up front, because it matters: a single week of negative year-over-year contracts in the $750K–$1M band isn't unprecedented — it printed slightly negative at this same week last year, too. So the signal here isn't the minus sign. It's the speed of the drop, that it's now the market's weakest tier while everything around it grows, and that the soft spot has moved up the price ladder over the last three weeks. Here's the picture.
1. A month ago the move-up market was the hottest tier. Now it's the coldest.
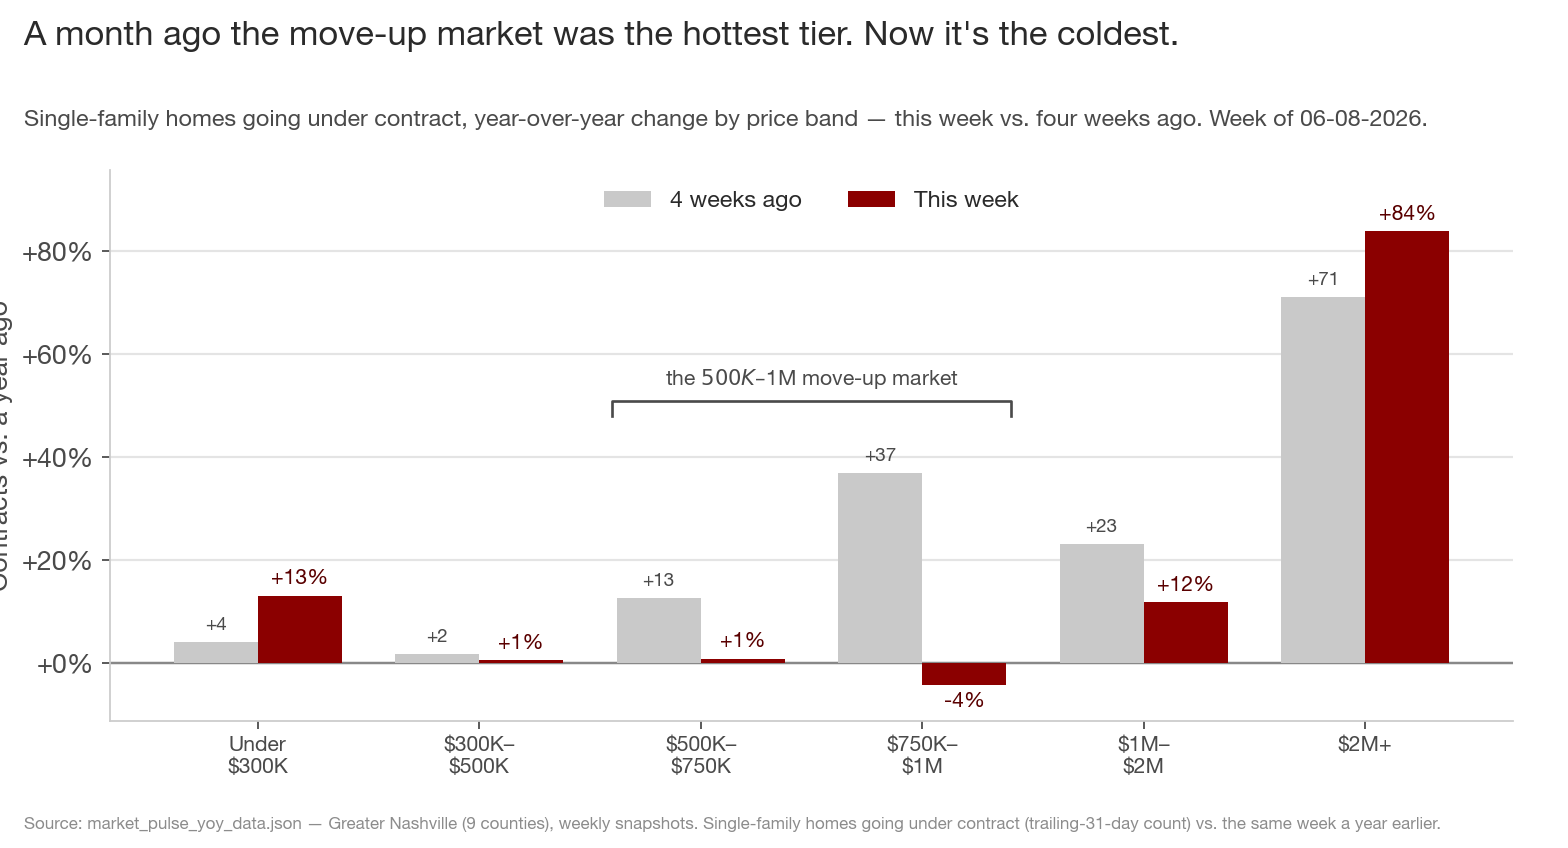
The chart is single-family contract growth — homes going under contract versus the same week a year ago — for each price band, with the reading from four weeks ago (grey) next to this week's (maroon). The shape is a barbell, and it's the middle that gave way. The $750K–$1M band fell from +37% to −4%; $500K–$750K from +13% to +1%. Together, the $500K–$1M move-up market swung from +19.5% to −0.8% — roughly a twenty-point drop in a month, the sharpest deceleration of any tier.
The two ends held or accelerated. Under $300K is +13%, up from +4% a month ago; $1M–$2M is still +12%; and $2M+ is +84%, the one tier that just keeps climbing. Buyers at the bottom and the very top are still showing up in force. It's the move-up buyer — the family stretching from a $400K starter into a $700K or $800K house — who just went quiet. (The all-property numbers say the same thing: combined $500K–$1M contracts went from +19.6% to −1.5%, so this isn't a single-family quirk.)
2. The soft spot climbed the ladder
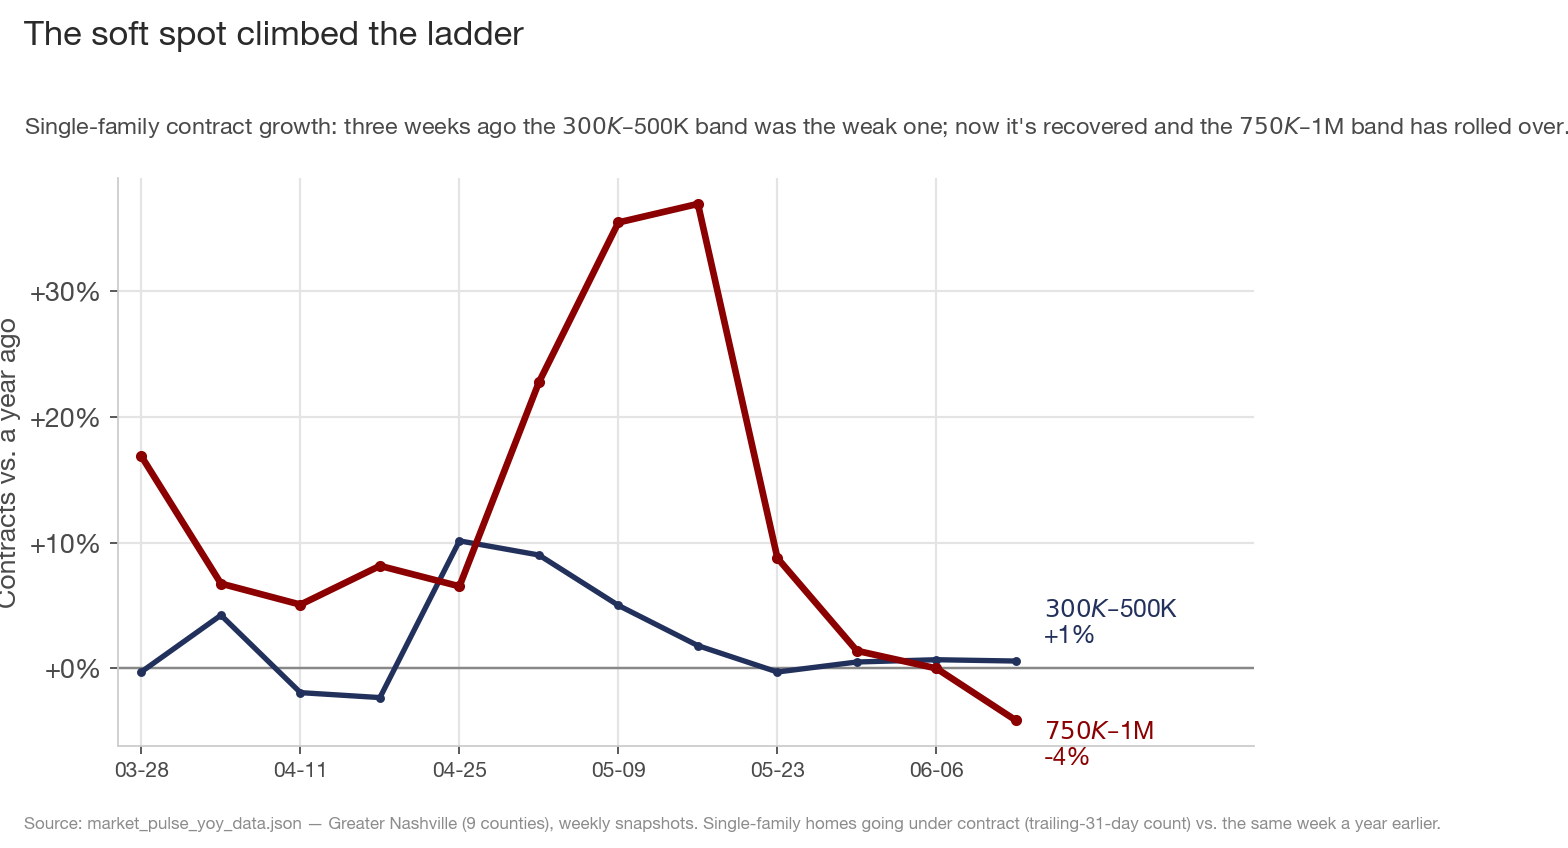
This is the part worth watching. Three weeks ago, when I wrote about the "missing middle," the soft spot in the market was the $300K–$500K band — it was the only one of the six in year-over-year decline, at −0.3% the week of May 23. It has since recovered to +0.6%. The weakness didn't disappear; it moved up. The $750K–$1M band, which was a healthy +9% that same week, has since fallen to −4.1% — and somewhere in late May the two lines crossed. The band that was strong is now the weak one, and the band that was weak has steadied.
That's why "the slowdown climbed the ladder" is the right way to read this. A month ago the marginal hesitation was at the $300K–$500K rung; today it's one full step up, at $750K–$1M. If the pattern holds, the question is whether it keeps climbing — into the $1M–$2M tier, which is still positive at +12% but has itself decelerated from +37% in early May.
3. $750K–$1M demand has slipped under last year's line
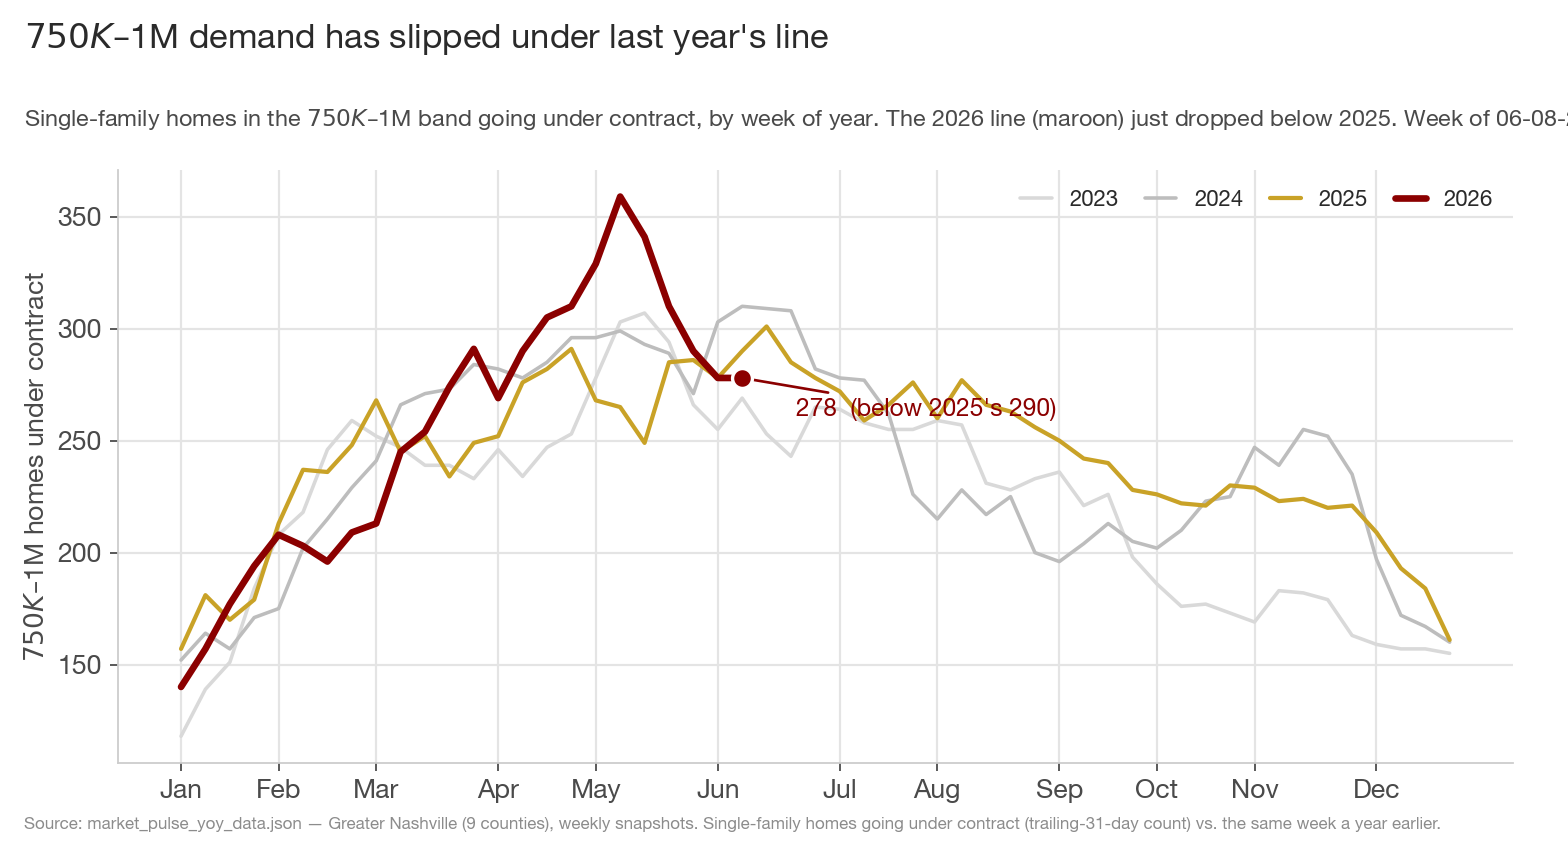
Here's the $750K–$1M band in levels — single-family homes under contract, each year overlaid by calendar week. The 2026 line (maroon) ran above every prior year through early May, peaking around 360, and has since fallen to 278, slipping below the 2025 line (290) this week. The spring surge that made this the hottest tier is over, and the band is now running behind last year's pace.
Be honest about what this chart does and doesn't show. The 2026 line dipping below 2025 in early June is real, but you can see all four years sag through this stretch — late-spring choppiness is normal here, and 2025 itself sat below 2024 at this same week. So I'm not calling a single crossing a regime change. The meaningful part is the trajectory: a five-week slide from +94 contracts ahead of last year to a dozen behind, with no sign yet of a floor.
What this adds up to
- The move-up market cooled hard and fast. Single-family $500K–$1M contracts went from +19.5% year-over-year four weeks ago to −0.8% now — the sharpest swing of any tier, led by $750K–$1M's drop from +37% to −4%.
- It's a barbell. Both ends are still growing — under $300K +13%, $1M–$2M +12%, $2M+ +84%. The hesitation is specifically the move-up buyer.
- The soft spot climbed the ladder. The weakest band was $300K–$500K three weeks ago; it's recovered, and $750K–$1M is now the weak one.
- It's forward-looking but not yet a regime change. Contracts lead closings, so this points to a softer summer in the move-up segment — but a single sub-2025 week in this band isn't unprecedented, so it's the speed and the breadth that matter, not the minus sign.
For move-up sellers — anyone listing a $600K–$900K house hoping to trade up — this is the early warning: the pool of buyers for your price point thinned out over the last month, even as the listings around you kept coming. Price to the new reality, not to April's. For move-up buyers, the leverage just shifted your way in exactly this band; a month ago you were competing into +37% demand, now you're not. For builders and agents working the $700K–$900K product, watch your pending counts weekly — that's where this shows up first.
Here's the falsifiable part to watch over the next 30–60 days. If this is a real, climbing slowdown rather than seasonal chop, two things should follow: $500K–$1M contracts stay negative through the summer rather than snapping back, and the cooling keeps climbing into the $1M–$2M tier — that band is still +12% but has decelerated from +37%, so it's the next rung. If instead the $750K–$1M line bounces back above last year within a few weeks, this was a seasonal air pocket and I'll say so. Either way, the tell is the same chart in Section 2: watch whether the weak rung keeps moving up the ladder, or slides back down.
Data through the week ending June 8, 2026, Greater Nashville (9 counties: Davidson, Williamson, Rutherford, Wilson, Sumner, Maury, Dickson, Cheatham, Robertson). Figures are single-family homes going under contract — a trailing-31-day count of new pendings — compared to the same week of the prior year, by list-price band; "the move-up market" refers to the $500K–$1M range. The upper bands carry smaller weekly counts, so single-week readings are noisier than the broad bands; the trajectory matters more than any one week. The all-property picture mirrors the single-family one. Source: market_pulse_yoy_data.json.