Originally published on Substack
Happy Wednesday,
GNR should be releasing their data points soon and this is what I expect them to post for Single Family Homes:
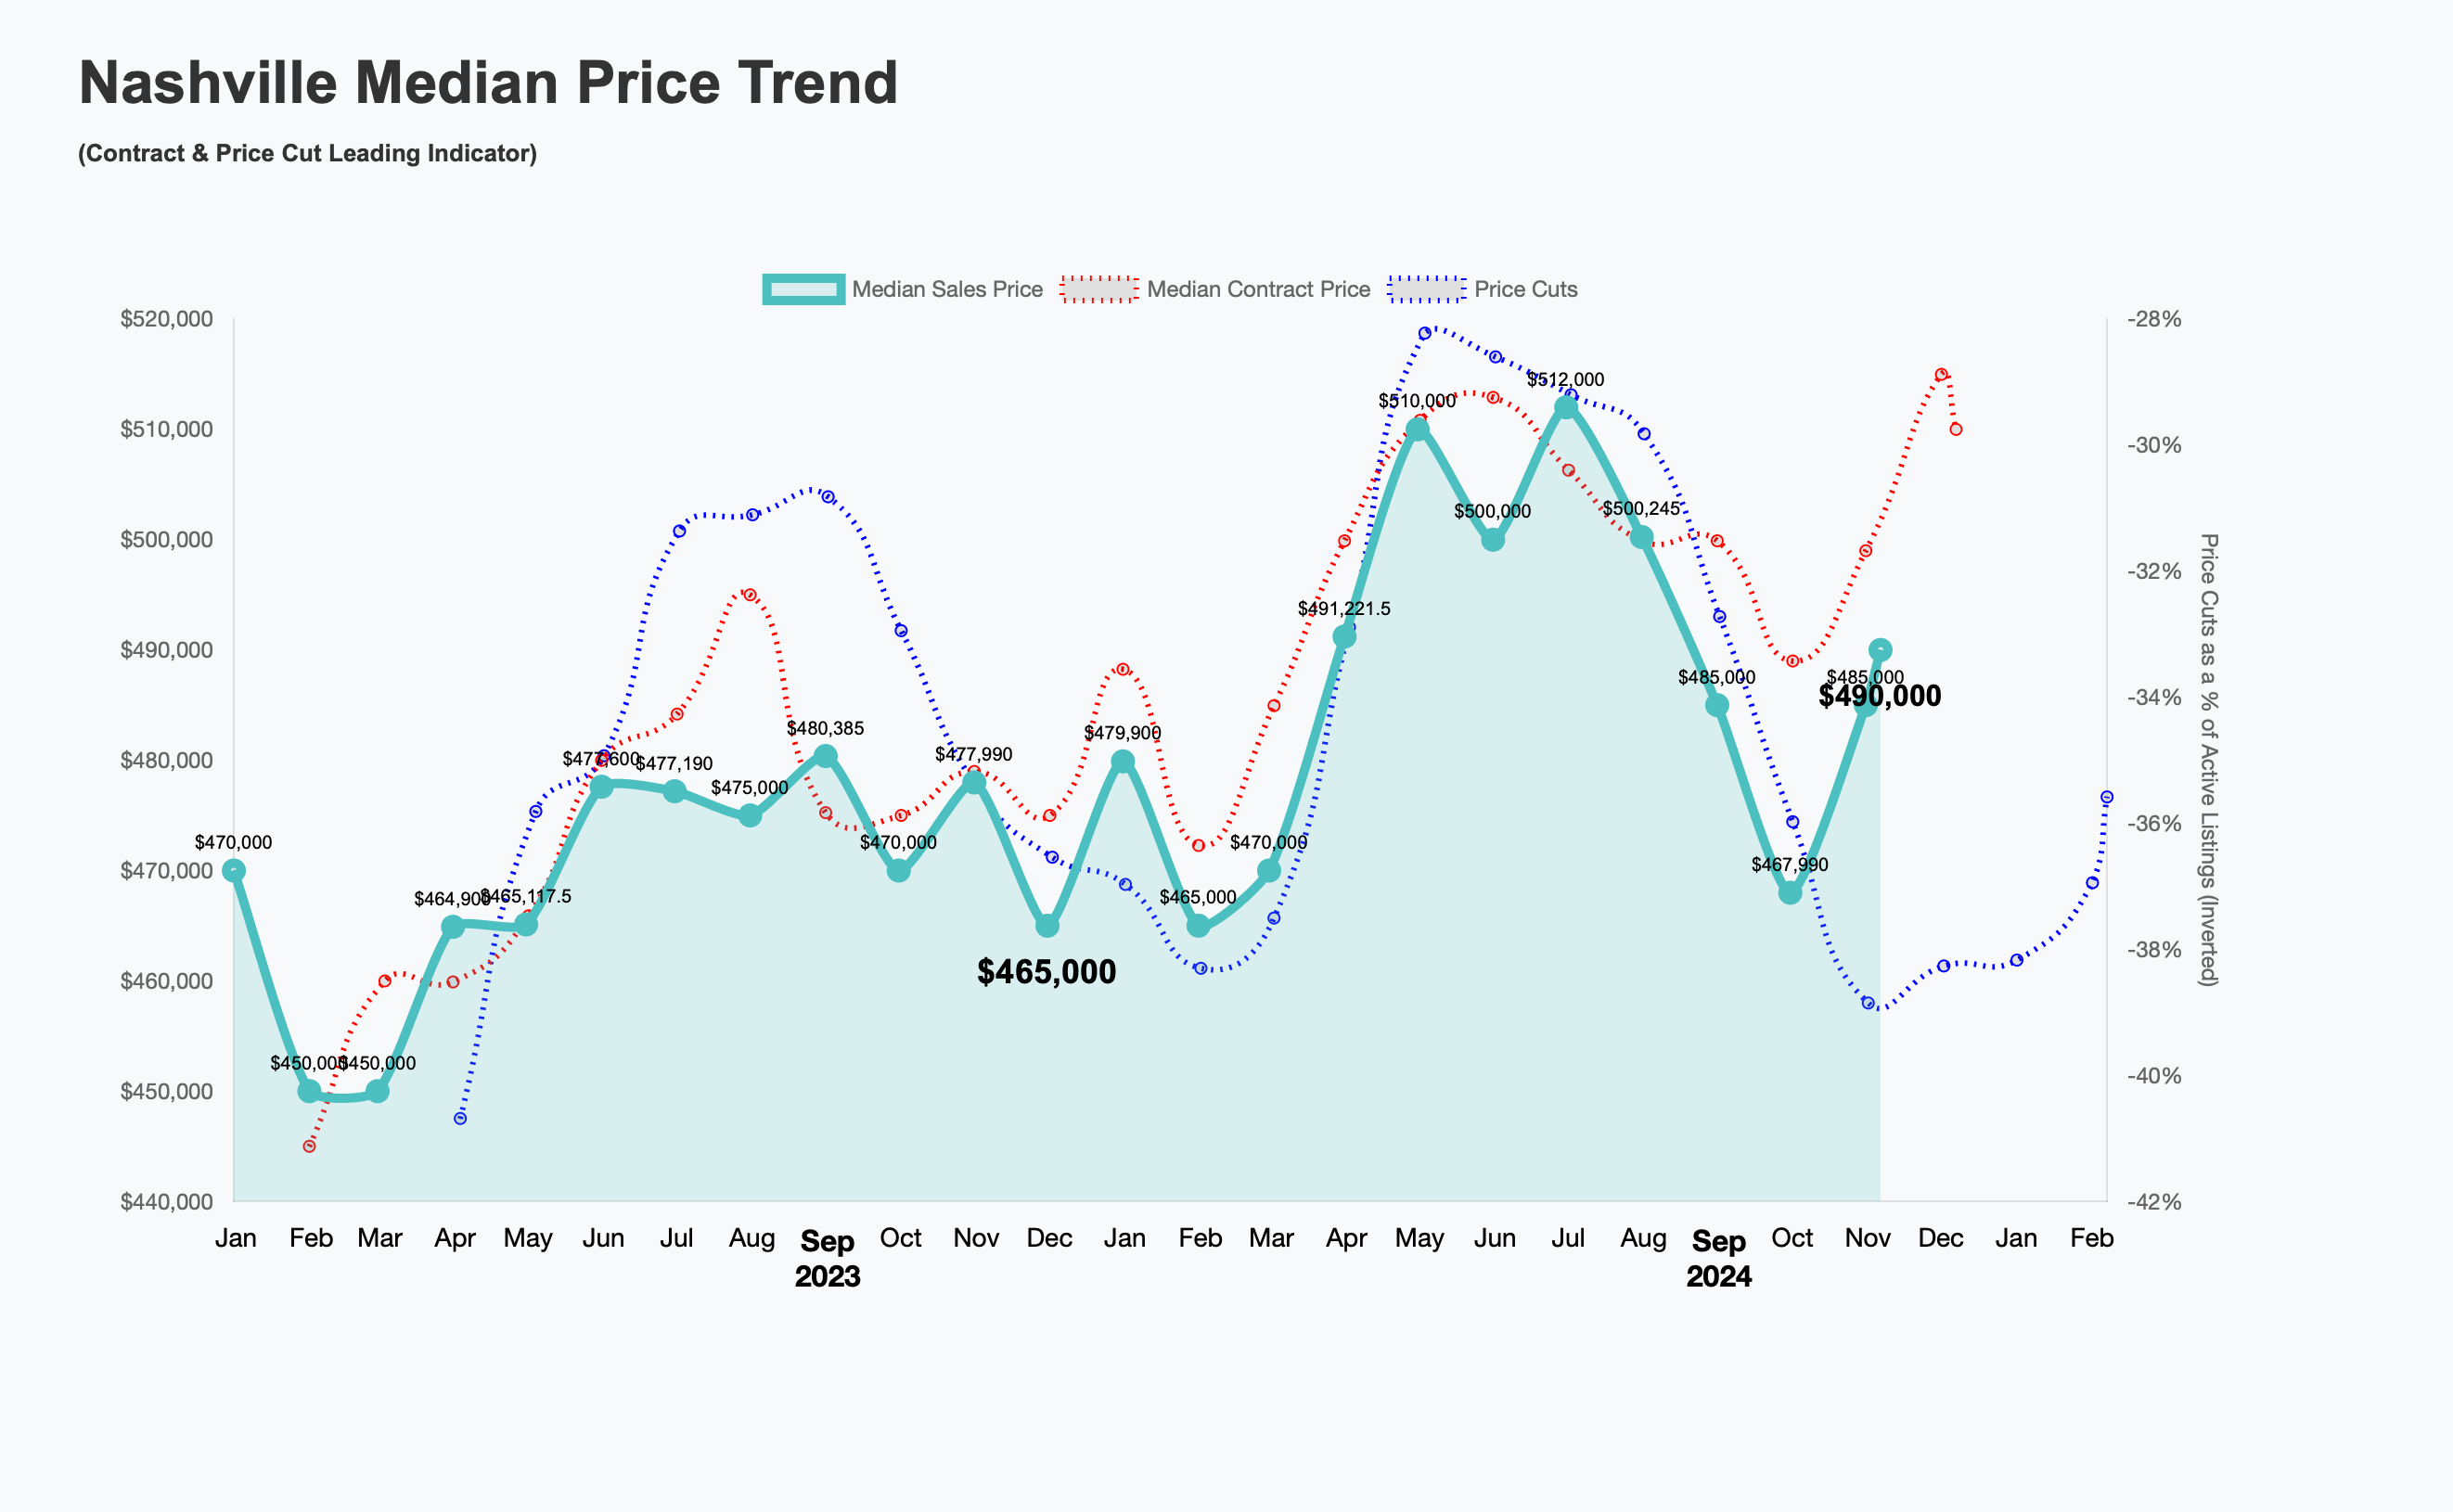
Talk about whiplash! The Median Price for a Single Family Home in October rose more than expected, now at $490K, up a whopping ~$23K from last month’s low of $467K. Why so choppy and what does it mean?
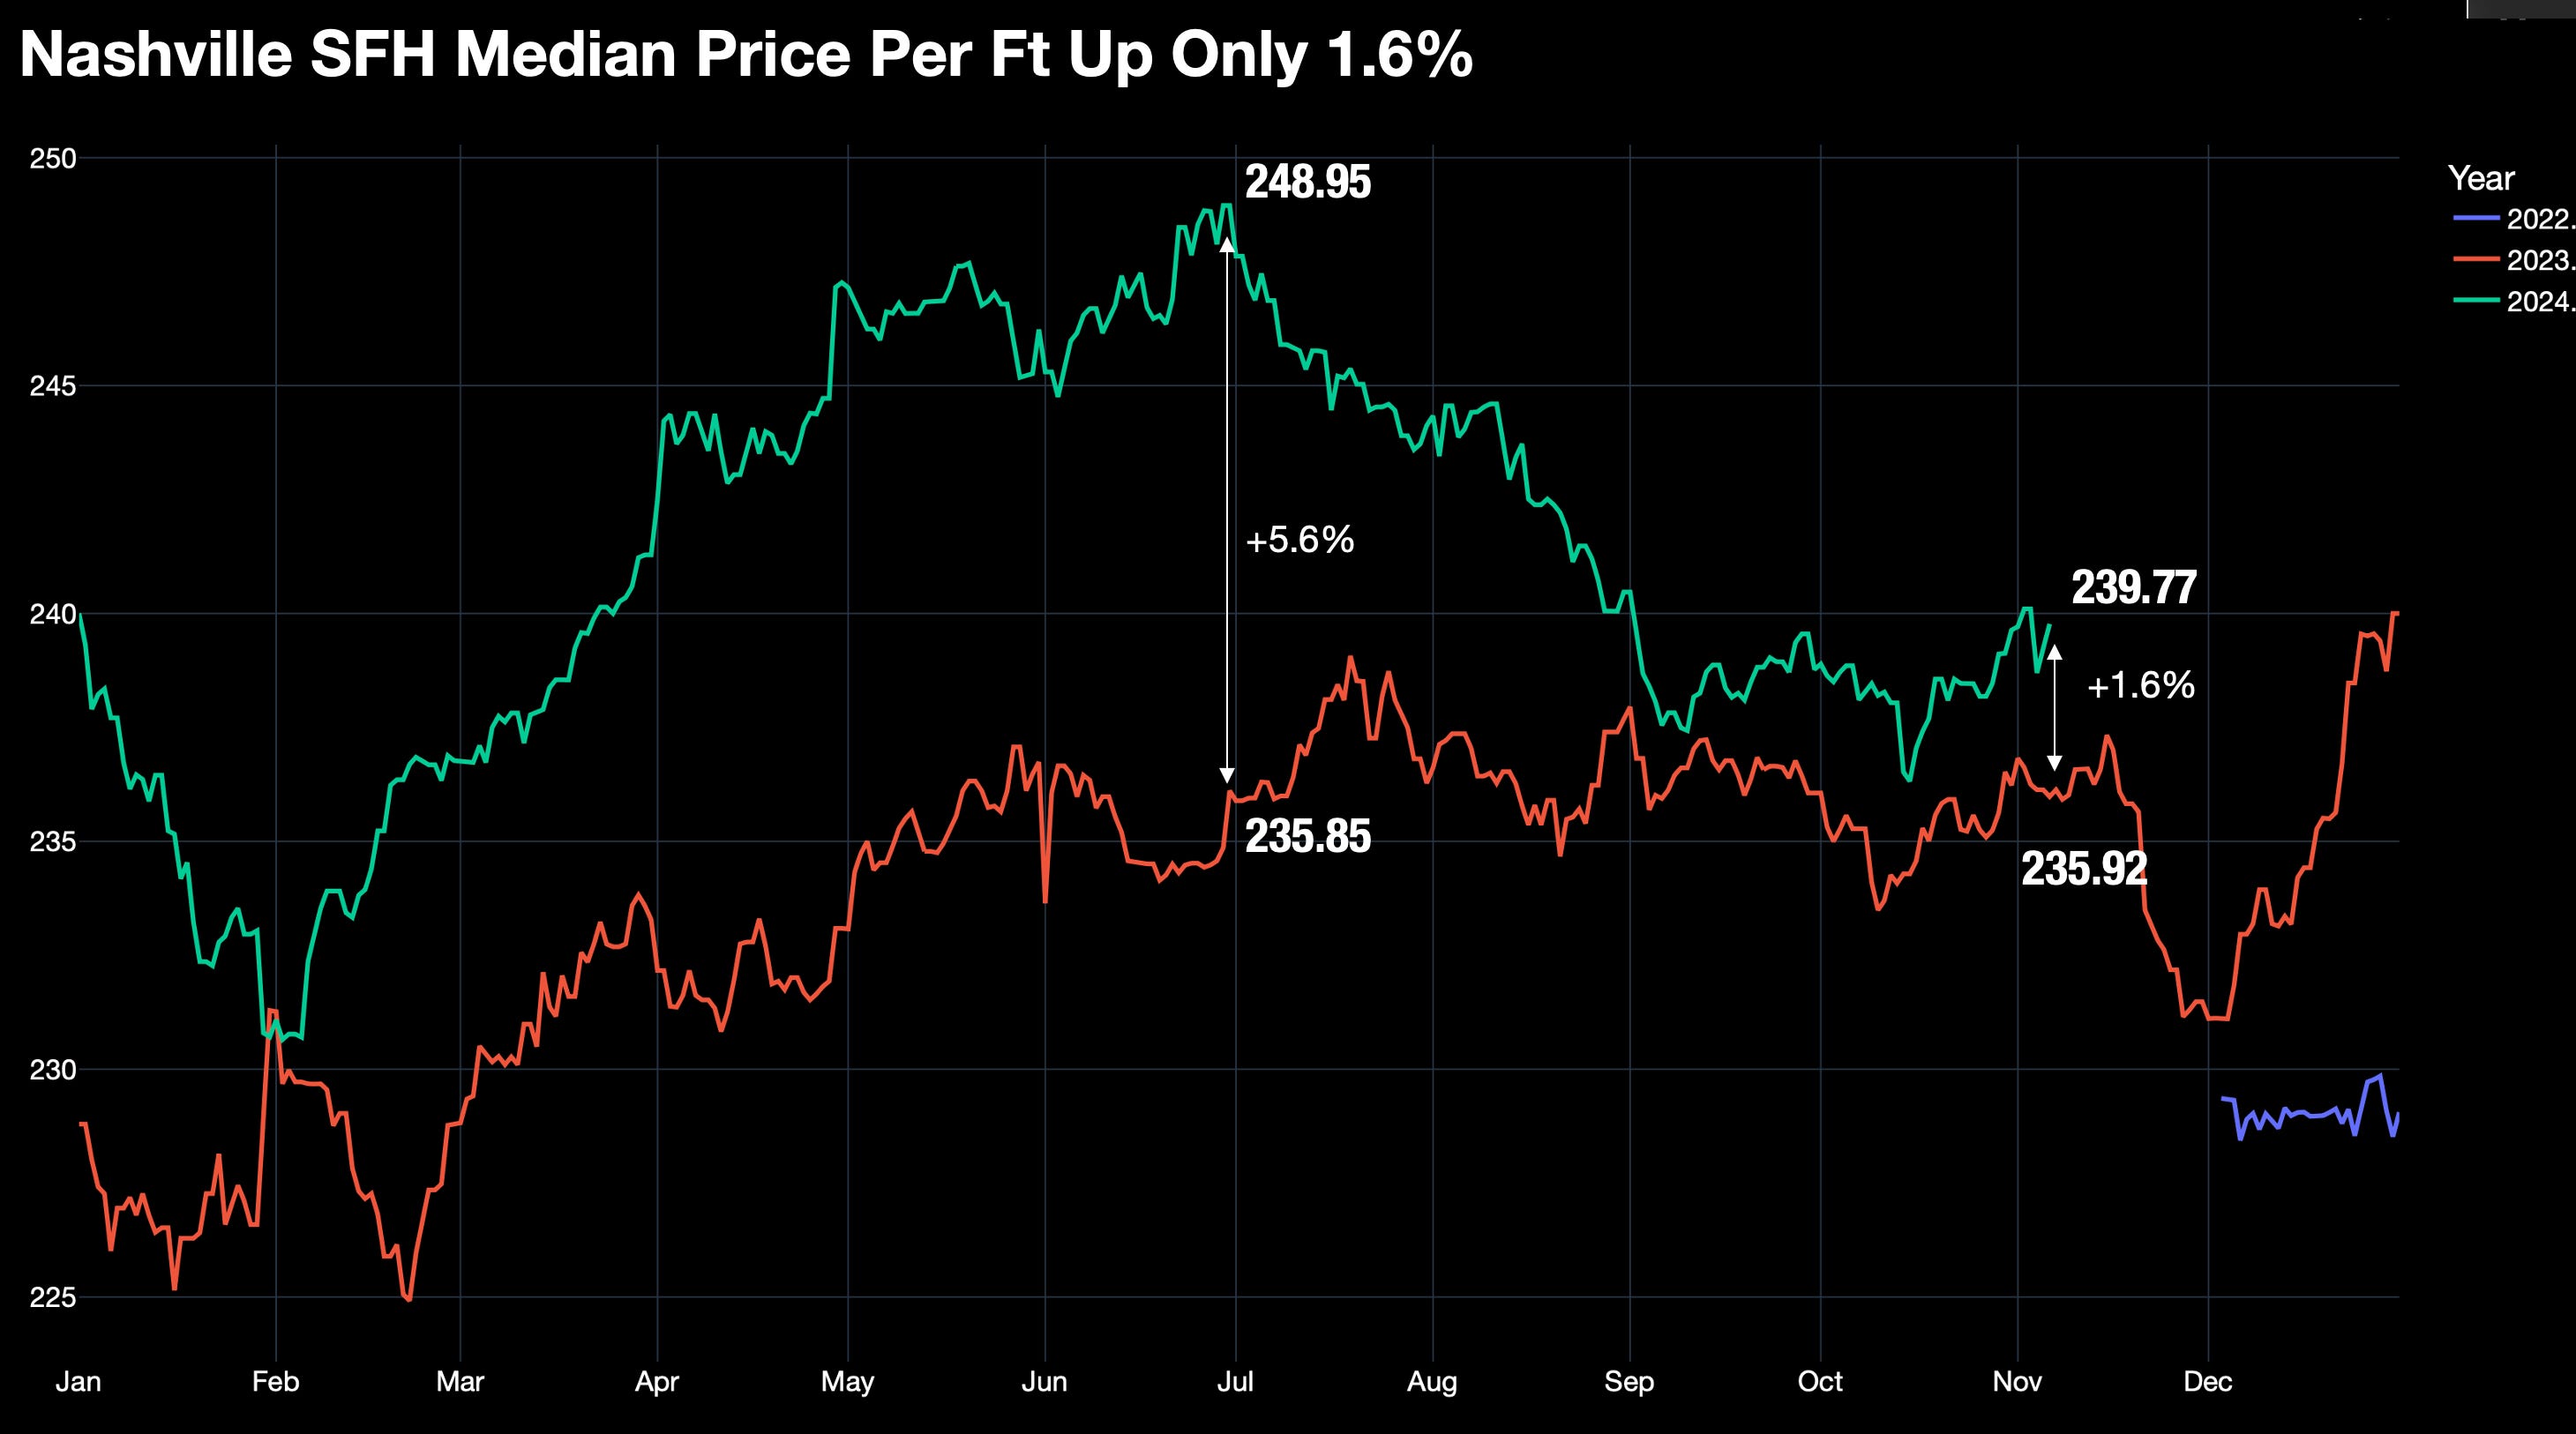
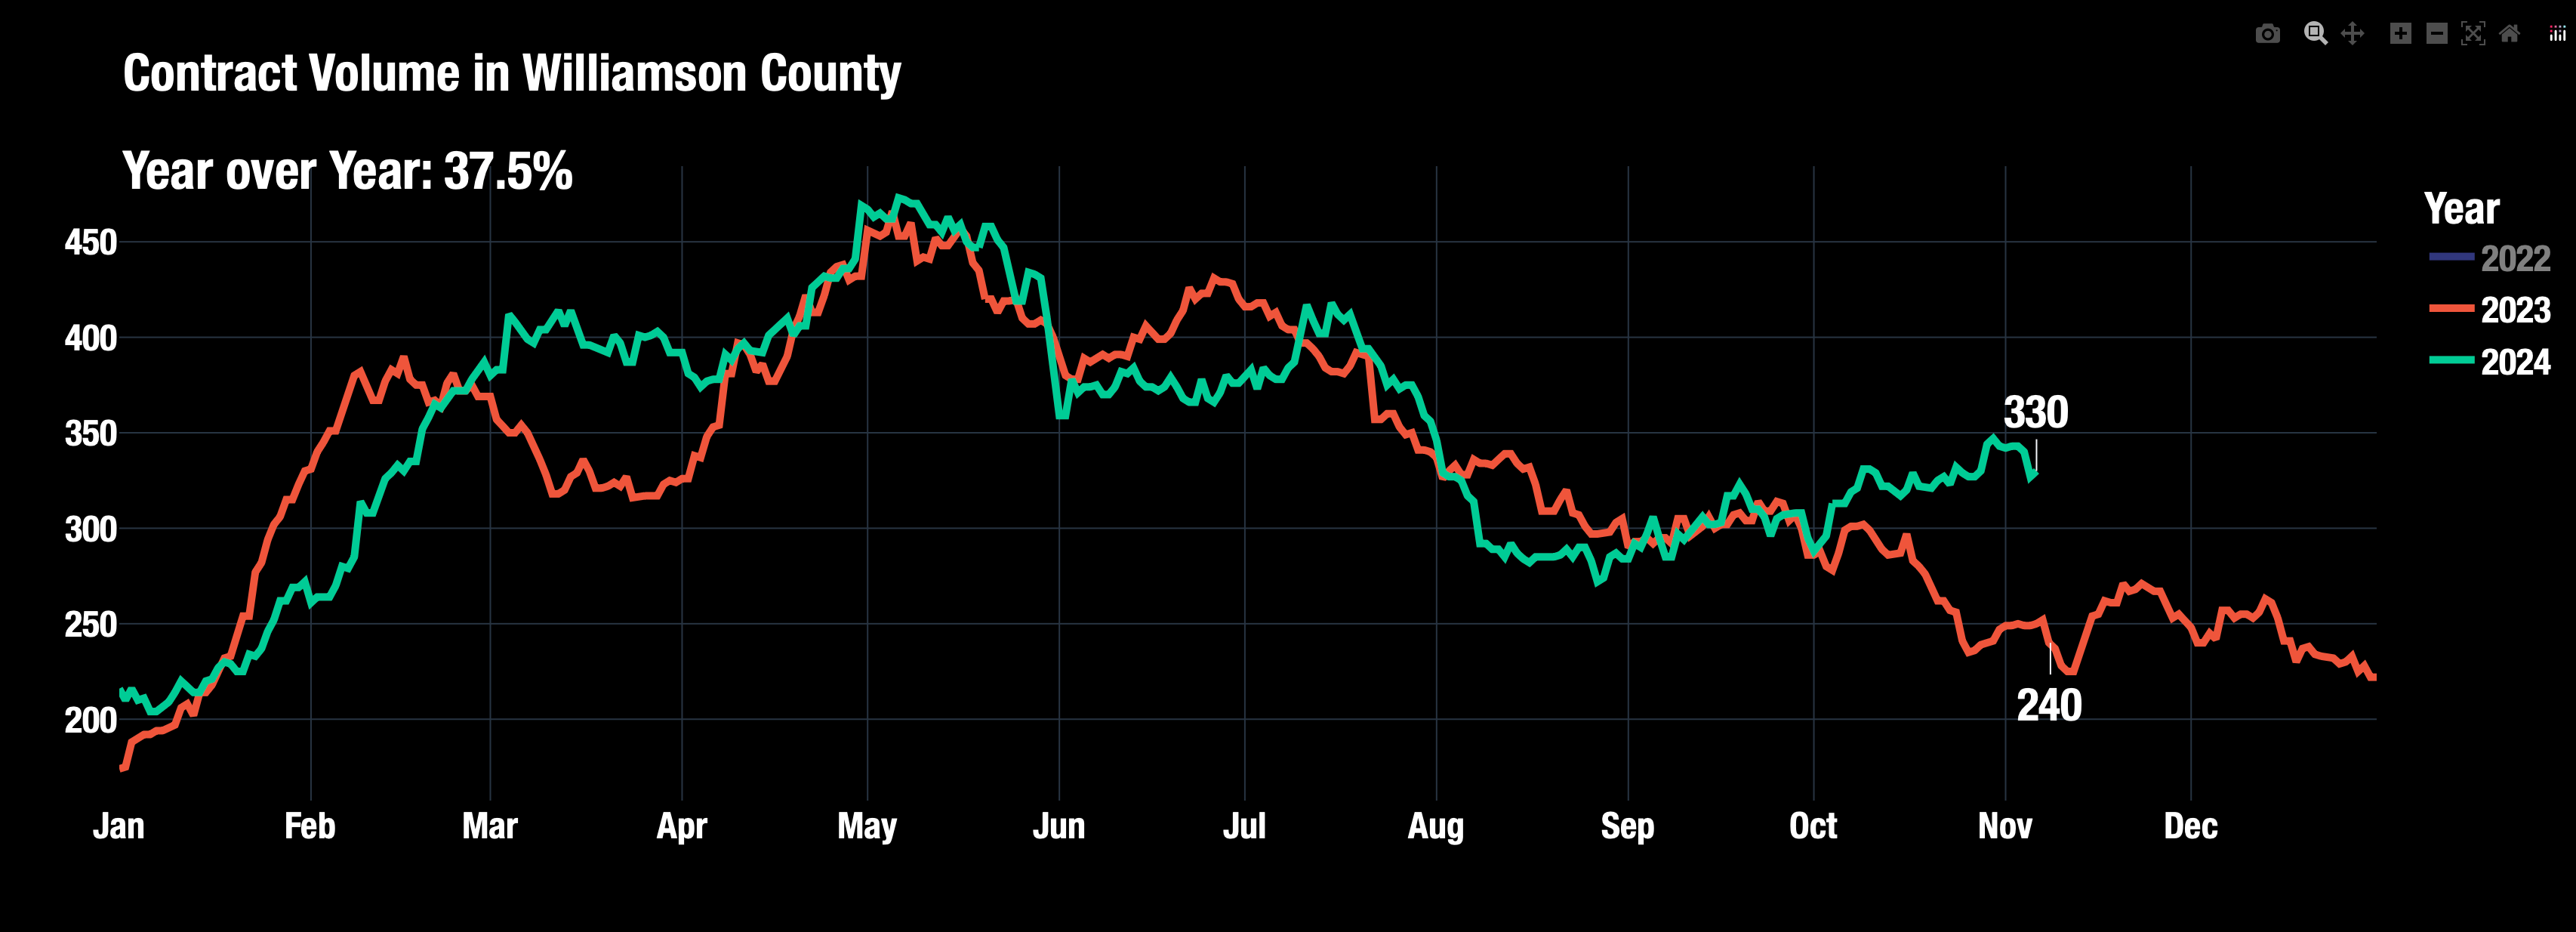
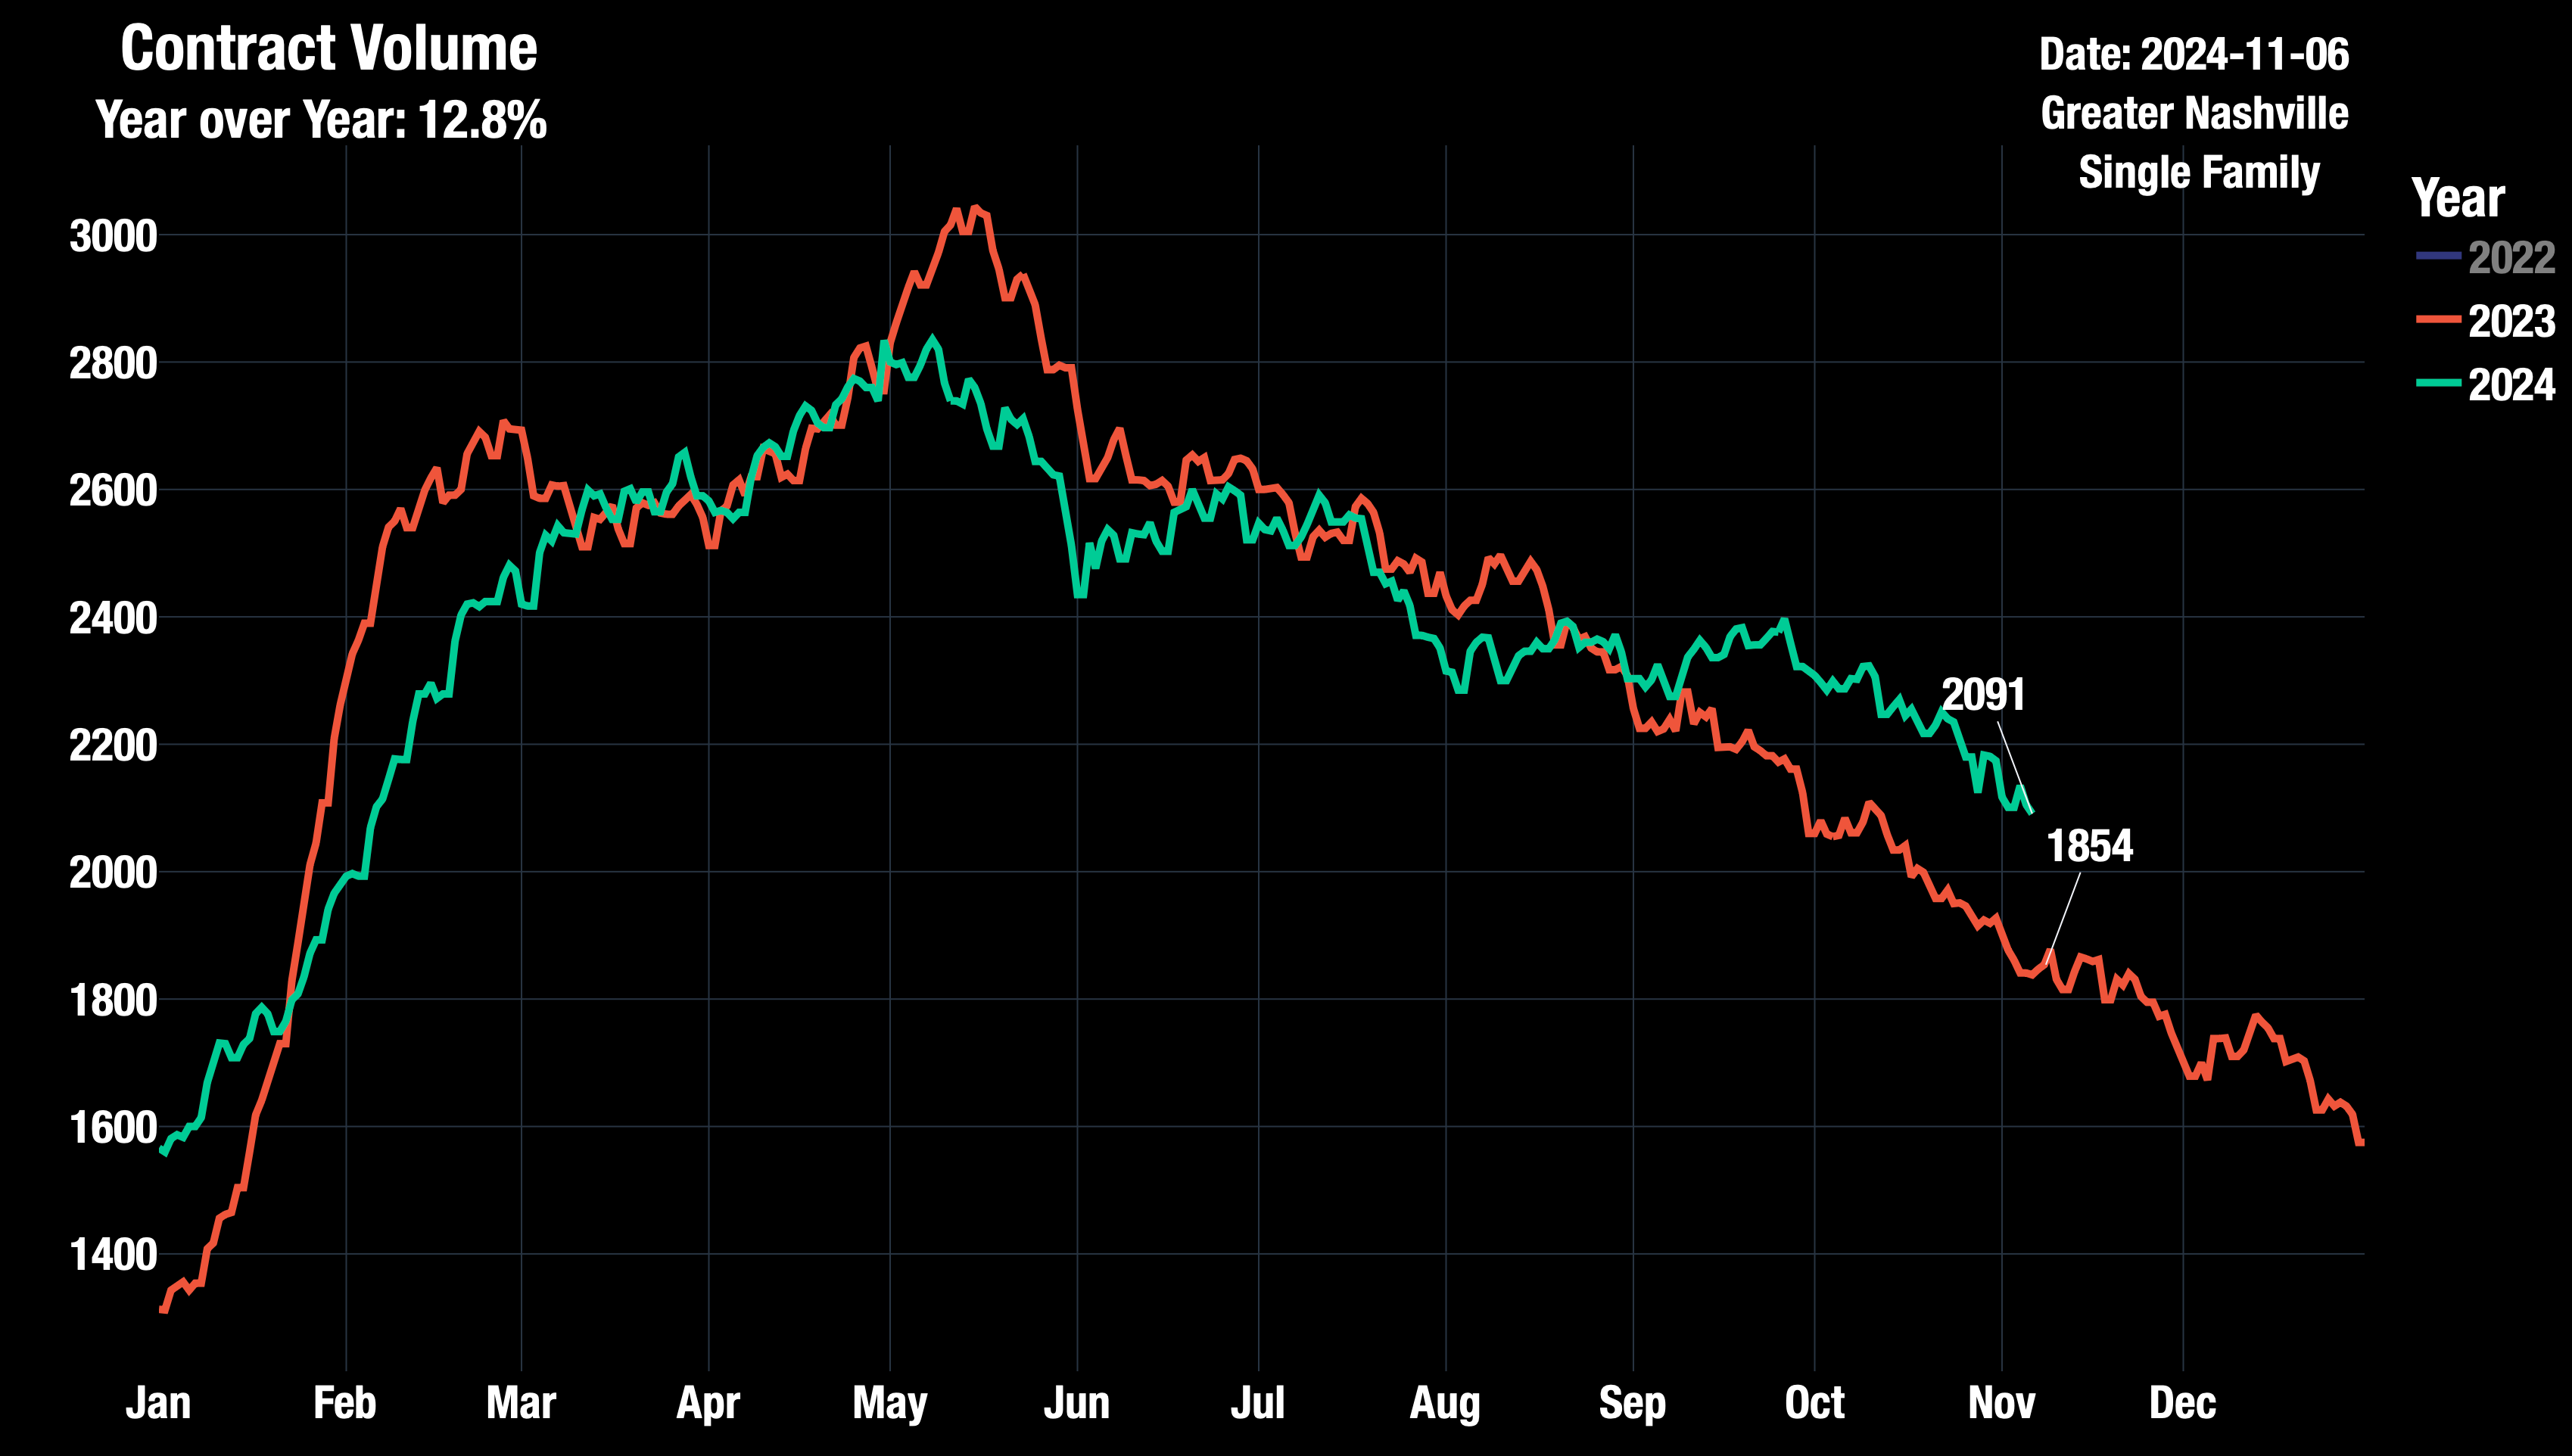
One possible reason is mix. We can see this by considering Median Price Per Ft vs just Median Sales Price. We get only 1.6% increase. This seems more reasonable as we are seeing some wild swings in price point and location. Demand is up 37.5% for Williamson County where 2,000 million dollar homes will be sold this year. While all of middle Tn is up only 13%.
Demand for Nashville’s Most Expensive County Up 37.5%
While Demand Across All Counties Up Only 12.8%
(small variances possible depending on exact timing of pull)
Median Sales Price - $490K:
Up +5% MoM / +4% YoY.
Down ~2% from 2022 peak of $500K (May 2022)
Forecast: Prices are stabilizing into November but will likely move up closer to $500K range, up another 2%. This is based on Contract Price hovering at $510K, and the median price tends to be $10-15K lower. Even though Price Cuts are higher than last year, they are trending down as a percentage of active listings.
Inventory Has Peaked for the Year: (click here if you want to see each county)
~8,107 (Active Listings + Under Contract - Showing) vs last year 7,057 and 2019 it was 8,164. Reminder: pre-pandemic inventory without pre-pandemic demand will create a massive buyers market.
Every Mid Tn County now has more Active Listings than last year. (click the link if you want to see each county)
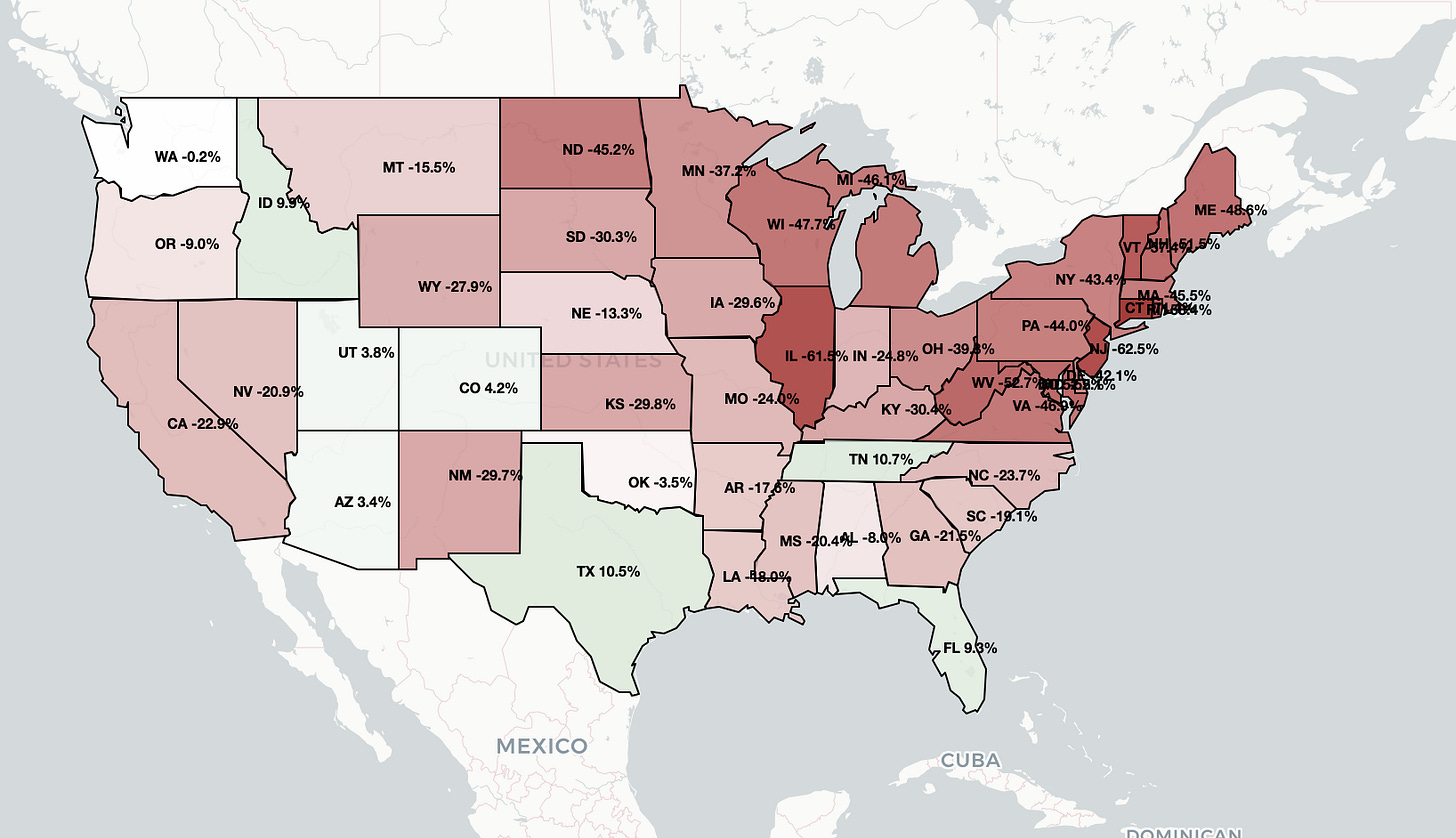
Check out my National Map of Realtor.com inventory LINK HERE
Close Volume: ~2,313 up ~10% vs Last Year
~2,313 up 10% from last year’s 2,113 and down 25% from October 2019 - 3,116. As inventory continues to exceed pre-pandemic levels; demand is only slightly recovering but still significantly lower than 2019. Pre-pandemic inventory without pre-pandemic demand is a red flag.
Here’s my latest video where I cover October data and also call out the massive surge in mortgage rates we are seeing today.

PAID LINKS BELOW (Assumable Active Listings, NHI Neighborhood Tracker)